ETH Swing Long Idea - RDM is in playETH Swing Long Idea
📊 Market Sentiment
FED has resumed its rate-cutting cycle, starting with a 0.25% cut in September, with two more 0.25% cuts expected in the coming months. Additionally, institutional liquidity inflows have accelerated as the U.S. officially adopts crypto as part of its reserves. While inflation remains elevated, the weakening labor market is forcing the FED to ease, driving more capital into risk-on assets.
📈 Technical Analysis
Price is in HTF bullish order flow, so I will only be looking for long setups.
ETH made its all-time high and is currently retracing to gather more energy for higher moves.
Price also ran the HTF Range Low liquidity, which contained significant liquidity — an engineered move I expect to lead the market higher.
📘 Range Deviation Model (RDM)
In this model, I define the HTF Range High/Low. I wait for price to run one side of the range liquidity (either Range High or Range Low), then close back inside the range. That becomes the entry trigger, targeting internal range liquidity first. If HTF trend supports, the opposite range liquidity becomes the full target.
📌 Game Plan
I will be playing the Range Deviation Model (RDM) here.
Looking for a daily close above 4065$ as validation.
🎯 Setup Trigger
Entry after daily close above 4065$.
📋 Trade Management
Stoploss: 4000$
Targets:
TP1: 4484$
TP2: 4700$
TP3: 4965$
💬 Like, follow, and comment if you find this setup valuable!
⚠️ Disclaimer: This content is for informational and educational purposes only and does not constitute financial, investment, or trading advice. Always DYOR before making any financial decisions.
ETHUSDT.P trade ideas

ETH Accumulation Trap ENTRY NOWI put analysis in previous ETH setup today.
TP Sl entry are good to go on this trade. The next hour might need to temporarily lift SL. Trade smart?!

Ethereum at Weekly Supply Zone – Possible Drop AheadHello everybody,
Price is currently at the weekly supply zone.
It has broken an upward trendline and pulled back to retest it.
A decline from this area is expected.
The most likely target is the nearest demand zone, around 3800.
Manage your risk and trade safe!

#ETH Bullish Head and Shoulders, Beware of a Rebound 📊 #ETH Bullish Head and Shoulders, Beware of a Rebound ⚠️
🧠From a structural perspective, we've found support at the weekly neckline support area, forming a bullish head and shoulders pattern, suggesting the possibility of a further rally.
➡️Note that we're currently near the 4-hour neckline resistance area. While further gains are possible, be wary of the risk of a pullback. Therefore, consider a small number of long trades. If a pullback occurs, buy again near the next support level of 4100.
🤜If you like my analysis, please like 💖 and share 💬
BITGET:ETHUSDT.P

Ethereum (ETH): Back Near $4000 | Huge Shakeout Going OnETH has had a nasty fall since breaking the long trend holders' EMAs. Since then we were looking for a reclaim of EMAs but what happened was the price bottomed at $4000, which is a strong support zone!
Every indicator is telling us the ETH is oversold and so we are looking for some kind of bounce to happen anytime soon, which would lead to a retest of EMAs, and then most likely back above them and movement to a new ATH!
Swallow Academy

ETH this week: stabilization after liquidations and ETF flows inFundamental approach
- ETH prices slipped this week amid a broad crypto pullback following a weekend wave of leveraged liquidations and profit-taking, even as prior spot ETF inflows and easing Fed policy supported risk appetite earlier in the week. Sentiment was volatile as traders digested mixed ETF flow signals and macro easing after the Fed's rate cut.
- The main impacting factors included a reported $1.5B in crypto long liquidations, which are pressuring majors. ETH prices posted their weakest two-day stretch since late Aug as risk unwound into Monday's session. Offsetting factors were mid-Sep net inflows into US spot ETH ETFs, led by BlackRock's product, and growing anticipation for Dec's Fusaka upgrade aimed at scaling Layer 2 data capacity.
- In the near term, ETH could stabilize if ETF flows remain favorable and macro conditions stay supportive; however, further deleveraging and data-sensitive risk sentiment could keep swings elevated. Upcoming catalysts include continued daily ETF flow prints, developer communications around the Fusaka timeline, and features that may influence medium-term adoption.
Technical approach:
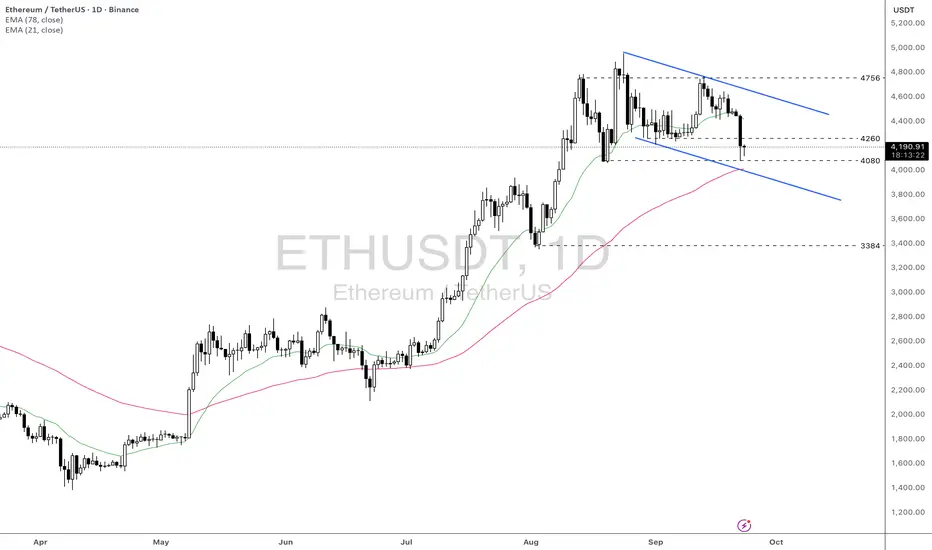
- ETHUSD is forming a lower high and lower low pattern within the defined range of 4080-4756. The price is awaiting a clear breakout to determine the upcoming trend.
- If ETHUSD breaks below the support at 4080, EMA78, and the descending channel's lower bound, the price may retest the following support at 3384.
- On the contrary, closing above 4260 may help ETH prices gain momentum to retest the descending channel's upper bound.
Analysis by: Dat Tong, Senior Financial Markets Strategist at Exness
ETH / USDT UPDATE :
🎯 Target 2 ($4,441) — HIT!
ETH delivered solid profits again. Well done to everyone riding the move! 💸
📉 A pullback is healthy here. We could see a retest of the $3,660 zone — a strong area for re-entry and accumulation.
📈 Next major target: $7,983 🔥

ETHUSDT 4h
CRYPTOCAP:ETH might be ready to pop!
Entry: $4,869
Target: $6,136
Consolidation looks like a spring ready to launch 🚀
Keep eyes on the breakout!
DYOR & NFA
#ETH #Crypto

DeGRAM | ETHUSD will retest the support level📊 Technical Analysis
● ETH/USD bounced from the 4,000 support zone after a false break, confirming strong demand and the validity of the long-term ascending channel.
● Price structure suggests potential upside with targets toward 4,950 resistance, supported by rejection wicks and consolidation above 3,920.
💡 Fundamental Analysis
● Ethereum’s momentum is fueled by rising institutional flows and expectations of ETH ETF approvals, strengthening medium-term bullish sentiment.
✨ Summary
ETH/USD holds above 4,000 with bullish recovery signals. Key support lies at 3,920, while upside targets remain 4,950. Momentum favors buyers in the medium term.
-------------------
Share your opinion in the comments and support the idea with a like. Thanks for your support!

ETH - First Key TestHere is a link to our last post:
We were seeing some market structure be build with three different bottoms come in around the $4,060 level.
However, last night those lows were breached which lead us to our first test of the macro support range.
This area ranges from about $3,700 to $3,950. It is very important as it was a level of resistance for many years and we would like to see the market establish this area as a new level of support. If this is established the trend will be intact to push toward highs.
We just saw the first test and bounce from the top of the box at $3,950. Will be key to monitor how the market reacts to this price action and will be looking for any further bottom developments in this macro support range.

#ETHUSDT 4H ChartPrice is still consolidating with no major changes. MACS is neutral, RSI is sold and EMAs are turning bearish. Price needs to break and close above the resistance at $4,275 in order to expect further bullish movements. Waiting for confirmation.

Ethereum 3 month candle 1 week left for the 3 month candle to close if it closes about the 3700 resistance then chances are it will continue the up trend hopefully it holds. To much interest from institutions buying eth no way it falls back down again

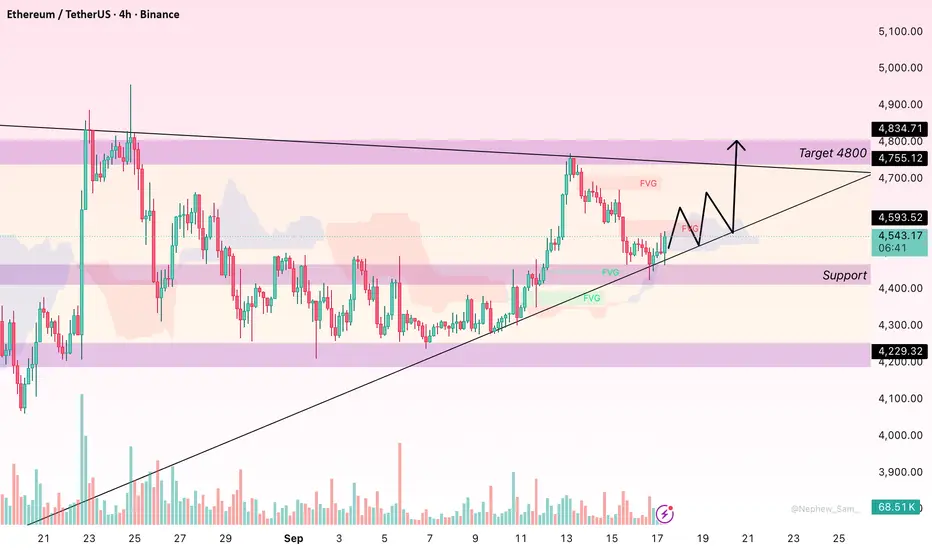
ETH Keeps Bullish Trend with Key Support LevelsHello everyone, Ethereum (ETH) is currently trading around $4,546, after correcting from the recent high of $4,800 down to $4,460. This area is an important support zone, along with $4,400, both of which are Fair Value Gaps (FVG) and could provide critical support if the market continues to pull back. The Ichimoku Cloud remains supportive of the bullish trend as the price stays above the cloud. However, the $4,600 level may act as short-term resistance that ETH needs to overcome before pushing higher towards the $4,800 mark.
On the fundamental side, Ethereum remains supported in the long term due to its transition to Proof of Stake and the growing demand in DeFi and NFTs. However, ETH’s price action is still closely tied to Bitcoin, so if BTC remains stable or continues to rise, ETH could gain additional momentum. Conversely, a significant pullback in Bitcoin could directly impact ETH. In the short term, it’s wise to monitor price action around the $4,460–$4,400 range. If ETH holds these levels, there’s a high likelihood it will bounce back to test $4,600, and possibly revisit the $4,800 peak.
ETH Price Outlook – Consolidation Phase Before ExpansionETH Price Outlook – Consolidation Phase Before Expansion
Ethereum has been trading with mixed sentiment after its recent surge, creating a period of indecision where both bullish and bearish flows are visible. The market has shifted from an impulsive rise into a phase of correction, where price is probing lower levels to test demand before establishing the next trend.
Recent activity shows sharp swings on both sides, reflecting a battle between profit-taking and fresh positioning. Sellers have been active, but each decline still encounters buyers stepping in, preventing a deeper breakdown. This pattern suggests that the market is in a balancing phase, where short-term pressure coexists with longer-term accumulation.
The overall structure points toward a scenario where current weakness may serve as a preparation stage for another expansion move. Volatility is likely to remain elevated, and once liquidity pockets are cleared, momentum could shift more decisively, paving the way for stronger directional movement.

eth bullish 5400$“Ethereum is fluctuating in an uptrend, and we may witness a price rise to $5,500–$6500.
.
.
The stop level for the trade is set at $3,900.”

ETH New Update (4H)This analysis is an update of the analysis you see in the "Related publications" section
Honestly, as you know, the market had been ranging for several days without much movement. On the chart, we had signs of a drop, but the drop didn’t happen, and instead the market dropped in a way that was shown.
Considering that the demand zone has held and the market is still ranging, we can return to the scenario of (this analysis () and expect to see some recoveries from Ethereum.
Either Ethereum can get rejected from the identified supply zone, or it can make a new all-time high afterwards.
For risk management, please don't forget stop loss and capital management
When we reach the first target, save some profit and then change the stop to entry
Comment if you have any questions
Thank You

ETH - Roll back - Its coming baack to 4500SO mods told me to write it big, so eth looks good for a pullback like I have drawn and corresponding to it, moves super well as seen and what.i drew

Analytical deadlockAfter the news, Ethereum has reached a price point where no position can currently be taken. It’s very close to its all-time high, so it’s not suitable for a short, and at the same time, the trend isn’t bearish. On the higher timeframe, a triangle pattern has formed, and if this pattern gets activated, Ethereum could break its all-time high — but I don’t think this will happen anytime soon. ✅

Ethereum $ETH similar price action to late JuneIt's not perfect look to see CRYPTOCAP:ETH losing the daily range
However, the current PA oddly reminds me of one from late June
RSI and AO are similar as well
The next few days will be interesting to see if they are trying to scare the paper hands before the generation run, or the generational run is getting postponed for now

ETH - Current Levels Post Rate CutHere is the chart for pre rate cuts:
After about a week of price action development we have a much better idea for the next potential move for ETH.
After the rate cut (vertical purple line) we saw price have a small rally followed by a swift move to the downside.
Our green trendline (current support trendline) was breached which caused a crash from around $4,400 to $4,070.
Now price has established a clear low for the time being around the $4,070 level. This shows what looks like a TRIPLE BOTTOM (black arrows + black ray)!
There is currently strong demand at the level which should help push price back to the $4,400-$4,500 level.
If we do so this move to the upside it will be very important to watch how price action plays with our green support trendline. Now that price is below that trendline, any retest could act as a new level of sell pressure.
Right now things look good for a move back to that level, but if our triple bottom around $4,070 is closed below then a move into that macro support range will be likely.

Ethereum (ETH): Target Remains Same | Bullish For $5555ETH is still close to EMAs, a zone that has been holding the price for quite some time now.
Despite that, we are seeing smaller signs of buyers dominance so nothing changes for us.
We still look for the price to stay above the EMAs and as long as we do so, our target will be $5555 (a phantom resistance, let's call it, as it has not been reached yet).
Swallow Academy

Long trade
30min TF overview
Pair: ETHUSDT
Direction: Buyside trade
Date/Session: Fri 19th Sept 2025, NY Session PM
Timeframe: 30-Min
🔹 Trade Details
Entry: 4461.47
Profit Level: 4855.75 (+8.89%)
Stop Level: 4416.04 (-1.00%)
Risk-Reward (RR): 8.59
🔹 Technical Structure
Fair Value Gaps (FVGs):
Overhead FVGs at ~4655 – 4855 are acting as a potential magnet for liquidity.
Liquidity Levels:
Clear sweep of prior lows around 4460 (stop hunt/liquidity grab).
Buyside liquidity resting above 4650–4700.
Order Blocks / Demand Zones:
Strong demand block at ~4450–4460 region, now acting as support.
🔹 Indicators
RSI: Deeply oversold (below 30), hinting at bullish reversal probability.
Volume: Large spike at lows, confirming stop run and potential smart money entry.
Moving Averages: Price reclaiming short-term EMA, indicating early momentum shift.
🔹 Narrative / Trade Rationale
Market engineered a stop hunt into demand at 4460 before reversing.
High volume and RSI oversold strengthen the buy-side reversal case.
The trade aims to capitalise on the move back into inefficiencies (FVGs) left behind by the previous sell-off.

#ETHUSDT 12H ChartPrice broke below the 4h demand zone at $4,400 turning it into a 4h breaker zone. MACD is bearish, RSI is nearly oversold and EMAs are neutral. Price bounced off the support at $4,080 after sweeping the equal lows at $4,200 and we should see a retest of the S/R flip at $4,260 as a short-term target.
