Last chance to hit Eth before new ATHWe’ve noticed that on the daily chart, whenever Ethereum reaches oversold conditions during an uptrend, it often presents a solid buying opportunity. Looking at the latest chart, you can see that the last two times this happened, they marked the bottom. Now, we’re testing the daily oversold zone for the third time after a while. To me, this signals that we’re on the right track to form a bottom and continue upward. Of course, if you decide to buy, the responsibility is entirely yours.
ETHUSDT trade ideas

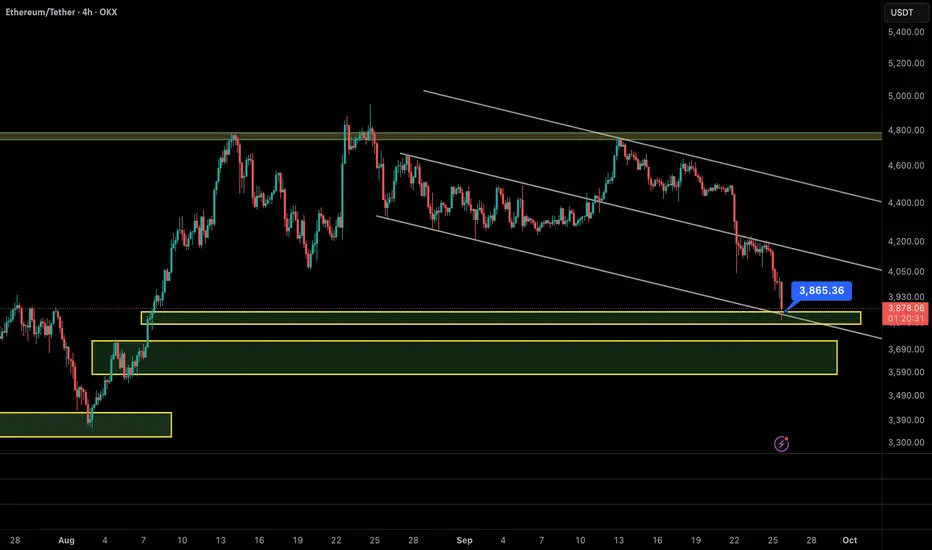
ETH/USDT -> Clear Head & Shoulders → bearish biasHello guys!
Pattern: obvious Head & Shoulders on the 4-hour. The neckline was taken out by a large bearish candle, which is a good confirmation of the breakdown.
Retest: price is testing the broken neckline/supply zone (blue box). The current action is a classic retest → if it gets rejected here again, probability favors more downside.
Target: the measured move projects into the red box; roughly ~$3,850 (range $3.7k–$3.9k depending on where you measure the neckline/head). This level also lines up with the last major resistance zone, so it’s a natural magnet.
Momentum: RSI showed divergence around the head and has dropped into oversold territory with a small relief bounce.
Invalidation: a clean, sustained reclaim and close back above the blue supply zone (above ~4.32–4.40k with conviction) would invalidate the immediate H&S bearish thesis and open the door for a deeper retrace.
-----------------------
A simple trade idea:
Short on a failed retest of the blue box (4.20–4.32k) after a bearish price candle.
Stop: just above the supply zone / last swing high.
Targets: scale profits into 3.9k then 3.8k (final target ~3.7–3.9k). Trail if price action turns constructive.
Manage risk: keep position sizing sensible.

Ethereum Price Hits 6-Week Low, But Here Lies An OpportunityAt press time, Ethereum is trading at $3,938, attempting to establish $3,910 as a support floor. This decline marks a crucial break below the $4,000 level, highlighting short-term weakness.
Given current signals, ETH may remain rangebound under $4,074 resistance until stronger bullish cues emerge. Market sentiment suggests consolidation rather than sharp recovery, keeping investors cautious.
However, if Ethereum flips $4,074 into support, a push toward $4,222 could follow. This move would require investor participation and sustained inflows to counter bearish momentum, ultimately invalidating the short-term negative outlook.

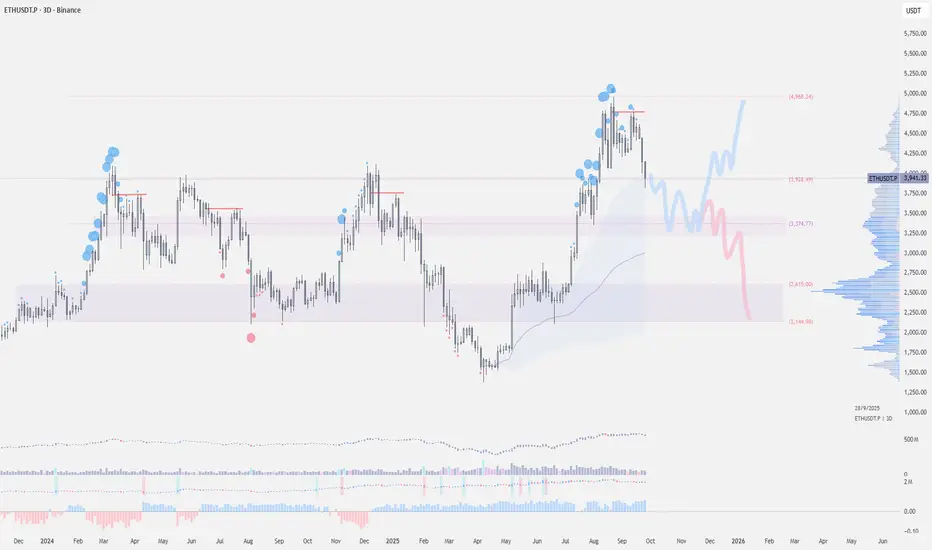
$ETH - Bounce Back or Break Down?BINANCE:ETHUSDT | 3d
Ethereum has experienced a roughly 13% decline over the past week, primarily due to deleveraging triggered by shifting expectations around rate cuts. The chart indicates that each time the price tests a previous high for the second time, it tends to decline in a bearish retest.
The $3800 level is a critical support zone. If this support holds, it could pave the way for a rally, potentially retesting the $4800–$5000 range.
However, a break below $3,800 could lead to further declines, targeting the $3500–$3200 zone. In a more bearish scenario, a drop to $2600–$2400 is possible.
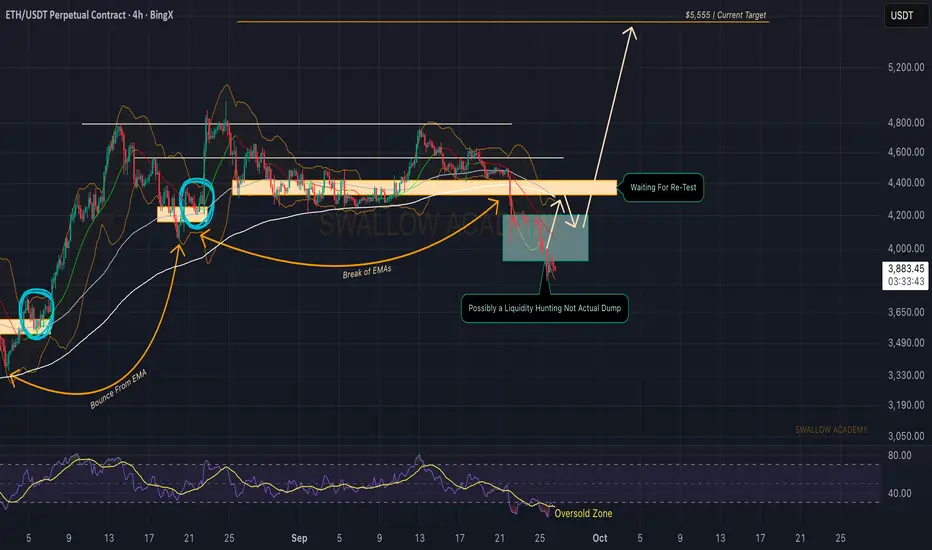
Ethereum (ETH): Buyers Are Being Wiped Out | Bullish AF!The pressure from sellers continues, which is not giving us any clear signs of recovery yet to take place. Despite that, we are still in a bull market, so we have not switched the narrative to being in a bear market (not yet).
ETH is having a similar pattern to BTC when it was forming new ATHs: a strong liquidity grab and dips near previous ATHs before just breaking out and forming new ATHs.
Expecting ETH to follow the pattern so we keep on looking for that new ATH!
Swallow Academy
A bounce to 4200 is on the cardsRSI is oversold, ETH is at the support. Everyone in Twitter is Bearish. A short term bounce to 4200 is on the cards. Then we will continue the dump.
Ethereum Tests $3,900 Support as Bulls Defend Critical Support Ethereum (ETH/USDT) has faced notable selling pressure in recent days, bringing price action down to test a high-confluence support region at $3,900. This area, sitting directly on the 0.618 Fibonacci retracement and VWAP support, will play a decisive role in whether ETH resumes its uptrend or enters a deeper correction phase. Traders are closely watching this level to gauge short-term momentum and potential longer-term implications.
Key Technical Points
- Support Test: Ethereum is holding at $3,900, confluenced by the 0.618 Fibonacci retracement and VWAP support.
- Upside Potential: A higher low at this level could reignite bullish continuation toward new highs.
- Downside Risk: A breakdown exposes ETH to a deeper correction toward $3,454.
The correction over the past few days has erased some of Ethereum’s recent gains, but the structure remains broadly bullish as long as $3,900 holds. Historically, the 0.618 retracement has often served as a springboard for continuation moves during trending markets, making this level technically significant.
From a structural perspective, the bullish thesis rests on the establishment of a higher low at $3,900. If confirmed, Ethereum could resume its upward trajectory, building momentum toward key resistance zones. However, the alternative scenario of losing this level would signal deeper weakness, opening the door to a correction down to $3,454, where the next liquidity pool resides.
Ethereum’s movement has mirrored the broader market correction, but relative strength has kept the macro structure intact. On-chain activity, coupled with demand for ETH in DeFi and staking protocols, continues to provide a supportive backdrop. Still, the next few daily closes around this support region will be decisive.
What to Expect in the Coming Price Action
If Ethereum holds the $3,900 confluence level, expect the market to build a higher low, setting the stage for bullish continuation. A sustained close below this level, however, would trigger a deeper retracement toward $3,454, where bulls would need to regroup.

Ethereum Analysis – Climbing Step by Step🚀 Ethereum (ETH/USDT) Analysis
📌 The purple line shows my own projection.
📌 The small rectangles represent a steady, step-by-step growth in price.
📌 This structure on the chart indicates that the market is gathering strength at certain levels before moving higher.
✨ In short, the market seems to be recharging with corrections and getting ready for new highs.
👉 Target zones are marked above. Let’s see if my projection plays out!
💡 Do you think this scenario will happen? Or will the price take another path?

Ethereum. Watching the 3,880–4,060 Zone: Setup for a New ATH?Hi traders and investors!
This analysis is based on the Initiative Analysis concept (IA).
The price has entered the 3,880–4,060 range — the scenario I was waiting for in the related post.
The September 25 seller candle is an IC candle and shows the highest volume since August 22.
And with September — typically a weak month for asset growth — coming to an end, we watch closely.
On the daily timeframe, the price is in a sideways range. The black lines mark the boundaries of this range. We’re waiting for the price to return back inside, absorb the seller’s candle that broke the lower boundary, and then it will be possible to look for buy setups targeting a new local ATH.
Wishing you profitable trades!

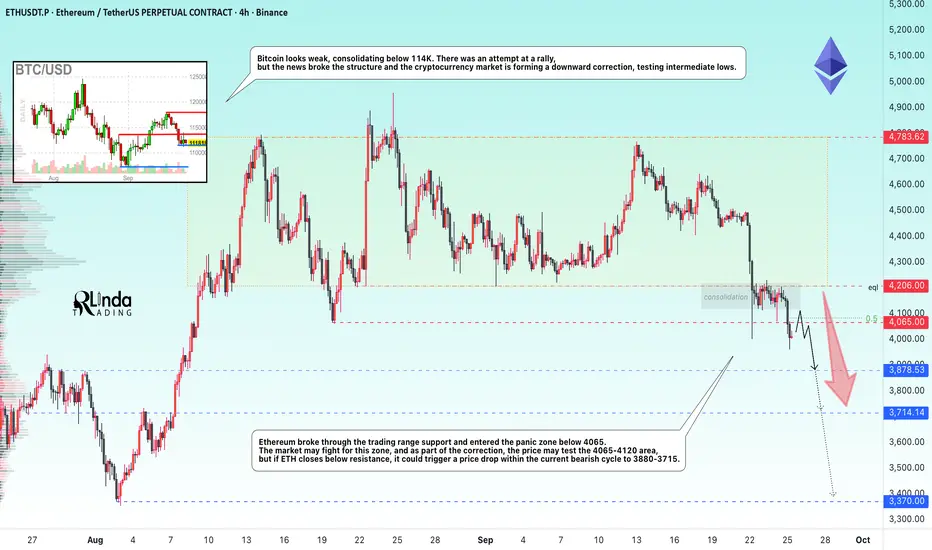
ETHEREUM → False breakout of 4100. Panic?BINANCE:ETHUSDT is forming a false breakout of resistance on the daily chart, formed by the ATH of the previous bullish cycle - 4100. Closing below this level could cause panic in the market...
Bitcoin looks weak, consolidating below 114K. There was an attempt at a rally, but the news broke the structure and the cryptocurrency market is forming a downward correction, testing intermediate lows.
Ethereum broke the support of the trading range and entered the panic zone - below 4065. The market may fight for this zone, and as part of the correction, the price may test the 4065-4120 area, but if ETH closes below resistance, it could trigger a price drop within the current bearish cycle to 3880-3715.
Resistance levels: 4065, 4120, 4206
Support levels: 3880: 3715, 3370
On D1, the structure is weak, the price breaks through 4100-4090 and consolidates in the sales zone. Everyone who bought above 4100 can now start active sales due to the activation of stop orders, panic, fear, and the reversal of their positions. If the market does not receive support (bullish driver), the correction may continue. The nearest target is 3878 - 3715 7 3400
Sincerely, R. Linda!
Eth Macro tradeBased on Elliott Wave I believe a new high is quite possible, and based on another trading method the shown seem like reasonable levels to go long, especially if we get that larger wave 4 in the local price action. Wait for the wave 4 (we are on larger 4 of 5 (unless previous rally was a 3)

Ethereum — The Big Wave Towards New Highs, Bullish 10k?📝 Full Analysis
Ethereum (ETH/USDT) on the 1W timeframe is showing a clear 5-wave Elliott Impulse structure. Currently, price is assumed to be in the (4) corrective phase after wave (3) peaked around the 4.9k–5k zone.
Wave (4) is now retesting the critical support zone between 3.21k – 3.54k, which perfectly aligns with the Fibonacci retracement 0.5–0.618 levels. This area also acts as a key demand zone (previous resistance now flipping into support).
If this zone holds, ETH is well-positioned to start wave (5), targeting new all-time highs. But if this level breaks, ETH could fall into a much deeper corrective scenario.
---
🔑 Key Levels on the Chart
Main Support (yellow zone):
0.5 = 3,541
0.618 = 3,210
Bullish Extension Targets (Wave 5):
0.5 = 4,940
0.618 = 5,272
1.0 = 6,345
1.618 = 8,082
2.618 = 10,891
These are not just Fibonacci levels, but psychological points where the market often decides whether to continue or reverse.
---
📈 Bullish Scenario
1. Support 3.21k–3.54k holds → confirms wave (4) completion.
2. ETH prints a weekly rejection candle or bullish engulfing → buyer strength confirmed.
3. Breakout above 4.95k activates bullish momentum with staged targets:
Target 1 → 5.27k (0.618 extension)
Target 2 → 6.34k (1.0 extension)
Extended Target → 8.08k (1.618 extension)
Maximal Target → 10.9k (2.618 extension, potential new ATH)
4. Wave (5) is often accompanied by volume surge & market euphoria → a prime opportunity for swing traders and mid-term investors.
---
📉 Bearish Scenario
1. ETH closes below 3.21k weekly → weakens bullish wave structure.
2. Possible deeper retracement:
2.13k (0.5 retracement from macro impulse)
1.95k (0.618 retracement)
3. If ETH breaks below ~1.95k, the 5-wave Elliott structure becomes invalid, and the market could enter a prolonged accumulation/sideways phase similar to 2018–2019.
---
🔍 Pattern Breakdown
Elliott Impulse Wave (1–5) with strong extended wave (3).
Fibonacci retracement & extension for precise S/R validation.
Resistance → Support Flip Zone (3.2k–3.5k).
Potential Bullish Flag Structure (macro) if wave (4) is confirmed as a healthy correction.
---
🎯 Extra Insights
Wave (5) is usually shorter than wave (3) if wave (3) was already extended → realistic target sits around 6.3k–8k.
If crypto market euphoria (ETH ETF narrative, altseason) kicks in, then 10k+ ETH becomes a valid macro target.
Caution: wave (4) often forms complex corrections (flat/triangle), meaning sideways consolidation before the breakout.
---
🛡️ Trading Notes
Conservative entry: wait for weekly rejection confirmation at 3.2k–3.5k.
Aggressive entry: buy the dip in support zone with tight stop below 3.2k.
Breakout entry: wait for breakout + retest above 4.95k.
Take profit progressively: 5.2k → 6.3k → 8k.
---
Ethereum Weekly is forming a 5-wave Elliott Impulse. Currently, price is testing the critical support zone at 3.21k–3.54k.
If this zone holds → ETH is ready for wave (5) rally targeting 5.2k → 6.3k → 8k → even 10.9k.
If this zone fails → ETH risks a deeper correction towards 2.1k–1.95k.
This is the decisive moment for ETH: either break into new ATHs or enter a prolonged correction.
Not financial advice — manage your risk.
---
#Ethereum #ETHUSDT #CryptoAnalysis #ElliottWave #Fibonacci #CryptoTrading #SwingTrading #WeeklyChart #PricePrediction #AltcoinSeason

Hot Investment Sectors to Watch in 2025:Future of Global Capital1. Artificial Intelligence and Machine Learning
Artificial Intelligence (AI) and Machine Learning (ML) continue to be at the forefront of technological innovation. In 2025, AI is increasingly integrated into various sectors, including healthcare, finance, and manufacturing, driving efficiency and creating new business models. The proliferation of AI-as-a-Service platforms and advancements in natural language processing and computer vision are expanding the applicability of AI across industries.
Key Investment Areas:
AI Software and Services: Companies developing AI algorithms and providing AI solutions are experiencing rapid growth. Investments in AI startups and established tech firms focusing on AI capabilities are gaining momentum.
Automation and Robotics: The adoption of AI-driven automation in manufacturing and logistics is enhancing productivity and reducing operational costs. Investors are keen on companies leading in robotics and automation technologies.
AI Infrastructure: The demand for specialized hardware, such as AI chips and data centers optimized for AI workloads, is rising. Investments in semiconductor companies and cloud infrastructure providers are attracting attention.
Risks and Considerations:
Ethical and Regulatory Challenges: The rapid development of AI raises concerns about privacy, security, and ethical implications. Investors must stay informed about evolving regulations and public sentiment regarding AI technologies.
Market Volatility: The AI sector is characterized by high volatility, with startups experiencing significant fluctuations in valuations. Diversification and thorough due diligence are essential for mitigating risks.
2. Renewable Energy and Clean Technologies
The global shift towards sustainability is accelerating investments in renewable energy and clean technologies. In 2025, the International Energy Agency (IEA) projects global energy investment to reach a record $3.3 trillion, with $2.2 trillion allocated to renewables, nuclear, and energy storage—double the amount for fossil fuels.
Key Investment Areas:
Solar and Wind Energy: Solar energy leads clean technology spending with $450 billion expected, driven by increased exports to emerging economies. Wind energy financing, both onshore and offshore, grew by about 25%, particularly in China and Europe.
Energy Storage Solutions: Battery storage investment is rising to about $66 billion, addressing the intermittency of renewable power sources.
Grid Infrastructure: Investments in grid modernization and smart grid technologies are essential to accommodate the increasing share of renewable energy in the power mix. The IEA highlights a shortfall in grid infrastructure spending, currently at $400 billion annually, which lags generation investments and poses risks to electricity security.
Risks and Considerations:
Policy and Regulatory Risks: Changes in government policies and subsidies can significantly impact the profitability of renewable energy projects. Investors should monitor policy developments and government incentives in key markets.
Technological Risks: Advancements in energy storage and grid technologies are critical for the integration of renewable energy. Investors should assess the technological maturity and scalability of solutions offered by companies in this sector.
3. Healthcare Technology and Biotechnology
The healthcare sector is experiencing a technological renaissance, with innovations in biotechnology, digital health, and personalized medicine transforming patient care and treatment outcomes. The "biotech boom" refers to a period of rapid growth in the biotechnology sector, fueled by groundbreaking innovations, increasing investments, and expanding global demand for advanced medical, agricultural, and environmental solutions.
Key Investment Areas:
Biotechnology: Advancements in gene editing technologies like CRISPR, immunotherapies, and regenerative medicine are opening new frontiers in disease treatment. The biotech market is projected to grow from $1.74 trillion in 2025 to $5.04 trillion by 2034.
Digital Health: Telemedicine, wearable health devices, and AI-driven diagnostics are revolutionizing healthcare delivery. Investments in healthtech startups and digital health platforms are gaining traction.
Pharmaceuticals: The development of personalized medicines and targeted therapies is enhancing treatment efficacy and patient outcomes. Pharmaceutical companies focusing on innovative drug development are attracting investor interest.
Risks and Considerations:
Regulatory Hurdles: The healthcare industry is heavily regulated, and changes in regulations can impact the approval and commercialization of new therapies and technologies. Investors should stay informed about regulatory developments in key markets.
Clinical Trial Uncertainties: The success of biotech investments is often contingent on the outcomes of clinical trials. Investors should assess the risk profiles of companies based on their clinical trial pipelines and success rates.
4. Cybersecurity
As digital transformation accelerates, the need for robust cybersecurity measures becomes paramount. In 2025, the cybersecurity sector is experiencing heightened demand due to increasing cyber threats and regulatory requirements for data protection.
Key Investment Areas:
Cybersecurity Software and Services: Companies providing endpoint security, cloud security, and threat intelligence services are witnessing increased adoption across industries.
Identity and Access Management: Solutions that ensure secure user authentication and access control are critical as organizations move towards zero-trust architectures.
Security Infrastructure: Investments in hardware and infrastructure that support secure networks and data centers are essential for protecting organizational assets.
Risks and Considerations:
Evolving Threat Landscape: Cyber threats are constantly evolving, and companies must continuously update their security measures to address new vulnerabilities. Investors should assess the adaptability and innovation capabilities of cybersecurity firms.
Market Competition: The cybersecurity market is highly competitive, with numerous players offering similar solutions. Investors should evaluate companies based on their market positioning, technological differentiation, and customer base.
5. Infrastructure and Real Estate
Infrastructure development and real estate investments remain attractive in 2025, driven by urbanization, population growth, and government spending on public works. The global infrastructure investment gap presents opportunities for private capital to participate in large-scale projects.
Key Investment Areas:
Smart Cities: Investments in urban infrastructure, including transportation, utilities, and communication networks, are essential for developing smart cities.
Green Building Projects: Sustainable construction practices and energy-efficient buildings are gaining popularity, driven by environmental regulations and consumer preferences.
Public-Private Partnerships: Collaborations between governments and private investors in infrastructure projects offer opportunities for stable returns and long-term growth.
Risks and Considerations:
Political and Regulatory Risks: Infrastructure projects are subject to political decisions and regulatory approvals, which can impact project timelines and profitability. Investors should assess the political stability and regulatory environment of the regions where they invest.
Capital Intensity: Infrastructure investments often require significant capital outlays and have long payback periods. Investors should consider the liquidity and financial stability of infrastructure funds and projects.
Conclusion
The investment landscape in 2025 offers a plethora of opportunities across various sectors, each driven by unique technological advancements, societal shifts, and economic factors. While these sectors present promising growth prospects, they also come with inherent risks that require careful consideration and strategic planning. Investors should conduct thorough due diligence, diversify their portfolios, and stay informed about global trends to navigate the complexities of the evolving investment environment successfully.

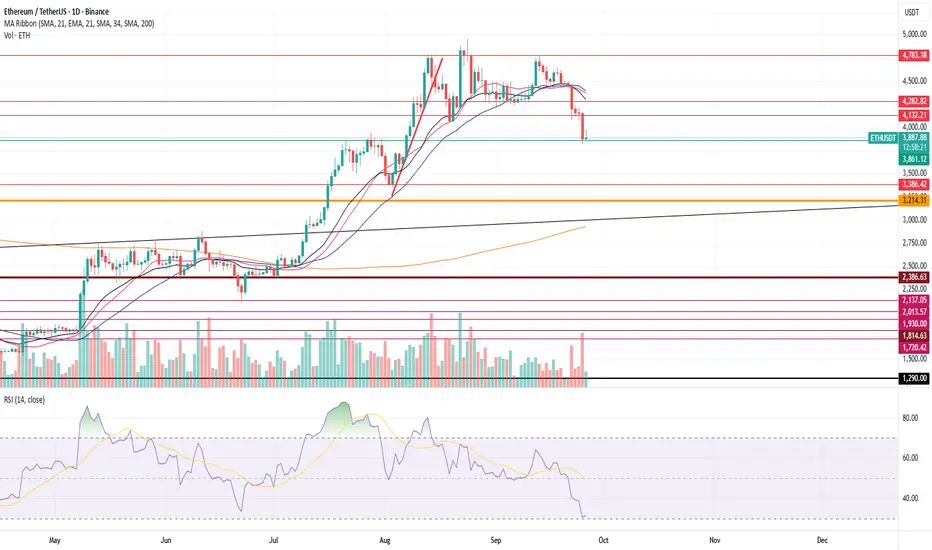
ETHEREUM LAST STAND..Ethereum is above the daily EMA100 and long-term support line, with bullish RSI divergence, making me very bullish on Ethereum from here.

ETH short trade Eth is very downtrend. Price is approaching to supply area with rsi indicating overbought level. We have a clean break of Structure which shows selling pressure is still active.
Moreover, with the multi time frame analysis, the price is below 200 ema which correlates with the 4hr, 1hr, 30m, and 15m, signaling a bearish bias.

ETHUSDT - Faces Downtrend👋Hello everyone, glad to see you again. Let’s take a look at BINANCE:ETHUSDT !
Currently, Ethereum is moving in a clear downtrend. After breaking through the support zone, the decline has intensified. The current resistance levels are around 4,300 USD and 4,450 USD. If the support at 4,100 USD is not held, ETH may continue to experience further correction.
With the Fed's rate cuts and geopolitical issues like the Russia-Ukraine conflict increasing market instability, capital is flowing out of riskier assets like cryptocurrencies. This will continue to put downward pressure on ETH.
Unless there's a reversal from this zone, the strategy and scenario mentioned above seem likely. My target is a short-term price decline. What about you?
Feel free to leave your thoughts in the comments below.
Good luck!


Peter Schiff bearish posting about Ethereum at S/R levelInteresting to see FUD at S/R levels
Short support & sell the bottom
Trade your charts not others opinions

ETH Elliott Wave - WXY Correction Complete soon!This chart analyzes Ethereum (ETHUSD) at the conclusion phase of a major WXY corrective structure, highlighting the technical environment for a new impulsive wave sequence. Price action is assessed using multiple technical indicators:
Elliott Wave Structure: The chart maps a completed 1-2-3-4-5 impulse, followed by W–X–Y corrective waves. The final Y leg approaches the critical Point 4 support, maintaining overall cycle validity and setting the stage for significant trend reversal once completed.
Ichimoku Cloud: ETH price is currently testing the lower bounds of the Ichimoku cloud, reinforcing a major support zone. A close above the cloud would further validate trend reversal; a breakdown would signal extended bearish pressure.
Volume Profile: Recent sessions show a spike in trading volume as price approaches historical support levels, indicating potential capitulation and increased probability of trend exhaustion.
Fibonacci Retracement: Key supports are identified at the 38.2%, 50%, and 61.8% levels, with the 38.2% zone (around $3,600) as a strong candidate for final Y wave completion based on confluence with cloud and momentum indicators.
RSI and Stochastic RSI: Both relative strength oscillators are in oversold territory, consistent with the final stages of a corrective structure. A bullish crossover or RSI divergence would strengthen the reversal thesis.
CVO/OBV: Volume-based momentum indicators confirm heavy participation during the latter stages of the sell-off, validating the probability of a strong bounce once buyers re-enter.
Scenario Outlook:
The analysis anticipates that, upon completion of the WXY correction—ideally above the Point 4 support (roughly $3,350)—Ethereum is set for a new impulsive uptrend as part of the final bull market rally. The setup favors strategic accumulation in the defined support zones, with projected upside targets ranging from previous all-time highs (~$4,950) to extended Fibonacci projections should the market move through a classical 1-2-3-4-5 impulsive wave.

ETH Charts ETH Charts
POI: it is at 3745, worst to comes to worst it will bounce from 3745. It looks like it has to retest 4100 - 4200 zone.
Everything is good, It has to stay above 3750!
Best Buy;
1. 3875
2. 3750

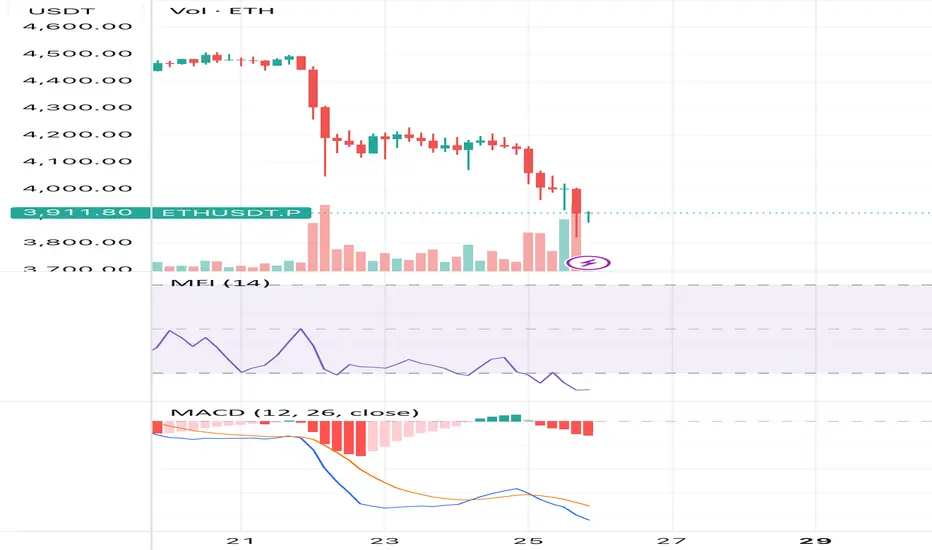
Activation trigger: 4h-close > 3977 (KC-Lower recap)Snapshot (last 4h-candle) — with the meaning of each indicator
• Price: ~3910.5 — current base point.
• VWAP (entire period): ~4245.2; z(Price−VWAP) ≈ −2.72 — price is significantly lower than "fair" (by VWAP), deviation is stronger than usual → increased probability of average return.
• aVWAP (anchors): start 4245.2, 60d 4256.0, from swing low 4036.6, from swing high 4020.0 — below swing anchors ⇒ sellers are locally dominant; below global (start/60d) ⇒ the cycle is still under pressure.
• Donchian 20: High 4228.8 / Mid 4025.1 / Low 3821.3 — boundaries of the local trading frame; Mid is often the target of rotation.
• Donchian 55: High 4643.7 / Mid 4232.5 / Low 3821.3 — "higher" range; breaking Mid changes the balance.
• Volume Profile (~60d): POC ~4490.5, VAL ~3627.2, VAH ~4778.2 — we are far below POC, inside the value-area; POC is a "magnet" for returns.
• HVN (volume nodes): ~4275–4420 and 4538–4610 (stable supply/demand zones).
• LVN (thin spots): ~3939, 4059–4107, 3723, 3435–3531 (slippery acceleration corridors).
• RSI(14): ~16.3 — deep oversold; often anticipates a rebound (but not always immediately in a strong trend).
• MFI(14): ~8.5 — oversold, taking into account volume; reinforces the thesis about a technical bounce.
• CMF(20): ~−0.06 — light capital outflow; for a stable reverse, you need ≥0.
• MACD(12/26/9): line −98.6 < signal −85.5, hist. −13.2 — bearish impulse is still active, the histogram is shrinking → impulse weakening.
• ADX/DMI(14): ADX ~63.0; +DI ~3.4 / −DI ~42.8 — very strong downtrend (−DI ≫ +DI).
• ATR(14): ~81.8$ — characteristic 4h swing; used for buffers.
• Keltner: Upper 4285 / Mid 4131 / Lower 3977 — the price is below KC-Lower: statistically, this is the mean-reversion zone to Mid (if the market makes a level recap).
• Bollinger(20,2): Upper 4291 / Mid 4126 / Lower 3960 — below BB-Lower; mean-reversion to 4126 is likely when the trend weakens.
• BB-Squeeze: OFF — no squeeze; volatility is already open.
• z(Price−VWAP) ≈ −2.72 — the "discount" to VWAP is abnormally large → extreme on the selling side.
• OBV z-scores: z50 −1.98 / z100 −2.56 / z200 −2.93, OBV ROC(10) ≈ −0.16 — volume background for the fall (distribution), no fresh influx of buyers is visible.
• Open Interest: ~1.05M, z(168) ≈ −0.07, ROC(5/10) ≈ +0.05/+0.05 — moderate set of positions on the decline (it looks like shorts were added); this strengthens trend continuations, but also creates fuel for short-squeeze at the recap.
Latest divergences (auto-detector)
• RSI: bullish on Aug 18 07:00 → Aug 19 03:00, bearish on Aug 24 03:00 → Aug 24 19:00
• MACD: bullish on Sep 8 19:00 → Sep 9 15:00, bearish on Sep 15 23:00 → Sep 17 07:00
• OBV: bullish 7 Sep 19:00 → 8 Sep 07:00, bearish 15 Sep 23:00 → 17 Sep 07:00
• MFI: bullish 7 Sep 19:00 → 8 Sep 07:00, bearish 10 Sep 15:00 → 11 Sep 07:00
⸻
What does it mean now
1. Mode: an extremely strong downward trend (ADX>60), with RSI/MFI in deep oversold, and the price below KC/BB-Lower and significantly below VWAP → a technical rotation towards the averages is statistically imminent; without confirmation, the market may still "slide along the lower edge."
2. Profile: under the upper HVN and significantly lower than POC ~4490 → KC/BB-Mid (≈4130) and Donch-20 Mid (4025) will act as a magnet on a stable recap round; above is 4232 (Donch-55 Mid).
3. Derivatives: OI slightly ↑ on red bars and OBV-z strongly neg. — downward extensions are possible, but with the first powerful recap, there is a chance for a short-squeeze.
⸻
Key levels
Resistance: 3977 (KC-Lower) → 4025 (Donch-20 Mid) → 4126/4131 (BB/KC-Mid) → 4232 (Donch-55 Mid) → 4285/4291 (KC/BB-Upper) → HVN-cluster 4275–4420 → 4490 (POC).
Supports: 3960 (BB-Lower) → 3939 (LVN) → 3821 (Donch-Low 20/55) → 3723 (LVN) → 3627 (VAL) → 3531/3459/3435 (LVN-pockets).
⸻
Scenarios and triggers (not the financial council)
A) Basic - rotation to the middle (4025 → 4126/4131)
Status: not activated yet (close < KC-Lower).
• Activation trigger: 4h-close > 3977 (KC-Lower recap) and better > ~4018 (KC-Lower + 0.5×ATR, ATR≈81.8), with RSI > 25–30, MFI > 20, hist. MACD↑, CMF → 0.
• Targets: 4025 → 4126/4131 → 4232 on impulse.
• Invalidator: return < 3977 after recap, especially if OI ROC+ is on a red candle and OBV z50 ≤ −2.0.
B) Continuation of the downward trend
• Trigger: 4h-close < 3821 (Donch-Low), ADX ≥ 40, OBV z50 ≤ −2.0, OI ROC+ on the fall.
• Targets: 3723 (LVN) → 3627 (VAL) → 3531/3459/3435 (LVN-pockets).
• Invalidator: fast return > 3977 and hold.
C) Short-squeeze (acceleration up)
• Trigger: impulse break and hold > 4232 (Donch-55 Mid) or > 4285/4291 (KC/BB-Upper) when OI decreases and OBV increases.
• Targets: HVN 4275–4420 → 4490 (POC) → 4643 (Donch-55 High) on development.
• Invalidator: fake breakout with return < 4130.
⸻
Tactics (example of logic)
• Impulse long (on the base): after closing > 4018. Partial fixation at 4025, main fixation at 4126/4131; then, trail to 4232. Stop under 3977 (or local minimum of the recap) with a buffer of 0.5×ATR (~41$).
• Reversal long (conservative): from KC-Lower/BB-Lower 3977/3960 only when demand reacts (RSI/MFI up, CMF→0/+, hist. MACD is shrinking). Targets 4025 → 4130.
• Contra-trend short: on rejection 4126/4131 → 4232 at RSI<50, hist. MACD↓, OI ROC+ — targets 4025 → 3977; stop — over 4235–4240.
⸻
Briefly: what to expect
The basic setup is a technical rotation up (to 4025 → 4130), but it will turn on only after a recap > 3977 / better > 4018.
• We will confirm the recap → a logical move to Mid-am (4126/4131), with strength to 4232.
• We will break through 3821 on a growing OI/weak OBV → continuation down to 3723 → 3627 → 3530+
ETH Short Update - First Target Hit, Next Targets on their WayETH has successfully dropped from our entry.
First target has been hit, short has fully began and we will see a very fast drop to lower targets.
Good luck and be safe out there.

Ethereum (ETH/USDT, 4H) – Bounce Setup After Textbook Drop In my previous analysis, I highlighted the $4,700–$4,800 zone as a critical resistance cluster. ETH was rejected exactly from $4,720 and dropped sharply to $3,850, just as projected. ✅
⸻
🔎 Current Outlook:
• ETH has now reached the lower boundary of its descending channel.
• Price is sitting right on the $3,850 support zone, where buyers are showing early signs of activity.
• Momentum indicators suggest that the downside pressure may be exhausting, increasing the probability of a relief rally.
⸻
📊 Scenarios:
🔸 Bullish Reversal (more likely):
If $3,850 holds, ETH could rebound toward:
• First target: $4,100–$4,200
• Extended target: $4,400
🔸 Bearish Case (alternative):
A clean breakdown below $3,850 would expose the next demand zone at $3,600–$3,700.
⸻
📌 Conclusion:
After a sharp and accurate rejection from $4,720, Ethereum is now testing strong support at $3,850. Given the confluence of channel support and demand, the odds favor a bounce scenario over continued downside.