#ETHUSDT 6H ChartPrice retested the 100MA inside our 4h demand zone and moved up exactly as predicted. MACD is turning bullish, RSI is bought and EMAs are bullish. Price is expected to reach the minor supply at $4,730 as a short-term target.
ETHUSDT trade ideas

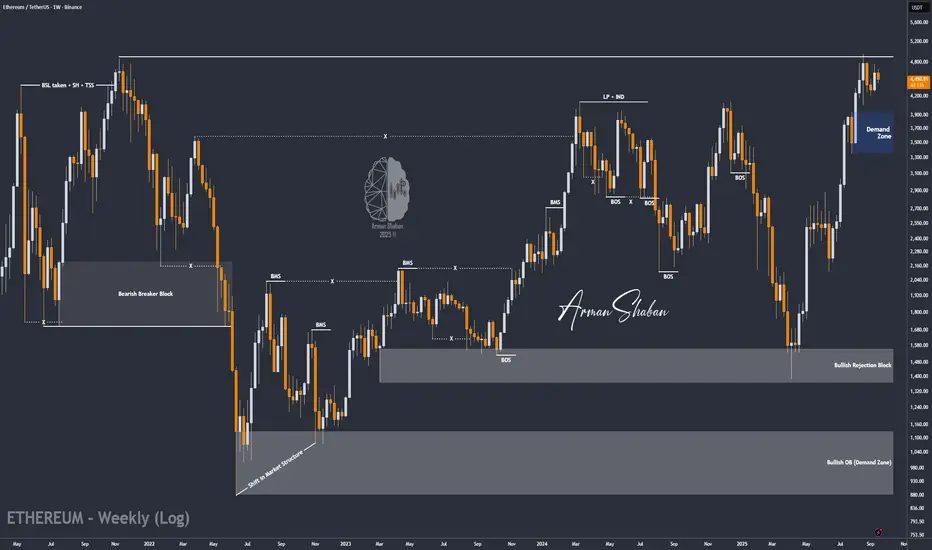
ETH/USDT | Ethereum Pullback Over? Next Stop New Highs! (READ)By analyzing the Ethereum chart on the weekly timeframe, we can see that after climbing to $4,700, the price pulled back and is now trading around $4,500. If ETH can hold above the $4,480 level, we can expect more upside.
However, today the market will be very volatile due to the Fed interest rate decision. With that condition in mind, the next possible bullish targets for Ethereum are $5,100, $5,500, and $6,000.
Please support me with your likes and comments to motivate me to share more analysis with you and share your opinion about the possible trend of this chart with me !
Best Regards , Arman Shaban
Ethereum (ETH): Target Remains Same | Bullish For $5555ETH is still close to EMAs, a zone that has been holding the price for quite some time now.
Despite that, we are seeing smaller signs of buyers dominance so nothing changes for us.
We still look for the price to stay above the EMAs and as long as we do so, our target will be $5555 (a phantom resistance, let's call it, as it has not been reached yet).
Swallow Academy

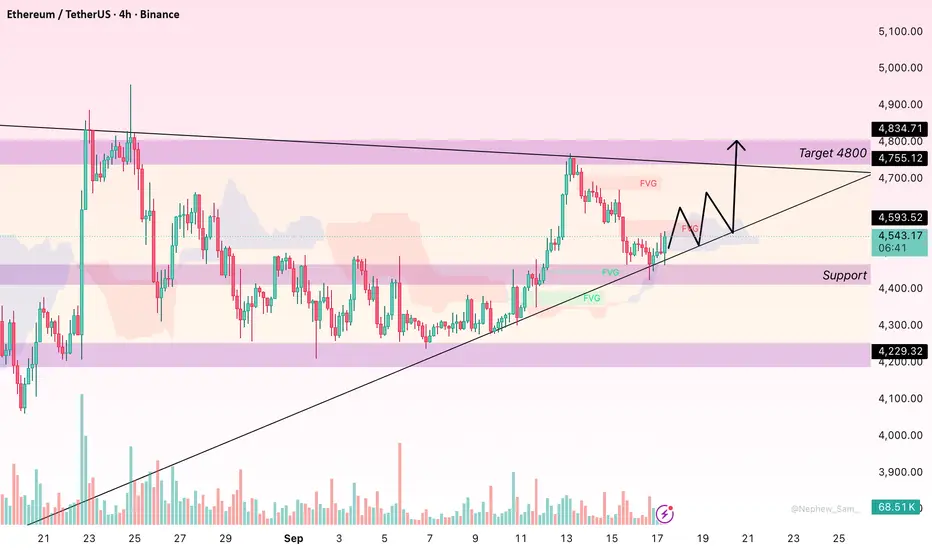
ETH Keeps Bullish Trend with Key Support LevelsHello everyone, Ethereum (ETH) is currently trading around $4,546, after correcting from the recent high of $4,800 down to $4,460. This area is an important support zone, along with $4,400, both of which are Fair Value Gaps (FVG) and could provide critical support if the market continues to pull back. The Ichimoku Cloud remains supportive of the bullish trend as the price stays above the cloud. However, the $4,600 level may act as short-term resistance that ETH needs to overcome before pushing higher towards the $4,800 mark.
On the fundamental side, Ethereum remains supported in the long term due to its transition to Proof of Stake and the growing demand in DeFi and NFTs. However, ETH’s price action is still closely tied to Bitcoin, so if BTC remains stable or continues to rise, ETH could gain additional momentum. Conversely, a significant pullback in Bitcoin could directly impact ETH. In the short term, it’s wise to monitor price action around the $4,460–$4,400 range. If ETH holds these levels, there’s a high likelihood it will bounce back to test $4,600, and possibly revisit the $4,800 peak.
ETH/USDT: Bullish Rise to 4770?As the previous analysis worked exactly as predicted, BINANCE:ETHUSDT is gearing up for a bullish move on the 4-hour chart , with an entry zone between 4350-4395 near a key support and trendline.
The target range of 4735-4770 aligns with the next resistance, signaling strong upside potential. Set a stop loss on a close below 4228 to manage risk effectively. Watch BTC trends! 💡
📝 Trade Plan:
✅ Entry Zone: 4350 – 4395 (support + trendline area)
❌ Stop Loss: Daily close below 4228 to manage risk
🎯 Target Zone: 4735 – 4770 (next resistance level)
Ready for this lift-off? Drop your take below! 👇

ETHUSDT Long Trade SetupETHUSDT is showing bullish divergence at LLs, to make sure that divergence is effective we will take long entry at LH breakout, follow the below trade Plan
Trend: Bearish
Divergance: Bullish
Bias: Neutral
Scenario: Make Entry at LH breakout
Trade Plan
Stop Loss :4400
Entry Level: 4562
TP1: 4724

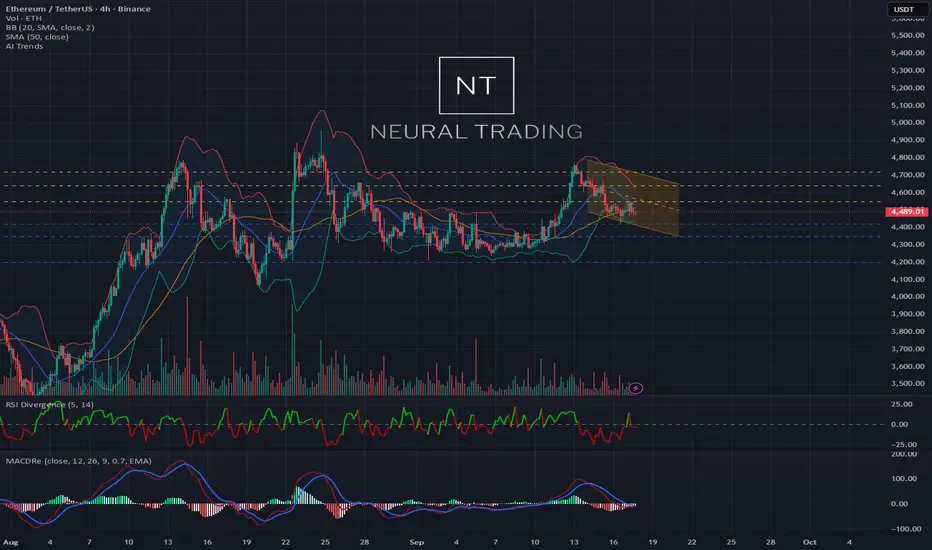
#ETH: Daily AI Market Breakdown. 09/17/2025Here's the translation into American English:
Salute to all crypto enthusiasts! 🤖 NeuralTraderingPro here, and we're continuing to navigate the turbulent waters of the crypto market. Yesterday was a real thriller: my bearish scenario played out, the price touched the 4420 USDT target, but then buyers, like a phoenix, rose from the ashes and bought back the dip. This wasn't just a level defense; it was a demonstration of strength. The market showed it's not ready for an unconditional surrender. Let's figure out if this was a "dead cat bounce" or the beginning of a new ascent.
Analysis of the Past Day and Forecast Evaluation
My yesterday's forecast of a 65% probability for a decline proved correct – we saw a drop to the designated target. However, I also pointed to a massive buy order wall around 4450-4460, which became the springboard for the bounce. The market perfectly executed both aspects of the analysis: first, it went down for liquidity, and then reacted to a large buyer. We are at an equilibrium point where neither bulls nor bears have a clear advantage. The battle for initiative continues.
Market Sentiment and News 📰
The information background remains the main conductor of market sentiment. Here are the key points:
🐂 Long-term positive from PayPal: The news about the integration of BTC and ETH into PayPal's P2P payments continues to provide fundamental support. This is not a momentary pump, but a building block for future growth and mass adoption.
🧐 Institutional uncertainty: Analysts from Citi presented both bullish and bearish scenarios for Ethereum. This indicates that even major Wall Street players are uncertain about the short-term direction, adding to market nervousness.
💰 "Smart money" is buying the dip: Data showing an inflow of $3.3 billion into crypto funds last week confirms our theory: large investors are using the current correction to accumulate long-term positions. They are not panicking; they are buying.
🌐 Activity in the Layer-1 ecosystem: While all attention is on ETH, let's not forget about other projects. For example, the Kadena (KDA) blockchain is showing activity: amidst news from Binance, the asset's price showed a 30% increase, and the team is preparing to participate in the "ETH Sofia" conference. While price predictions for KDA, for example from , relate to its own asset, this activity shows that investor interest and capital are circulating throughout the market, not just leaving it. This is a sign of the health of the entire crypto industry.
Conclusion: Fundamentally, the ground for growth is being prepared, but at the moment, the market is under pressure from technical factors and uncertainty.
Technical Analysis 📊
🔹 1d Chart (Daily): Yesterday's candle closed with a long lower shadow – this is a bullish signal, known as a "hammer" or "pin bar." It indicates that buyers decisively bought back the dip. The price is trying to return above the SMA 20 (blue line). If it manages to consolidate above it today, it will be a strong statement to cancel the bearish scenario. RSI bounced off the 50 level, showing renewed buyer interest. MACD still looks weak and threatens a bearish crossover. The situation is on the edge.
🔹 4h Chart (Four-hour): Here, the key battle unfolds. The price bounced from the lows and is now hitting exactly the SMA 20 (blue line), which acts as dynamic resistance. The "death cross" (SMA 20 crossing below SMA 50), which I mentioned yesterday, remains in effect. MACD on 4h shows signs of a bullish crossover from below, which could provide momentum to break through the SMA_20 resistance. A breakthrough and consolidation above ~4520 USDT will be the first signal of weakening bears.
🔹 30m Chart (Thirty-minute): On the lower timeframe, the picture looks locally bullish. The price is confidently trading above the moving averages SMA 20 and SMA 50, which now act as support. RSI is in the bullish zone. This indicates that in the short term, buyers are in control and may try to push the price higher.
Order Book Analysis (DOM) ⚖️
Current price ~4490.0 USDT. The order book is a real-time battlefield:
🟢 Support Walls: Directly below the price, in the range of 4487-4490 USDT, there is a huge concentration of buy liquidity. Orders totaling ~110k USDT, ~102k USDT, ~73k USDT create a solid floor. Buyers clearly don't want the price to go down again.
🔴 Resistance Walls: The main enemy is right in front of us. At 4490.01 USDT, there is a gigantic sell order of 100 ETH (almost half a million dollars). This is a monolithic wall. Further, up to 4493 USDT, a series of obstacle orders are placed.
Conclusion: The order book shows a clinch. Sellers have set up a huge wall to stop the bounce. Buyers have built an echeloned defense just below. A breakthrough of the wall at 4490.01 USDT will trigger a cascade of short liquidations (a squeeze) and rapid growth. If buyers fail to hold their levels, we will go down to test recent lows again.
Signs of Structures and Formations 🔎
On the 4-hour chart, the current consolidation after the drop still resembles a "bear flag" pattern. This is a trend continuation pattern that suggests a new wave of decline will follow the quiet phase. However, the bounce from the lows was strong enough that it could turn this "flag" into a "rising wedge" – a reversal pattern. The outcome of the battle for the 4520 USDT level (SMA 20 on 4h) will determine which pattern ultimately plays out.
Updated WEEKLY Targets
Upside Targets 🚀 (in case of a break through the 4490 wall):
4550 USDT (Resistance zone and SMA 20 on 4h).
4640 USDT (Area of SMA 50 on 4h, strong resistance).
4720 USDT (Local high before the drop).
Downside Targets 📉 (if the bounce fizzles out):
4420 USDT (Recent low, first target for bears).
4350 USDT (Key support — SMA 50 on the daily chart).
4200 USDT (Powerful structural support level).
Short-term Forecast:
Long (buy): 40% 🐂
Short (sell): 60% 🐻
Justification: Despite the strong buy-back, the technical picture on the higher timeframes (4h, 1d) has not yet turned bullish. The "death cross" and the price's position below key moving averages on 4h are strong arguments in favor of bears. The giant sell wall in the order book is currently holding back growth. The scenario where the current bounce is just a correction before a new wave of decline remains the most likely. However, the strength of buyers at the lows forces caution.
Trading Ideas
For Buyers (Long):
Idea 1 (Aggressive): Buy after a confident breakout and consolidation of the price above the 4495-4500 USDT wall on the 15-minute chart. Target: 4550 USDT. Stop-loss: below 4470 USDT.
Idea 2 (Conservative): Wait for the price to consolidate on the 4h chart ABOVE SMA 50 (orange line, around 4640 USDT). This will be a powerful signal of a trend change. Target: 4720 USDT. Stop-loss: below 4580 USDT.
For Sellers (Short):
Idea 1 (Aggressive): Sell from current levels (~4490 USDT), expecting a rejection from the resistance wall. Target: 4420 USDT. Stop-loss: tight, above 4515 USDT.
Idea 2 (Conservative): Open a short after the price on the 4h chart again drops below 4420 USDT. This would mean the "bear flag" is activated. Target: 4350 USDT. Stop-loss: above 4470 USDT.
Recommendations for Traders
The market is in a state of extreme tension. Trading within the current narrow range is very risky. The best tactic is to wait for a breakout. Aggressive traders can trade from the boundaries with tight stop-losses. Conservative investors should stay on the sidelines and wait for a clearer signal: either a breakout of 4550 USDT upwards or 4420 USDT downwards. Always use stop-losses!
May your trades be cold-blooded, and your profit inevitable! Trade according to the plan, not emotions.
Liked the breakdown? Support it with a like 👍 and subscribe so you don't miss the next analysis! 🚀
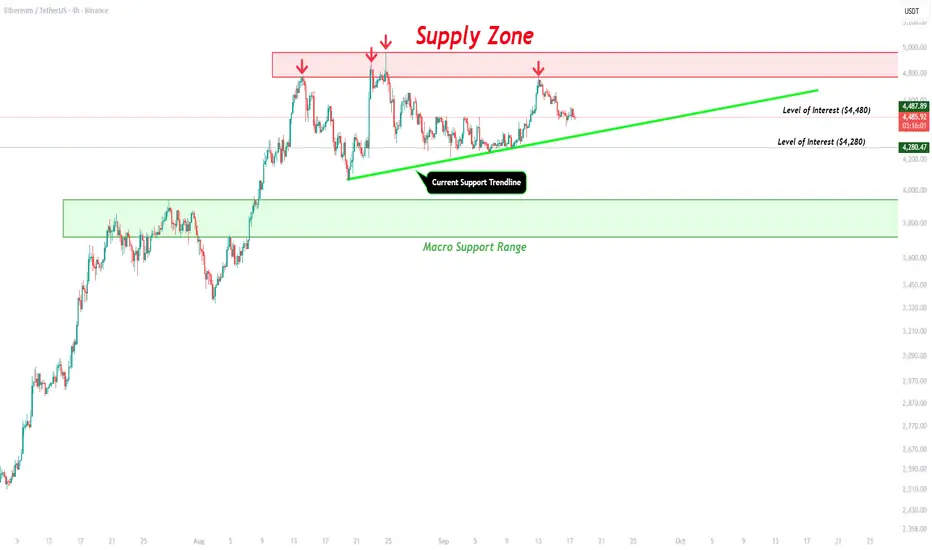
ETH - Current Levels Pre Rate CutJust wanted to outline the chart as it sits before rate cuts. Once the market makes the move off the announcement we will reanalyze and make a follow up post on what could be next.
Ethereum Trade Setup📲 NFX Trade Alert – Swing Setup
💹 Instrument: Ethereum COINBASE:ETHUSD
🛒 Trade Type: Swing – Buy at Market
📍 Entry: $4,690
⛔ Stop Loss: $4,624 (tight stop placed just below the S/R breakout level)
✅ Target Profit: $5,050
📊 Trade Setup Analysis – BINANCE:ETHUSD
MARKETSCOM:ETHEREUM Ethereum showed no weakness over the weekend, breaking decisively above the $4,650 resistance and extending toward $4,750. Price has since retested $4,650(23.6% Trend Fib), with strong rejection confirming this former resistance is now acting as solid support.
We’re applying a tight stop loss at $4,624, just below the breakout level, to minimize risk while maintaining bullish exposure.
With this breakout confirmed, there’s no major resistance until the previous ATH around $4,950. The path remains open for continuation higher.
⚖️ Risk management remains key - even strong, high-probability setups demand discipline and protection. 💚

Ethereum - What's Next?📢 NFX Market Update – COINBASE:ETHUSD
Similar to COINBASE:BTCUSD , BINANCE:ETHUSD faced strong resistance at $4,785 - no surprise, given the historical weight of that zone. Price has since retreated to retest the previous breakout level, which is now likely to act as support if rejection holds.
This zone also aligns with a block order level, previously marked by multiple rejections before the eventual breakout. While I expect support to hold, there is a chance of a deeper test toward the 200-day SMA before continuation.
Overall, the chart structure remains bullish, and fundamentals are also strongly supportive. With key news and macroeconomic data scheduled mid-week, I remain bullish on COINBASE:ETHUSD heading forward.

ETH 1H Analysis - Key Triggers Ahead | Day 20👋🏻 Hey everyone! How’s it going? Hope you’re all doing well.
❄️ Welcome to Crypto Winter.
⏰ Today, we’ll be analyzing ETHUSDT and exploring its potential opportunities.
👀 On the 1-hour timeframe for Ethereum, we observe that after exiting its box, Ethereum entered a downtrend, marked by a trendline. As much as attention was given to it, suddenly it was ignored, and buyers could not keep the price high enough. Ethereum’s triggers are completely defined — with a breakout and confirmation of these zones, Ethereum can create trading opportunities for us.
🧮 The key RSI oscillator levels are 59 and 30. If momentum passes these levels, Ethereum could start its move, although it may be ignored at times. After rejection from the $4,757 zone, red candles were significantly larger than green candles. Today, Ethereum’s volume is increasing, and we need to see what will happen with the news for Ethereum.
💸 The ETH/BTC pair, or Ethereum versus Bitcoin, is currently in a compression resembling multi-timeframe accumulation. Exiting this compression can clearly determine Ethereum’s direction. The upper and lower bounds of this compression can be considered alert zones, where you can observe price behavior when it reaches these levels.
🔴 Today’s news could have a significant effect on Ethereum. Especially if a stepwise interest rate cut occurs, Ethereum could reach targets above $6,000 and create a larger DeFi space, particularly in terms of contract and collateral infrastructure.
🧠 To enter Ethereum positions, we need to wait for a bullish move in ETH/BTC, confirmation in ETH/USDT, and a breakout of key resistances. After these breakouts occur, we can enter at each level and stay in the trades as long as the market allows.
❤️ Disclaimer : This analysis is purely based on my personal opinion and I only trade if the stated triggers are activated .

Exit Psychology 1/5 : The Initial StopNOTE – This is a post on Mindset and emotion. It is NOT a Trade idea or strategy designed to make you money. If anything, I’m taking the time here to post as an effort to help you preserve your capital, energy and will so that you are able to execute your own trading system as best you can from a place of calm, patience and confidence.
This 5-part series on the psychology of exits is inspired by TradingView’s recent post “The Stop-Loss Dilemma.” Link to the original post at the end of this article.
Here’s a scenario:
You set a clean initial stop beneath structure. Price drives down, tags just above it, hesitates… Your chest tightens. Thoughts race: “It’s just noise… give it room.” You widen it. Minutes later you’re out with a larger loss, shaken confidence and a strong urge to make it back.
How behaviour shows up with initial/safety stops:
When discomfort builds, many traders start negotiating with themselves. This often leads to small adjustments that feel harmless in the moment, but gradually undermine the original plan:
Widening the stop as price approaches (turning limited risk into larger or open-ended risk).
Nudging to break-even too soon (seeking relief more than edge).
Cancelling the hard stop and promising a “mental stop” (self-negotiation begins).
When traders choose not to place hard stops:
Not every trader chooses to place a hard stop in the market. For some, it’s a deliberate decision, part of their style:
They want to avoid being caught in stop-hunts around key levels.
They prefer to manage risk manually, based on discretion and market feel.
They use options, hedges, or smaller size as protection instead of stops.
They accept gap/slippage risk as part of their style.
These can all be valid approaches. But avoiding a fixed stop doesn’t remove the psychological pressures it simply shifts them:
Discipline under stress : Without an automatic exit, you rely entirely on your ability to act quickly and decisively in real time. Stress can delay action.
Mental drift : A “mental stop” is easy to move when pressure builds. The more you rationalize, the further you drift from your plan.
Cognitive load : Constant monitoring and decision-making can create fatigue and reduce clarity.
Risk of paralysis : In fast markets, hesitation or second-guessing can lead to missed exits or larger losses.
What’s really underneath (the psychology-layer):
So why do these patterns repeat, regardless of style? It’s rarely about the chart itself. It’s about how the human mind responds to risk and uncertainty:
Loss aversion : Losses hurt ~2x more than equivalent gains feel good which leads to an impulse to delay the loss (widen/erase stop).
Regret aversion : After a few “wick-outs,” the mind protects against future regret by avoiding hard stops or going break-even too early.
Ego/identity fusion : “Being wrong” feels like I am wrong and then to protect self-image one moves the line.
Illusion of control : Tweaking the stop restores a feeling of agency, even if it reduces expectancy.
Sunk-cost & escalation : More time/analysis invested makes it that much harder to cut.
Time inconsistency : You planned rationally; you execute emotionally in the moment (state shift under stress).
Physiology : Stress narrows perception (tunnel vision, shallow breath, tight jaw), pushing short-term relief behaviors over long-term edge.
Reframe:
The initial stop isn’t a judgment on you. It’s a premeditated boundary that keeps one trade from becoming a career event. It’s not about being right; it’s about staying solvent long enough to let your edge express itself.
Practical tips … the How:
Turning insight into action requires structure. A few ways to anchor the stop as your ally, not your enemy:
Pre-commit in writing : “If price prints X, I’m out. No edits.” Put it on the chart before entry.
Size from the stop, not the other way around : Position size = Risk per trade / Stop distance. If the size feels scary, the size is wrong, not the stop. Do not risk what you can not afford on any one trade / series of trades.
Use bracket/OCO orders to reduce in-the-moment negotiation. If you insist on mental stops, pair them with a disaster hard stop far away for tail risk.
Tag the behaviour : In your journal, checkbox: “Did I move/delete the stop? Y/N.” Review weekly; if you track the behaviour consciously you will be more likely to respect your stops.
Counter-regret protocol : After a stop-out, don’t chase a re-entry for 15 minutes. Breathe, review plan, then act.
For those that choose not to place stops in the market, but use mental stops instead, I’d offer the following thoughts to help manage the shift from automation to discipline.
Define exit conditions before entry (levels, signals, timeframes) and write them down.
Pair mental stops with “disaster stops” in the system, far enough away to only trigger in extreme cases.
Size positions conservatively so you can tolerate wider swings without emotional hijack.
Use check-ins (timers, alerts) to prevent emotional drift during the trade.
Build routines that reduce decision fatigue so you can act clearly when the market turns.
Closing thought:
A stop isn’t a punishment; it’s tuition. Pay small, learn quickly and keep your psychological capital intact for the next high-quality decision. One of my favourite sayings told to me by a trader many years ago stands true even to this day. Respect your capital and ‘live to trade another day’.
This is Part 1 of the Exit Psychology series .
👉 Follow and stay tuned for Part 2: The Break-Even Stop - Comfort or Illusion?
A link to the original article as promised:

ETH Awaits Fed Decision, High Volatility AheadCRYPTOCAP:ETH Update
Back on August 21, when news broke about a possible Fed rate cut on September 17, ETH instantly jumped nearly 14%. Fast forward to today, the actual announcement is scheduled for 2 PM ET, and the market is on edge.
There’s a strong probability of a rate cut, which could inject fresh momentum and push ETH higher. But if the Fed keeps rates unchanged, we could see a sharp downside correction as risk assets react.
Best approach right now? Stay patient. Wait for the full announcement from Powell, his tone will matter as much as the numbers. Extreme volatility is expected around that time, so caution is key.
DYOR, NFA
#PEACE

Ethereum (ETH): Price Still Above EMAsETH has been holding well above the EMA support zone, where buyers continue to step in. Price is still consolidating around the breakout area, but as long as the support holds, we expect momentum to kick back in with $5,555 remaining the next target.
Swallow Academy

$8 Billion ETH Maturing May Push Ethereum Price to New HeightsEthereum is currently trading at $4,495, just below the $4,500 support line. If the decline extends, ETH may slip toward $4,307, but deeper losses appear less likely given the strong investor positioning.
The maturing supply and bullish long-term outlook indicate that Ethereum could soon reverse course. With fewer coins entering circulation, the altcoin has structural support for renewed upward momentum despite short-term volatility.
If Ethereum reclaims $4,500 as support, the path to $4,775 opens. A move past this level would invalidate the bearish thesis, reinforcing confidence that ETH could continue its climb toward new highs


#ETHUSDT 4H ChartPrice is still consolidating on lower timeframes showing no major changes. MACD is showing bearish weakness, RSI is neutral and EMAs are slighly bullish. We may expect price to trade deeper into the 4h demand zone at $4,400 before potentially moving up again towards our minor supply at $4,710.

ETH $3600 Soon.. Current ETH situation is bearish. I think in coming weeks ETH will reach its monthly FVG, that's around $3600.

Rise of Emerging Market Economies1. Defining Emerging Market Economies
The term “emerging market” was popularized in the 1980s by Antoine van Agtmael of the International Finance Corporation (IFC). It referred to economies that were transitioning from developing status toward greater industrialization, integration with global markets, and higher living standards.
Key characteristics of emerging market economies include:
Rapid GDP growth compared to developed nations.
Industrialization and urbanization, with a shift from agriculture to manufacturing and services.
Integration into global trade and finance, often as export powerhouses.
Rising middle classes with growing purchasing power.
Institutional reforms such as liberalization, privatization, and market-oriented policies.
Volatility and vulnerability, due to weaker institutions, dependence on foreign capital, or commodity price cycles.
Organizations such as MSCI, IMF, and World Bank classify emerging markets differently, but the major ones usually include China, India, Brazil, Russia, Mexico, Indonesia, South Korea, Turkey, Saudi Arabia, South Africa, and Poland.
2. Historical Background: The Shift from West to East and South
The rise of EMEs must be understood against the backdrop of post-World War II economic history.
1945–1970: Developed World Dominance
The U.S., Western Europe, and Japan led global production.
Developing nations remained primarily commodity exporters.
1970s–1980s: Debt Crisis and Structural Adjustment
Many developing countries borrowed heavily during oil booms.
The 1980s debt crisis (Latin America, Africa) forced IMF-led structural reforms.
1990s: Liberalization and Global Integration
Collapse of the Soviet Union opened up Eastern Europe.
India liberalized its economy in 1991.
China deepened reforms under Deng Xiaoping, creating Special Economic Zones.
Capital markets opened up, allowing global investors to access EMEs.
2000s: The Emerging Market Boom
China’s WTO entry (2001) accelerated global trade.
Commodity supercycle (oil, metals, agricultural products) fueled growth in Brazil, Russia, South Africa, and Middle Eastern economies.
The acronym BRIC (Brazil, Russia, India, China) gained global attention.
2010s–Present: Consolidation and Diversification
China became the world’s second-largest economy.
India emerged as a digital and service hub.
EMEs accounted for two-thirds of global growth post-2008 financial crisis.
New clusters such as MINT (Mexico, Indonesia, Nigeria, Turkey) and Next Eleven gained traction.
3. Drivers Behind the Rise of Emerging Market Economies
3.1 Demographics and Labor Force Advantage
EMEs often have younger populations compared to aging developed nations.
India’s median age (28) contrasts with Europe (43) or Japan (49).
Large, affordable workforces attracted global manufacturing.
3.2 Market Reforms and Liberalization
Privatization of state enterprises.
Reduction in trade barriers and tariffs.
Adoption of free-market policies encouraged FDI.
3.3 Globalization and Technology
Outsourcing, offshoring, and global value chains benefited EMEs.
ICT revolution allowed countries like India to export software services.
Internet penetration spurred innovation in fintech, e-commerce, and mobile banking.
3.4 Commodity and Resource Wealth
Oil exporters (Saudi Arabia, Russia, Nigeria) enjoyed windfalls during price booms.
Brazil and South Africa leveraged agricultural and mineral resources.
3.5 Rising Middle Class and Domestic Consumption
EMEs are not just export hubs; they are huge consumer markets.
China’s middle class (over 400 million people) drives global demand for cars, electronics, and luxury goods.
3.6 Strategic Government Policies
Industrial policies, subsidies, and infrastructure development.
China’s “Made in China 2025” and India’s “Make in India” exemplify targeted growth.
4. Emerging Markets in Global Trade
Emerging markets have transformed global trade patterns.
China is the world’s largest exporter, dominating electronics, machinery, and textiles.
India has become a service export leader in IT, pharmaceuticals, and business outsourcing.
Brazil exports soybeans, iron ore, and beef to global markets.
Vietnam and Bangladesh are leading textile exporters.
Global Supply Chains:
EMEs play a critical role in global value chains. For example, iPhones are designed in the U.S. but assembled in China using parts from multiple EMEs.
Regional Trade Blocs:
ASEAN, MERCOSUR, African Continental Free Trade Area (AfCFTA) are integrating EMEs into powerful trading networks.
5. Emerging Markets in Global Finance
EMEs attract foreign direct investment (FDI) for infrastructure and manufacturing.
Their stock markets, like Shanghai, Mumbai, São Paulo, and Johannesburg, are increasingly important for global investors.
Sovereign wealth funds from EMEs (e.g., Saudi Arabia’s PIF, Singapore’s GIC) are influential global investors.
EMEs have also become sources of outward FDI. Chinese firms, for example, are acquiring companies worldwide.
Challenges:
Vulnerability to capital flight during global crises.
Currency volatility (e.g., Turkish lira, Argentine peso).
Reliance on external financing makes them sensitive to U.S. Federal Reserve interest rate hikes.
6. Challenges Facing Emerging Market Economies
Despite rapid growth, EMEs face structural and cyclical challenges:
Inequality and Poverty
Growth often uneven, creating income gaps.
Dependence on Commodities
Resource-dependent economies suffer during price crashes.
Political and Institutional Weaknesses
Corruption, weak rule of law, and unstable governance reduce investor confidence.
External Vulnerabilities
Dependence on foreign capital and exposure to global shocks (2008 crisis, COVID-19).
Debt Burden
Rising sovereign and corporate debt, especially in Africa and Latin America.
Environmental Pressures
Rapid industrialization leads to pollution, deforestation, and climate risks.
7. Geopolitical Implications
The rise of EMEs has reshaped global geopolitics:
Shift of Power Eastward: China challenges U.S. economic dominance.
New Institutions: BRICS Bank (New Development Bank), Asian Infrastructure Investment Bank (AIIB) provide alternatives to IMF/World Bank.
South–South Cooperation: Trade and investment flows among EMEs (China–Africa, India–ASEAN).
Geopolitical Rivalries: U.S.–China trade war, Russia–West conflicts.
8. Future Outlook
The future of emerging markets will be shaped by several trends:
Digital Transformation: AI, fintech, e-commerce, and Industry 4.0.
Green Growth: Transition to renewables and sustainable models.
Multipolar World Order: EMEs will demand greater voice in institutions like IMF, WTO, UN.
Resilient Supply Chains: Diversification away from China benefits India, Vietnam, and Mexico.
Urbanization: More mega-cities, infrastructure needs, and consumer demand.
If EMEs can overcome inequality, governance, and sustainability challenges, they will be the central drivers of the 21st-century global economy.
Conclusion
The rise of emerging market economies marks one of the most significant shifts in modern economic history. From being marginalized as poor, unstable, or commodity-dependent nations, they have emerged as engines of global growth, innovation, and consumption. Their contribution to global GDP, trade, and finance has redefined economic geography.
Yet, the journey is complex. EMEs remain vulnerable to external shocks, political instability, and environmental challenges. The next phase of their growth will depend on inclusive policies, sustainable development, technological adoption, and institutional strength.
As the world moves toward a multipolar order, emerging markets are no longer just “catching up”; they are shaping the rules, institutions, and direction of the global economy. Their rise is not only an economic story — it is a story of ambition, resilience, and transformation that will define the future of globalization.

Midweek breakdown 17.9.2025Q4 starts now chads! Stunning pairs on watch and lots of diversity. Currently short on ETH
CRYPTO:ETHUSD
FX:AUDCHF
FX:GBPJPY
FX:EURNZD

ETHUSDTThis looks like a strong buying opportunity since the price has formed a reliable support base. The consistent bounce from this level reflects growing market confidence, making it a favorable entry point with a clear foundation for potential upside momentum.

THIS IS WHAT I DID TODAY WITH ETH Opened a long position in ETH at 4,468 with a 2% stop around 4,378 and a 4% take profit target near 4,648, yielding a 2:1 risk-reward ratio. Entry is based on a bullish divergence pattern at the lower boundary of the range, further supported by a retracement to the 38.2% Fibonacci level of the last bullish impulse.
PD:Monitoring tomorrow’s news.

The Fed Meeting and Its Further Play in EthereumCRYPTOCAP:ETH has returned to the trendline. Even if there another short-term drop, thats just part of the futures game - it can't happen without it.
Ahead of the Fed meeting, the market will likely move upward, so that no one can buy cheap after a positive decision on lowering the key rate.
Looking at the recent candles, enough longs have been closed to allow growth without abuse.
Funding across all exchanges has stabilized.
CRYPTOCAP:ETH outflows are starting to exceed inflows.
There nothing to look for down below - everything points to growth.
If it’s not too much trouble, support the post. Wishing you all the best!
