Ethereum fighting to make a comebackETH is the signal, the way forward, the only thing that could indicate a rotation of capital. The current data provided on the chart suggests that ETH is still fighting to reclaim previous price action. Cup and handle, bull flag, whatever the thesis, just be prepared.
Trade ideas
Eth long position After fall wich took place on 10 october eth close big high volume daily candle (12 october) wich engulf previus candle. İf eth will take fvg it would be great oppurtinity to take long position.

ETHUSDTDISTRIBUTION WAYCKOF TIME 30 MIN
The downward trend continues and this continues...
RAMTIYA SDIQI
ARAM PISHBIN

ETHEREUM
Ethereum price surged early October reaching over $4,500 driven by anticipation of the Fusaka upgrade, institutional adoption, and general market optimism.
Sell-offs following the rally have brought the price back to lower levels, typical of profit-taking amid volatile crypto markets.
key support level is the fib 0.618 level at 2810.29
key support 985$
key resistance around 8500$

Ethereum's Scenarios for the Week Ahead??The key points are indicated in the chart. And if the stop point is broken downwards, the next stop will be $3370 and there is a high probability of a deeper drop. However, if the price of Ethereum breaks above $4251, this scenario will be invalidated, which is unlikely but not impossible.

nearing top of bull market for ETHseems like we're nearing the top of the bull market for ETH, if you still feel like you wanna take the risk of entering the market with new positions, 3.5-4k seems like a risky buying range, and selling would be around 5.5-6.5k

The most hated rally on ETH incoming? Hello traders,
A really strong setup in the makes for ETH. Not financial advice :)
I woul love to take a loss on these structures.
Max pain is on the upside after the horror has been taken place.
Trade safe

ETH/USDT — Critical Retest at 3950–3520 Before Next Major Move?Ethereum has once again faced strong rejection from the key supply zone between 4,940–5,272 (Fib 0.5–0.618), signaling heavy selling pressure at this multi-year resistance area.
Price action now points toward a potential retracement into the major demand zone (yellow block) between 3,950–3,520, where the next directional move is likely to be decided.
---
📊 Key Technical Structure
Major Supply Zone: 4,940 – 5,272 (Fib 0.5–0.618)
Minor Support: 4,120
Primary Demand Zone (Yellow Block): 3,950 – 3,520
Next Supports (if broken): 3,210 → 2,132
Bullish Fibonacci Targets: 6,345 → 8,082 → 10,891
---
📈 Bullish Scenario — “Reclaim & Expansion”
ETH still maintains a macro structure of higher-highs and higher-lows on the weekly timeframe.
As long as the 3,520 support holds, the broader trend remains bullish.
A strong rebound from 3,950–3,520 followed by a weekly close above 5,272 would confirm bullish continuation and open up:
Target 1: 6,345 (Fib 1.0)
Target 2: 8,082 (Fib 1.618)
Target 3: 10,891 (Fib 2.618 — potential cycle top)**
The key confirmation for bulls is a weekly reclaim above 5,272 with volume.
---
📉 Bearish Scenario — “Breakdown & Deeper Retracement”
If the selling pressure continues and ETH closes below 3,520, the bullish structure will be invalidated.
Such a breakdown could trigger a deeper retracement toward:
3,210 (Fib 0.618 confluence)
2,132–1,955 (deeper structural retracement)
Failure to defend the yellow block would shift ETH into a lower-high / lower-low structure, signaling a medium-term trend reversal.
---
🔍 Market Context
ETH is currently retesting the same macro resistance zone that marked the all-time high area in 2021.
The rejection at 5K highlights that supply remains dominant in this region, while the 3,950–3,520 demand block now serves as the key battlefield for bulls and bears.
As long as the yellow block holds, this pullback can still be considered a healthy correction within a macro uptrend.
But if it breaks, the market may enter a prolonged consolidation phase before the next cycle begins.
---
📍 Summary
Ethereum stands at a major inflection point:
Bullish Case: Bounce from 3,950–3,520 and reclaim 5,272 → targets 6.3K – 8K – 10.8K
Bearish Case: Breakdown below 3,520 → deeper correction to 3.21K or even 2.13K
The 3,950–3,520 demand zone is the final defense for ETH’s mid-term bullish structure — hold it, and the trend continues; lose it, and momentum fades.
---
#Ethereum #ETHUSDT #Crypto #TechnicalAnalysis #Fibonacci #PriceAction #CryptoMarket #WeeklyChart #ETHAnalysis #MarketStructure

$ETH Channel Test – Bullish Bounce or Deeper Dip Ahead?BINANCE:ETHUSDT
ETHUSDT 1H: Channel Test – Bullish Bounce or Deeper Dip Ahead? 📊🚀
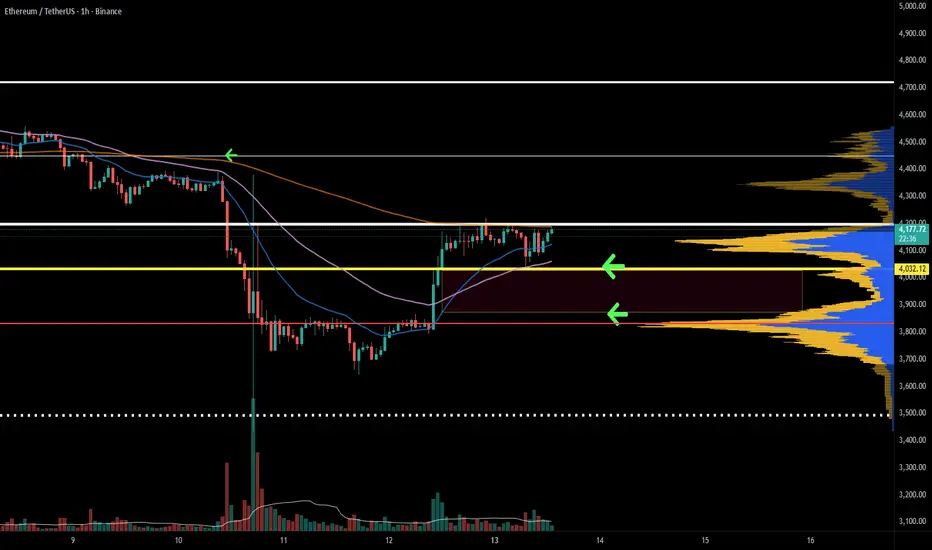
Hey traders! On this 1H ETHUSDT chart from Binance, we're seeing a classic descending channel squeeze with price hugging the lower support boundary around $4,040–$4,070 after a sharp V-shaped rebound from $3,500 lows. The orange trendline resistance at ~$4,150–$4,170 is capping upside for now, but higher lows signal accumulation and potential reversal vibes.
My take: Strong chance it holds the key support here – no major breakdown yet, fueled by that bullish momentum bounce. Breakout above $4,170 could ignite a quick rally, but watch for rejection risking a dip to $3,800 if volume fades. Overall bias? Mildly bullish if we close green above channel midline.
Target: Short-term upside to $4,500 on breakout; downside stop at $3,950.
Indicators I'm eyeing: RSI bouncing off 40 (not oversold), MACD histogram flipping positive, and rising volume on greens for confirmation. Stay nimble! 💥
#ETHUSDT #CryptoAnalysis #TradingView

ETHCRYPTOCAP:ETH is currently trading inside an ascending channel pattern. Once it breaks out, the measured move points toward a target around $8,100. Structure looks healthy and momentum continues to build.

ETHUSDTWeak sideways channel and a shade of downtrend with correction to face
the rejection from buyers proves the market will not stand below 3600 and now is upto its new move with 2 hurdles to face before a new high
1. Break Of Downtrend
2. Strong Resistance { purple horizontal line }
Thankyou

3 Altcoins That Could Hit All-Time Highs In The Second Week Of OEthereum is currently trading at $4,143, hovering just below the key $4,222 resistance level and awaiting a decisive breakout. The altcoin king rebounded strongly from $3,742, marking a 10% surge in the past 24 hours and signaling renewed investor confidence across the broader crypto market.
The Ichimoku Cloud indicator points to short-term bullish momentum for Ethereum. If ETH successfully flips $4,222 into support, the price could rally toward $4,500. Securing this level would further set the stage for Ethereum to test the next resistance at $4,956, reinforcing its upward trajectory.
However, if bullish conditions weaken or ETH fails to breach the $4,222 barrier, a reversal could occur. Ethereum might fall to $4,000 or even lower, erasing recent gains and invalidating the bullish outlook as selling pressure intensifies.

$ETH Update !!CRYPTOCAP:ETH Update
#Ethereum is facing significant resistance between $4,450 and $4,550. After rejecting the recent local highs, it’s currently holding the 55 EMA (green) as short-term support. However, it’s getting squeezed between the 21 EMA (yellow) above and a high-volume node on the Volume Profile, which acts as a heavy liquidity zone.
If ETH fails to reclaim the high-volume node and starts closing below the 55 EMA, we might see further downside towards the $4,200 support area.
ETH has already broken structure to the downside, showing weakness. If price closes below $4,397 (Value Area Low of the current range), we could see a continuation toward the $4,200 bullish FVG zone.
Key Levels to Watch:
Resistance: $4,450–$4,550
Support: $4,250
A break below $4,397 confirms more downside toward $4,200.
CRYPTOCAP:ETH BITSTAMP:ETHUSD BINANCE:ETHUSDT
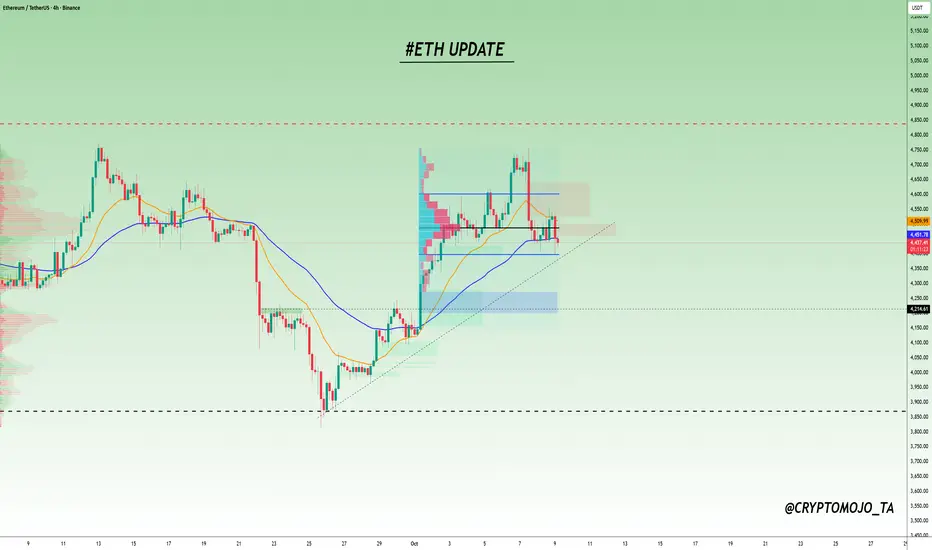
Ethereum Swing Trade Analysis - ETH LONGEthereum Swing Trade Analysis
Following a clear rejection at a supply zone after filling a daily imbalance (FVG), price action has shown notable structural changes. Specifically, we observed a break of structure on the 4-hour chart, which appears to be a direct reaction to the mitigation of this imbalance.
Additionally, a series of down-close candles on the H4 timeframe indicate potential bullish absorption, often suggestive of a reversal in momentum. This confluence, along with the recent fill of the daily fair value gap, suggests that price has likely found support at this key level.
Given these technical signals : rejection at resistance, structural break, and supportive price behavior around the filled FVG.
I am considering to enter a swing long position after filling M15 FVG imbalance.
The target for this trade is the equal highs on the buy-side liquidity around the $4,385 level.
Will be updating the course of this trade in the following days until it reaches final take profit target.
Talk to you soon !

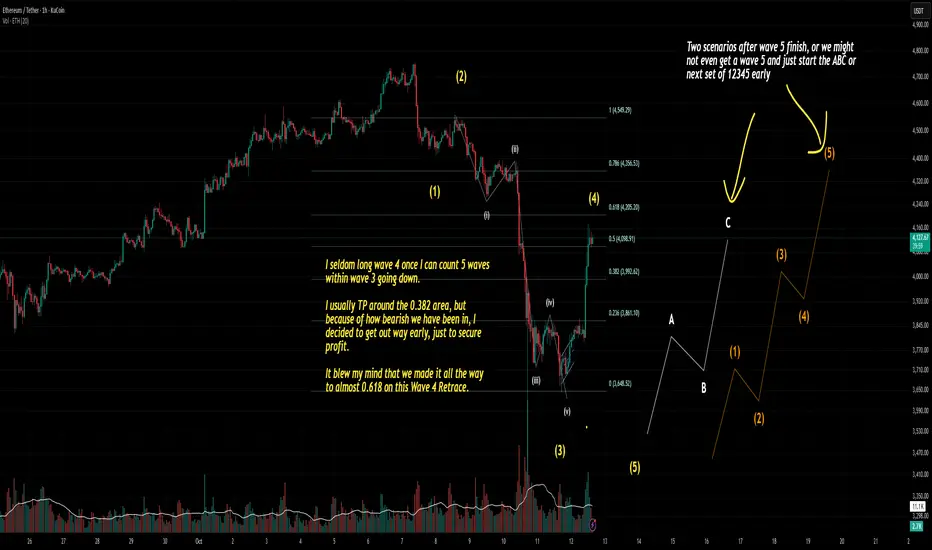
ETH (My thoughts after TP on my long position)I’m still an Elliott Wave noob, so the drawing on my chart is purely theoretical. It’s based on personal speculation — not financial advice.
Right now, I’m working under the assumption that we’re either in a corrective Wave A heading down, or in Wave 2 of a larger structure on a higher timeframe.
Last night, I counted five waves down within Wave 3 and started to notice signs of support. So instead of riding it out for a retrace back to the usual 0.382 Fib, I decided to long Wave 4 early and took profit once it hit an amount I was comfortable with.
Given how sharp the recent drop was, I was worried this might be one of those weak sub-Wave 4 retracements. I honestly doubted we’d even make it to 0.382, and even if we did, I expected it to take another 12–24 hours.
This morning, ETH shot up another $200 to $4000 right after I TP’d. I won’t lie — I definitely felt some ROMO (regret of missing out). An hour later, I checked again and saw it nearly tagged the 0.618 Fib. I was shocked at how fast it recovered.
But I reminded myself: don’t FOMO in and end up stuck in a long while Wave 5 is setting up to go down. I’ve learned that less profit is better than no profit. So I’m sticking to my plan and moving on.
My outlook from here:
I’m expecting Wave 5 to start between now and the London session open. Then, during the U.S. session, we might see another impulsive 1-2-3-4-5 leg up or begin corrective Wave B (if we really are in corrective Wave A down).
Good luck, everyone. Stay disciplined and trade your plan.
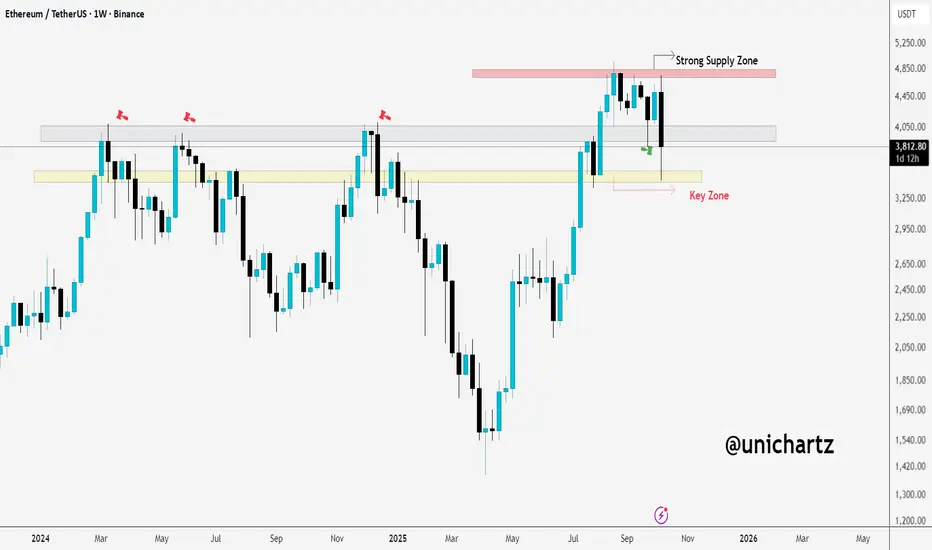
ETH in Danger: Breaking Below $3,200 Could Signal Bigger DropCRYPTOCAP:ETH is facing rejection from the strong supply zone around $4,800. The weekly candle failed to hold above that level and is now pulling back towards the key demand zone between $3,200–$3,300.
If the price fails to reclaim this support, we could see a more bearish scenario unfolding.
DYOR, NFA
Thanks for the reading
ETH/USD Bearish Retracement from Daily FVG Zonea bearish retracement setup on Ethereum (ETH/USDT) in the daily timeframe. After a strong bearish impulse, the price entered a highlighted Daily Fair Value Gap (FVG) zone — a potential area of supply where sellers may regain control. The projection indicates a likely short-term pullback into the FVG before continuing downward toward Target 1 (≈ $3,601) and Target 2 (≈ $3,399).

Possible bear-ish channel incoming.We should have some confirmation in our next candle to determine if we are entering another bear cycle. After multiple rejection on the 0.618 level, I had discovered a possible down trend channel that can take us down to the 39xx.
bear scenario
If the market remain bear in the next 2 weeks, the ultra bear target would be between the 3600-3700 range. (corrective wave 5 going down)
bull secnario
This bear wave going down maybe retest the 0.382 level on chart then go up and start a sub wave 3 going up, which turns my 12345 within Wave 5 on going down assumption into an ABCDE down wave that is part of the big wave 4 structure in the 4-hr time frame, which means we are in a sub structure of wave 5 in the 4HR+ time frame.

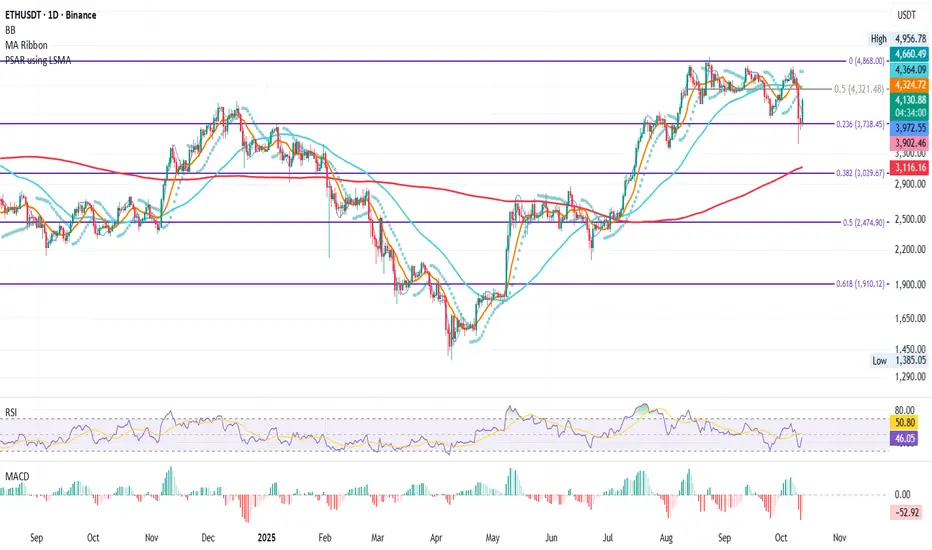
ETH Daily – High Volume, Rising OI, and a Fight for StructureETH Daily – Volume King Leading the Rebound
At this moment, ETH shows the highest trading volume across major assets.
After the sharp crash that dragged price down to 3435$, under the 0.236 Fib level, ETH found strong support near 3738$,the 0.236Fib level.
From that level, price has now reclaimed the 4000$ mark, a psychological and technical milestone.
If momentum continues, the next resistance sits at the 0.5 Fib level around 4321$.
From a system perspective, structure remains technically bearish for now:
SMA < MLR < Price < BB Center, with PSAR still bearish (above price).
To flip structure bullish, ETH would need a daily close above the BB Center with PSAR reversal confirmation.
OI Analysis:
ETH OI +7.70% growth confirms new leveraged exposure entering during this rebound: a positive sign showing traders are adding risk rather than de-risking.
This increase in OI, combined with strong spot volume (74.6B in 24h), suggests conviction behind the recovery rather than a mere short-covering bounce.
However, elevated OI also means volatility risk is rising: if ETH fails to close above 4000$ or BB Center, liquidations could amplify the next pullback.
Bias:
Cautiously bullish, short-term momentum improving, structure still lagging. Watching daily close above 4k today and BBcenter for future confirmation.
High volume and rising OI often mark the start of a structural shift, but confirmation always comes from the daily close.
In moments like this, patience is what separates the trader reacting to price from the one anticipating the next move.
Always take profits and manage risk.
Interaction is welcome.
ETH - MONTHLY DOJI - UPDATE:#ETH - price analysis: Tricky times Ahdea? 📊
Global Structure (Long-Term View):
🔸The chart remains bullish above the $ 3,180 level (monthly view). 📈
🔸That said, prices are stuck under a potential double-top ATH resistance at 4,800– 4,950. ⚠️
🔸Monthly High: $ 4,755
🔸Monthly Low: $ 3,435
🔸Current price is showing a Doji candle on both monthly and weekly charts, sitting exactly in the middle range from low to high. Neutral vibes for now! 🤔
Daily View:
Price is holding above the previous key resistance zone of 3,700 - 3,750.
Upper Key Resistances to Watch:
$ 4,300 - $ 4,540 - $ 4,75 - $ 4,950
What to Expect (Medium-Term Outlook):
We're in a sideways phase within the yellow zone: 4,250– 3,700, until a real breakout happens.
If bulls keep consolidating above $ 3,180, an upward move seems likely.
Tricky moment-there's literally no clear long-term or medium-term direction right now.
I've highlighted key levels and possible setups in my charts below. #DYOR
In case of a bad market event and bearish breakout, 2,850 and 2,500 could act as key bottoms.
My Take: This feels like a consolidation trap, bulls or bears, who's winning?
Share your thoughts below!
Bullish rebound or more downside? 👇
Key levels, yellow zone, and Doji highlights in my charts.

ETH/USDT Bearish Continuation from Supply Zonea bearish continuation setup on Ethereum (ETH/USDT) in the 4-hour timeframe. After a strong downward impulse, the price retraced into a highlighted supply zone, suggesting a potential rejection from this resistance area. The projection shows a likely continuation of the downtrend, targeting the 3,797.51 level, with a Stop Loss positioned above the recent swing high around 4,303.62.

ETH Forming a Bullish Reversal – Inverse Head & Shoulders on 1D!#Ethereum is showing a strong bullish setup on the daily time frame, forming a clean Inverse Head and Shoulders pattern — a classic sign of trend reversal.
Trade Plans:
1️⃣ Spot Trade:
Entry: Current Market Price (CMP) looks ideal for accumulation.
Stop Loss: Just below the “Head” of the pattern.
Target: Wait for the full pattern completion to reach the final TP zone.
2️⃣ Futures Trade:
Wait for a confirmed breakout above the neckline.
Enter a long position with proper risk management.
Aim for the final TP once the breakout is validated.
This setup is one of the most reliable bullish formations — if #ETH breaks the neckline with strong volume, it could trigger a powerful upside rally.
Let’s see if the bulls take control!
Drop your thoughts below
Do you think #ETH will break the neckline soon?
#ETH #Ethereum #Crypto #ETHUSD #ETHAnalysis #TradingView #TechnicalAnalysis #BullishSetup #CryptoTrading #PriceAction #InverseHeadAndShoulders

ETH | 6 Hrs | LongThis technical analysis is for informational and educational purposes only. It does not constitute financial advice. Remember to always research and consult with a professional before making investment decisions. Good luck! 📈💼🚀
