My November and December expectations.According to my possible wave counts the first week of November may be a sell-off, then the direction may be upwards, and declines may occur after the Christmas holiday.
* The purpose of my graphic drawings is purely educational.
* What i write here is not an investment advice. Please do your own research before investing in any asset.
* Never take my personal opinions as investment advice, you may lose your money.
Trade ideas

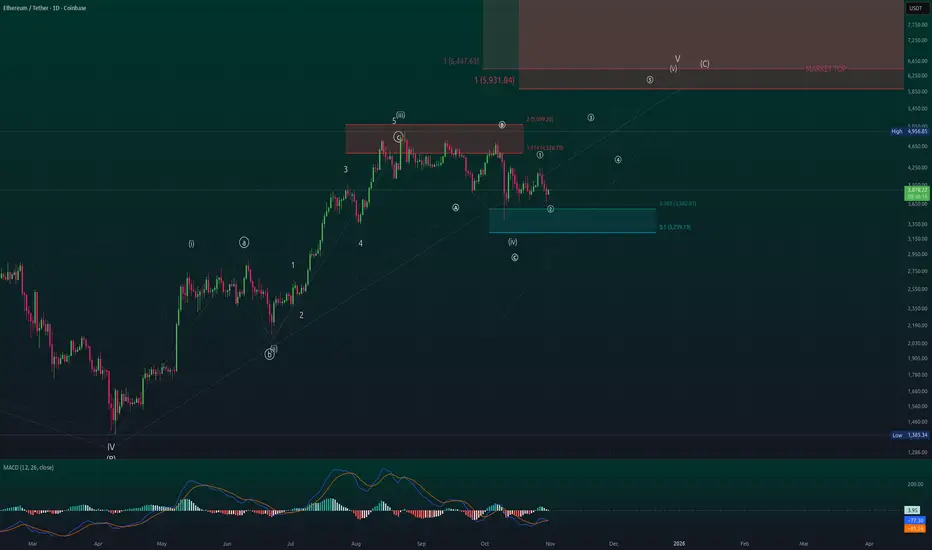
ETH/USDT — Comprehensive EW & Fib RoadmapETH/USDT — Comprehensive EW & Fib Roadmap
**Structure:** From the **Jun ’22 bear-market low → Mar ’24** forms **A/3**; **Apr ’25** prints **B/4**. Since April we’re advancing in **daily Wave C**, now focusing on **(iv)–(v)** completion toward terminal levels. This continues my earlier public idea/thread on ETH’s multi-degree terminal advance.
---
1) Multi-timeframe context
* **Primary count:** Weekly corrective **A–B–C** from ATH with the current leg = **Wave C**. Within it, daily is progressing to finish **Wave (v) of C** (terminal risk once complete). Core EW rules/guidelines (no W2 > 100% of W1; W3 not the shortest; W4 typically avoids W1 territory; alternation) frame the count and invalidations. ( )
* **Fibonacci basis:** Using standard retracement/extension clusters (0.382/0.5 retraces; 1.618/2.0 extensions) for targets and pullback zones.
---
2) 2025 zoom-in (from the Apr ’25 **B/4** low)
* We have a completed **(i)–(iii)** push into the **Aug ’25 high ≈ $4,956** (marked **Wave 3** on the chart).
* **Wave (iv)** most likely **bottomed 10 Oct ’25 ≈ $3,429**, landing in the blue retrace box (**0.382 ≈ $3,575**; **0.5 ≈ $3,233**).
* From that low, price carved a fresh **1–2** to the upside → launching pad for **③ of (v)** toward terminal targets (bearish reversal risk once (v) completes).
*(All levels and labels are taken from the provided chart screenshots.)*
---
3) Confluence zones & path to completion
* **Resistance pivots from prior swings:** **1.618 ≈ $4,528.7** then **2.0 ≈ $5,099**.
* **Terminal target cluster for (v) of C:**
* **$5,900** (first box edge),
* **$6,447** (upper confluence),
* **$8,731** (stretch/throw-over if momentum overshoots).
These align with typical EW/Fib projections for a terminal wave; diagonals often end with throw-overs and sharp reversals thereafter.
---
4) Risk management & invalidation
* **Structure invalidation of the immediate 1–2→3:** sustained break **below $3,200–$3,180** (beneath 0.5 box & October spike-low context) = defer (v) and expect a deeper/complex (iv).
* **Momentum tell:** A push into the $5.9k–$6.45k band with fading momentum/divergence would fit terminal behavior; diagonals frequently reverse hard after completion.
---
5) Alternate (lower-probability)
* If price closes **below $3,429** and holds, treat the current advance as incomplete corrective work; wait for a **new 1–2** before re-engaging on the long side. (Rule-based posture per EW hard rules/guidelines.)
---
## Trade Idea (non-advice; execution-ready)
**Bias:** Long the **1–2** base for a run into the terminal cluster, then de-risk into strength.
**Entry (Option A — pullback ladder):**
* **$3,575 → $3,233** (0.382–0.5 “blue box”). Scale in 3–4 tranches.
**Entry (Option B — confirmation add):**
* Add on decisive **daily close > $4,529** (1.618 pivot) targeting the $5.1k box next.
**Stop / Invalidation:**
* Hard stop **$3,180** (beneath the 0.5 box & Oct spike low). Re-assess if hit.
**Targets / Scale-out plan:**
* **T1:** **$5,100** (2.0 ext / prior resistance).
* **T2:** **$5,900** (terminal box edge).
* **T3:** **$6,447** (upper confluence).
* **Stretch:** **$8,731** only if momentum remains strong (take partials aggressively; diagonals can “throw-over” then snap back). ( )
**Position sizing & management:**
* Risk **≤1–2%** of equity per idea; trail under higher lows once price converts **$4,529** to support; aggressively reduce above **$5.9k** if momentum divergences appear. ( )
---
Reference / Continuation
This analysis continues my prior ETH terminal-advance roadmap on TradingView; review for the higher-timeframe diagonal context and publishing notes. ( )
---
Disclosure
Educational analysis only; **not financial advice**. Risk per trade **≤ 1–2%**.
4th time the charm ? After visiting the demand zone 4 times, ETH finally got some traction. I got in a long after the 4th time hitting the demand zone, now waiting for a break out confirmation to visit the next run up. Watch the 3 key levels in yellow for TP target / break out for continuations.
Happy Trading!
Don't over leverage and make sure you have stop loss to prevent down side risk from market spike.
Not financial advise, this is pure speculation.

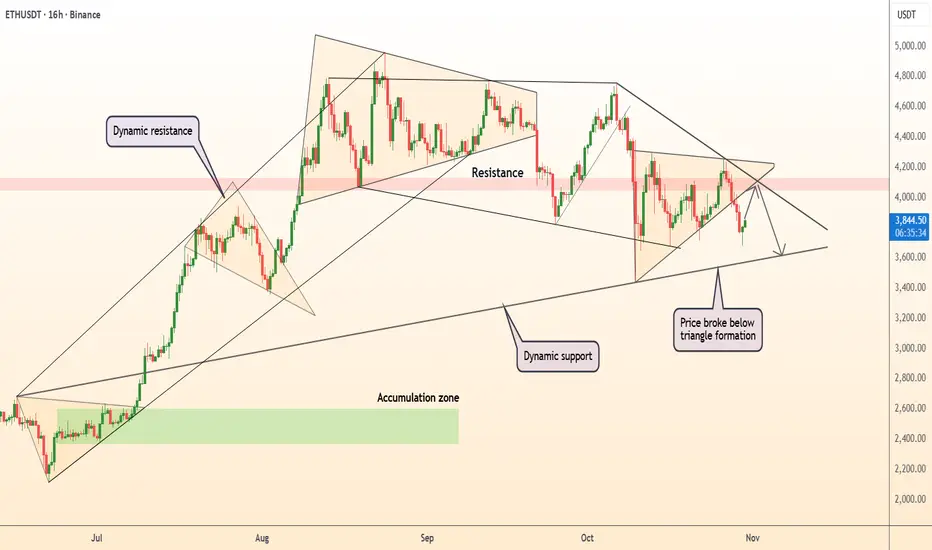
DeGRAM | ETHUSD formed a triangle📊 Technical Analysis
● ETH/USD broke below a triangle formation, confirming a bearish continuation from the dynamic resistance area near $4,200.
● Price action suggests a potential move toward the $3,600–$3,500 zone, aligning with the next dynamic support and continuation of the corrective structure from September highs.
💡 Fundamental Analysis
● Ethereum faces downside pressure as on-chain activity slows and ETF speculation cools amid risk-off sentiment in broader markets.
✨ Summary
● Short bias below $4,200; targets $3,600–$3,500. Breakout and weakening fundamentals support medium-term bearish momentum.
-------------------
Share your opinion in the comments and support the idea with a like. Thanks for your support!
ETHUSDT.P: 4H Chart BriefETHUSDT.P trading near 3,885 level. Monitoring for potential breakout or retracement on the 4H chart. Will respond to next move.
Disclaimer: Not financial advice.

ETH WEAKLY STRONGAs seen on the chart, there’s still nothing to worry about in the ETH/USDT pair on the weekly timeframe. The trend that started in 2022 continues to act like a magnet, keeping the price around it. I expect the support zone at 2990–2770 to hold strong. MACD is likely to break its downtrend resistance within this month, and RSI is slowly cooling off. Upcoming ETH staking news and other positive developments could trigger the next bullish trend.

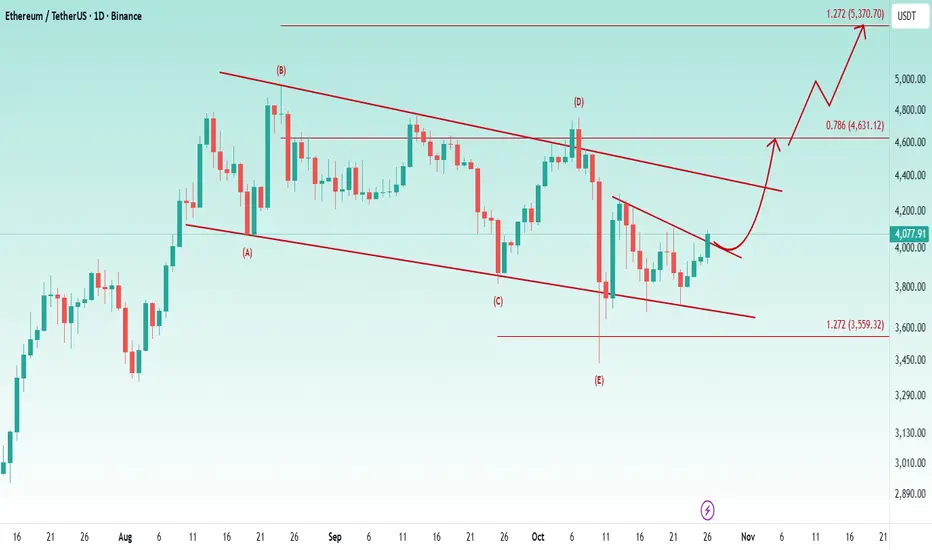
Ethereum is on its way to a new ATH🔘 There’s no change from my previous update
📥 price of Ethereum has tested the bottom of the bullish flag several times and has managed to hold its position well.
👉 Currently, in the lower timeframes, it is breaking the descending trendline.
📈 I expect a bullish move to start from this area toward 4600$, followed by a breakout of the bullish flag and a continuation of the move toward 5370$ as a new ATH.
🔰 Overall, the structure of Ethereum looks strongly bullish to me, and I anticipate a powerful upward trend in the near future.The price remains in a strong demand area and still looks attractive for buying
See if it finds support near 3321.30 and can rise
Hello, fellow traders!
Follow us for quick updates.
Have a great day.
-------------------------------------
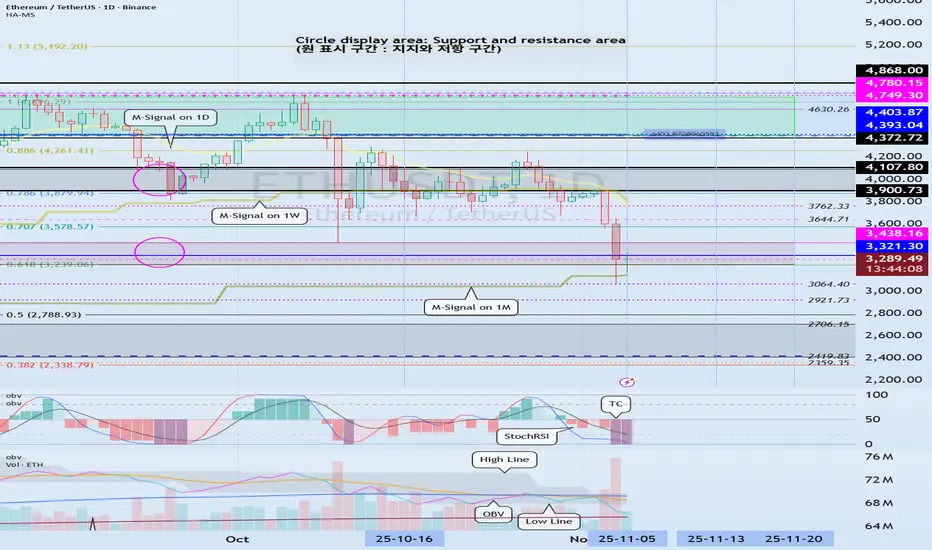
(ETHUSDT 1D chart)
There's no change from what I mentioned in my previous idea.
The M-Signal indicator on the 1M chart has been touched, so the trend will be re-determined.
At this point, it's crucial to check for support near the Fibonacci 0.618 (3239.06) - 3438.16 range.
If support fails and the price falls below the M-Signal indicator on the 1M chart, support should be checked around the 2419.83-2706.15 range.
-
Since the TC (Trend Check) indicator has touched its lowest point, a rebound is highly likely.
Therefore, determining support near the critical Fibonacci 0.618 (3239.06) - 3438.16 range is more important than ever.
Currently, ETH is in a period of volatility.
Therefore, we need to monitor the movement until November 6th.
The next period of volatility is around November 13th.
-
Thank you for reading.
We wish you successful trading.
--------------------------------------------------
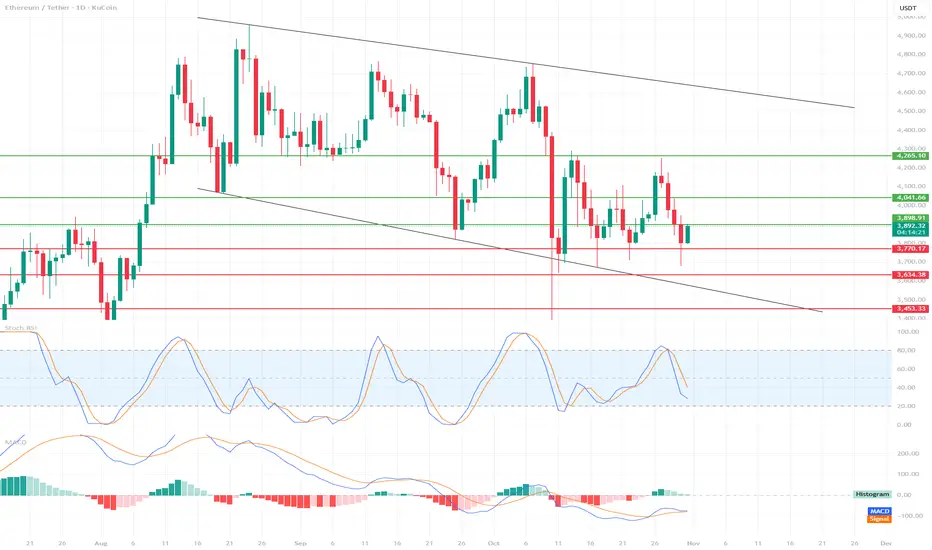
ETH Tests Support – Is This the Beginning of a Rebound?📉 Market Structure
We see a descending channel, bounded by two black trend lines.
Upper Boundary: ~$4,700
Lower Boundary: currently around $3,700, representing strong dynamic support.
The price is currently hovering slightly above the lower edge of the channel, suggesting a possible rebound, but the market remains in a medium-term downtrend.
🔍 Support and Resistance Levels
Support:
$3,770 → currently being tested, crucial in the short term.
$3,643 → next strong support from previous lows.
$3,453 → last line of defense against a steeper decline.
Resistance:
$3,889 → closest resistance, current local ceiling.
$4,041 → strong resistance resulting from prior consolidation.
USD 4.265 → a line that, if broken, could signal a change in the medium-term trend.
📊 Technical Indicators
Stochastic RSI
Located near the oversold zone (below 20), with a slight upward curve.
🔹 Signal: Potential upside move (bounce) in the short term if the %K and %D lines cross upward.
MACD
The MACD line is slightly below zero, but is starting to curve upward and may soon cross the signal line.
🔹 The histogram is starting to decline on the negative side – this is often an early bullish signal (possible change in momentum).
⚖️ Scenarios
🔹 Bullish
If ETH holds above USD 3,770 and the Stoch RSI confirms the rebound, a possible move towards:
3,889 → USD 4,041 → USD 4,265.
A break above USD 4,265 could open the way to USD 4,500+ (upper band of the channel).
🔻 Bearish
Loss of support at USD 3,770 → a signal of weakness.
Then the next downside targets:
USD 3,643, then USD 3,453.
If USD 3,453 breaks, possible tests of the lower band of the channel – even around USD 3,300.
🧭 Summary
Main trend: downward (descending channel).
Short-term bias: neutral-bullish (potential for a rebound from support).
Key level to watch: USD 3,770 – maintaining this level could trigger a rebound, loss = risk of a steeper decline.
Can Ethereum’s Capital Flow Blueprint Target 4600 Next?🎯 ETH/USD "The Liquidity Thief" Strategy 💰
Weighted MA Pullback + Manipulation Grab Blueprint
📊 TRADE SETUP OVERVIEW
Asset: ETH/USD (Ethereum vs USD) | Timeframe: Swing Trade
Market Structure: Bullish Confirmation with WMA Pullback Recovery
Strategy Type: Multi-Layer Accumulation (Thief-Style Entry Method)
🎪 THE GAMEPLAN
Bias: 🟢 BULLISH — Confirmed via:
Weighted Moving Average (WMA) acting as dynamic support
Liquidity pool identification on pullback zones
Institutional accumulation patterns detected
This setup thrives on pullback retracements where smart money accumulates before the next leg up. We're essentially "stealing" liquidity at discount prices during these inefficiency windows.
🚀 MULTI-LAYER ENTRY STRATEGY (The Thief Approach)
Instead of FOMO market orders, we deploy calculated limit order layers at strategic support zones:
Entry Levels (Layer-by-Layer Accumulation):
Layer 1: $3,700 USD
Layer 2: $3,800 USD
Layer 3: $3,900 USD
(Pro Tip: Scale these layers based on your risk tolerance and account size. Tighter layers = more fills; wider layers = better average price)
Position Building: Fill partial positions at each layer, building your total exposure gradually. This reduces average entry cost and maximizes probability of initial profit.
🛑 STOP LOSS (Risk Management)
Hard Stop: $3,500 USD
⚠️ Important Disclaimer: This is YOUR trading decision. No strategy guarantees profits. Position sizing and risk management are YOUR responsibility. Never risk capital you can't afford to lose.
🎯 TARGET & EXIT STRATEGY
Primary Target: $4,600 USD
Exit Rationale:
Strong resistance zone confluence
RSI/Stochastic overbought divergence
Liquidity trap zone (potential reversal catalyst)
💡 Golden Rule: Lock in profits at $4,600 or take partial profits at resistance. Never hold through key resistance on swing trades—greed kills thief traders.
⚠️ Disclosure: Risk management and profit targets are trader-dependent. Adjust based on your strategy framework, market conditions, and account allocation.
📈 CORRELATED PAIRS TO WATCH
Monitor these assets for confluence signals and capital flow indicators:
BITSTAMP:BTCUSD (✅ High Positive Correlation) — Bitcoin sets market sentiment; ETH typically follows in lockstep. When BTC rallies, altcoins like ETH amplify the move upward.
BINANCE:ETHBTC (⚖️ Relative Strength) — ETH strength against BTC equals altseason confirmation. Rising ETHBTC ratio means Ethereum is outperforming Bitcoin—bullish for our setup.
$SPY/ IG:NASDAQ (📊 Risk Appetite) — Traditional equity weakness creates crypto pullback risk. If stocks dump, crypto usually follows. Monitor US market opens for confirmation signals.
TVC:DXY (Dollar Index) (⚖️ Inverse Correlation) — Strong dollar = crypto headwind; weak dollar = tailwind for ETH. A declining DXY supports crypto rally scenarios.
COINBASE:USDTUSD (🔒 Stablecoin Flow) — USDT accumulation signals capital waiting for entry. Rising USDT on exchanges = dry powder ready to deploy into altcoins like ETH.
Capital Flow Blueprint: When BTC holds above support AND USDT shows inflow, altcoins like ETH enter "hunter mode."
🔑 KEY TRADING PRINCIPLES (Thief OG Edition)
✨ Patience — Wait for pullback confirmation before layering in
✨ Position Sizing — Risk only 1-2% per trade; 3% absolute maximum
✨ Confluence — Entry + Support + Volume + Correlation = Green Light
✨ Discipline — Exit at target or stop loss; no emotional HODL mode
✨ Adaptation — Markets evolve; update bias if structure breaks
If you find value in my analysis, a 👍 and 🚀 boost is much appreciated — it helps me share more setups with the community!
#ETH #ETHUSD #Ethereum #CryptoTrading #TechnicalAnalysis #SwingTrading #CryptoDCA #TradingStrategy #LayerEntry #LiquidityZones #AltSeason #CryptoAnalysis #TradeSetup #RiskManagement #Thief #CommunityDriven

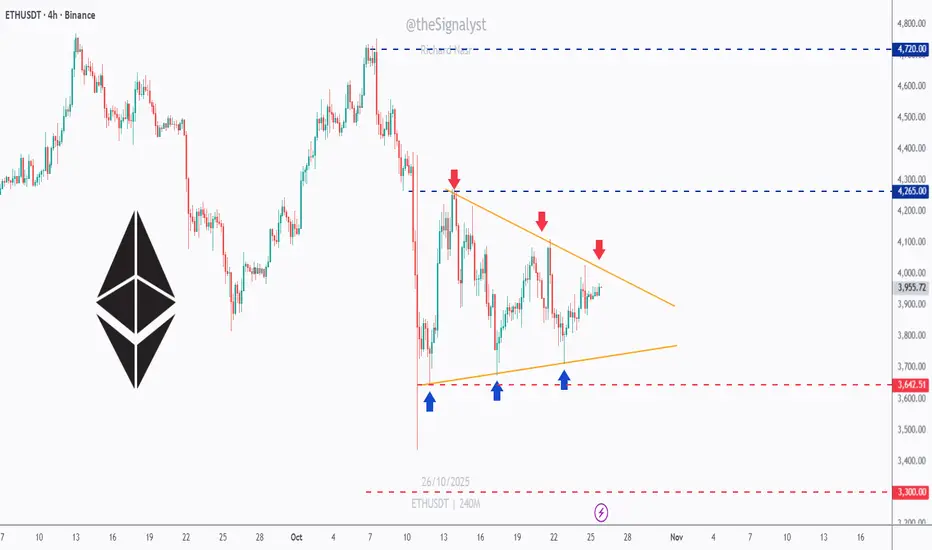
ETH - The Symmetrical Triangle of the Month!Ethereum has spent most of October coiling inside what can only be called the symmetrical triangle of the month => a textbook compression of volatility where both bulls and bears are building pressure for the next decisive move.
📦Price is trapped between the $4,265 resistance and $3,640 support, with multiple clear reactions from both boundaries. Each time ETH bounces off the lower orange trendline, buyers step in aggressively… but every push higher has been capped by lower highs, a perfect battle of strength versus patience.
The breakout from this formation will likely dictate ETH’s next major swing.
- A break above $4,265 could ignite a rally toward $4,720 and beyond.
- A break below $3,640, however, would expose $3,300, a strong historical demand zone.
⚔️ Until one side wins , it’s all about staying patient, waiting for confirmation, and letting the structure do the talking. The tighter this triangle gets — the bigger the breakout tends to be.
⚠️ Disclaimer: This is not financial advice. Always do your own research and manage risk properly.
📚All Strategies Are Good; If Managed Properly!
~Richard Nasr
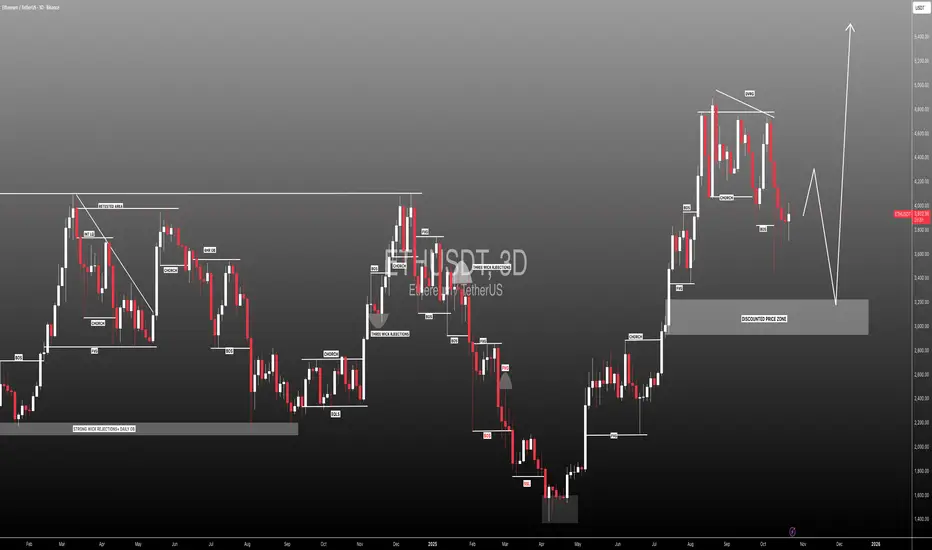
#ETHUSDT: First Drop And Then Launch To $5500! ETHUSDT we believe the price will initially decline before launching from the $3000 price region. This area appears more promising and could function as a discounted price zone. Three target levels are suggested below:
* **First target:** $4000. This area presents a minor resistance level, and closing 25% of positions is ideal.
* **Second target:** $4500. This is the second major resistance level, and closing another 25% of positions is recommended.
* **Final target:** $5500. This is our swing target. If the price reaches this level, it could be a suitable area to initiate a swing sell and the commencement of a major bearish move.
Please share your thoughts.
Team Setupsfx_
eTH-USDTIt has reached the support I mentioned again at $3700 📉📉
If this support holds, the price could return to the two targets I set for you
Keep an eye on it

EthusdBased on the formation of deceptive double-top patterns in an uptrend and the accumulation of liquidity above the static resistance line, I expect the market to drop to the previous low.

Eth Long Ok. So this might be one of the boldest trades one can take in such market conditions. Honestly, i panicked in sweat during this dip which usually means Fear in the market at its extreme.
Now imagine BTC ended oct in red, which usually means (based on history) that there is a 40% drop in BTC price incoming. This will usually nuke the crypto and altcoins matket. However, i came home and checked the monthly chart for ETH, which honsetly showing nothing but bullish vibes.
All analysis is based on the monthly timeframe (TF).
ETH shows a clear V-shape recovery (CSID structure) on the monthly chart.
Price currently sits around the 0.5 Fibonacci retracement level.
ETH is trading within a Monthly Fair Value Gap (FVG).
The structure is resting on a strong support zone (yellow box).
These combined elements indicate a bullish bias, not bearish.
From a liquidity perspective, the $4,500–$4,950 USDT zone forms a major liquidity pool likely to attract price.
On a higher zoom-out, price has already taken liquidity above the November 15 2021 high.
Therefore, from a liquidity-analysis standpoint, there remains potential for ETH to climb above $4,900 in the future.
i have set a one SL. Lets hope for the best in such market conditions.

ETHUSDT.P - November 1, 2025ETHUSDT.P is forming a corrective pullback within an intraday bullish structure, maintaining higher lows from the recent swing base. A buy limit order is positioned near $3,850, anticipating continuation toward the $3,891 resistance target. The stop-loss is set around $3,828 to manage downside risk. A rebound from the order zone would confirm bullish momentum resumption, while sustained price action below $3,828 would invalidate the setup.

ETH analysis
Ethereum has begun a new downtrend within a channel, targeting the $2,900 level, where a bullish reversal is expected.

$ETH at Crucial SupportThe market took a hit - total cap fell from $4.28T to $3.5T, and CRYPTOCAP:BTC is testing support near $103,800. We’ve seen this setup before: panic, whales moving coins, fear everywhere. Yet November often flips sentiment fast - historically, Bitcoin averages +40% this month.
Ethereum is under heavier pressure, possibly heading toward $2,700-2,500 zone. $3,300 remains the key level to watch staying above it keeps the momentum alive, but a break below could open the door to downside pressure.
But these shakeouts often reset the market before the next trend begins - and when liquidity returns, Ethereum usually leads the rebound.
The crypto market is bleeding, major assets like CRYPTOCAP:BTC , CRYPTOCAP:ETH and others have been slipping while liquidity pulls back and sentiment cools.
The total market cap has dipped; multiple large‑cap coins are down over the last 24 hours. We’re possibly entering a phase where panic gives way to opportunity, but timing and tone matter. What’s your move: sit tight, buy the dip, or wait for a clearer signal?

DRAGONFLY DOJI - ETHA Dragonfly Doji is a candlestick pattern that looks like a “T”.
It means the price dropped during the candle but then came back up to close near the opening price.
This shows that buyers pushed the price back up, and it can be a bullish reversal signal, especially after a downtrend like we saw right now on ETH.
Fingers crossed, bulls!

Ethereum Analysis – November 03, 2025Welcome to DIBA PRISM Daily Analysis 💫
Ethereum is currently in a bullish phase 📈 — compared to its previous market cycles and Bitcoin’s recent performance, ETH still shows room for further upside 🚀
Right now, Ethereum is in a corrective phase, and if it forms a higher low relative to the previous one, we can start looking for potential entry points 🎯
At the moment, price has reached a key zone, so it’s best to wait and observe Ethereum’s reaction before making any move 👀
Patience and timing will be the keys to catching the next big move ⚡
Disclaimer:
This content is for informational purposes only and does not constitute financial or investment advice. © DIBAPRISM
Larry D.Kohn

ETHUSDTHi friends.
in eth charts, we can see the price succesfully fixed upside of 3900. when you check entire candles, you will see the price is in good situation for a good long position.
i think nowadays this is very low risk that we enter a long position from here.
good luck

ETHUSDT SPOT BUY CYCLE ETHUSDT
Spot
Buy cycle midterm
TP 4654
% bubble ratio
Currently in a negative bubble with fair value at 4654
Spot trading plan:
Entry from (-30% bubble ratio level) and below…
Exit at TP 4654…

ETHUSDT-LONG IDEAETHUSDT is in the accumulation range. broken its trendline but again came back to test it support level well its my personal opinion this support should push price a little bit higher. if this accumulation range break we can expect the advancing phase for the longer run but right now this is the short term trade.
