EthLooks bullish in the next few weeks could see 6k or higher by November or December possible bullish flag what u think
ETHWAVAX_1ACF15.USD trade ideas


ETHUSDT watch well BINANCE:ETHUSD
watch breaking this resistance level, after that new era is starting for BINANCE:ETHUSD

Crypto Market Collapse Just The Beginning!The crypto market has collapsed — but this could just be the beginning.
In this video, I break down my ICT analysis on total market cap, Bitcoin (BTC), and Ethereum (ETH).
Here’s what I cover:
- Why this collapse isn’t a surprise
- The key levels I’m watching for BTC and ETH
- Scenarios for both a deeper move down and a possible bounce
- Why patience is critical until the weekly and monthly closures confirm direction
This is not about panic — it’s about understanding structure, liquidity, and how to wait for the market to give us clarity.
👉 Do you think this collapse is just starting, or will we bounce from here? Comment below and let’s discuss.
#Crypto #Bitcoin #Ethereum #CryptoCrash #ICTTrading #CryptoAnalysis

ETHUSD - Logarithmic Trend D1Hello, dear traders. An interesting trend has formed on Ethereum in the logarithmic chart. Earlier, we clearly identified a double bottom on the second cryptocurrency. Now we can see that the price is close to rebounding from the support level.
The main thing is to find an upward reversal pattern on H1 or H4. The targets are the 1.382 and 1.618 Fibonacci levels. That's $8,000 and $11,000.
What do you think? Will Ethereum hold the support levels and will there be an altseason for this asset?

ETH Daily chart Hello everyone
I am beginner trader. Please tell me, how is my technical analysis in this chart.
We see double top pattern in daily chart. It will go up or down?
What is your anticipates?

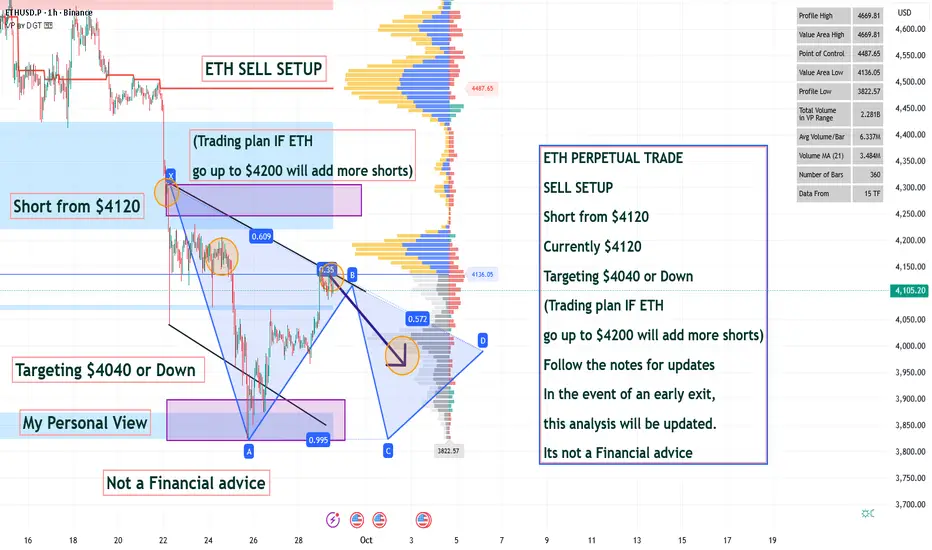
ETH PERPETUAL TRADE SELL SETUP Short from $4120ETH PERPETUAL TRADE
SELL SETUP
Short from $4120
Currently $4120
Targeting $4040 or Down
(Trading plan IF ETH
go up to $4200 will add more shorts)
Follow the notes for updates
In the event of an early exit,
this analysis will be updated.
Its not a Financial advice
Ethereum - The $15.000 price target!🚀Ethereum ( CRYPTO:ETHUSD ) will break out now:
🔎Analysis summary:
Looking at the higher timeframe, it is obvious that Ethereum has been consolidating for the past four years. But now, Ethereum is starting to break above the previous all time high. If Ethereum actually confirms the breakout, we are talking about an expected move of another decent +250%.
📝Levels to watch:
$15.000, $4.000
SwingTraderPhil
SwingTrading.Simplified. | Investing.Simplified. | #LONGTERMVISION

$ETH I'm LONGING $3997 due to its reliable SUPPORT zoneCRYPTOCAP:ETH long position
ENTRY: $3997
STOP LOSS: $3895
Details in my next posts, but the $4000 ETHEREUM support is one of the greatest support levels in the crypto game.

ETH going sub 4k? Ether ABC wave to $3913 or $3431 worst caseEther pushed into 5k and started pulling back.
Looks to be in an Elliott wave "ABC" correction.
Two different sub-4k targets are on the radar.
$4067.17 is the minimum expected retrace.
$3901-3931 is the most likely retest zone.
$3366-3435 is the strongest support nearby.
.
See "Recent Publications" for previous charts such a as this TOP CALL:
Hit BOOST and FOLLOW for more such PRECISE and TIMELY charts.
=========================================================
.


Ethereum (ETH/USDT) Weekly Chart UpdateEthereum (ETH/USDT) Weekly Chart Update
ETH is currently trading around $4026, down approximately 9.5% this week.
A long-term triangle breakout has occurred, and the price is now retesting this breakout zone.
Support levels: $3800 and $3500 (with the moving average).
Resistance levels: $ 4,500–$ 4,800 (short-term); if the momentum continues, the next major target would be $ 5,500–$ 6,000.
The overall trend remains bullish as long as ETH stays above $3500–$3600.
⚡ Summary:
ETH is currently experiencing a mid-term correction, but the long-term outlook remains bullish. Staying above support could pave the way for a move towards $5000+ in the coming months.
#crypto #ETH #BTC

ETHUSD bullish analysisBullish analysis of ETHUSD.
Looking for wave ((5)) of iii north of 6k.
Let's go!

The $ETH season is inevitable \ Road to $10k
Ethereum has entered its third major market cycle while maintaining its historical cyclical structure.
Regression lines on the logarithmic chart and the repetition of previous cycles indicate that the $10,000 target is technically feasible.
Momentum is increasing, the structure is being finalized. An Ethereum centered market rotation is approaching.


ConsolidationConsolidation broke downward in june. Consolidation broke downward in september.
What comes next: big rally

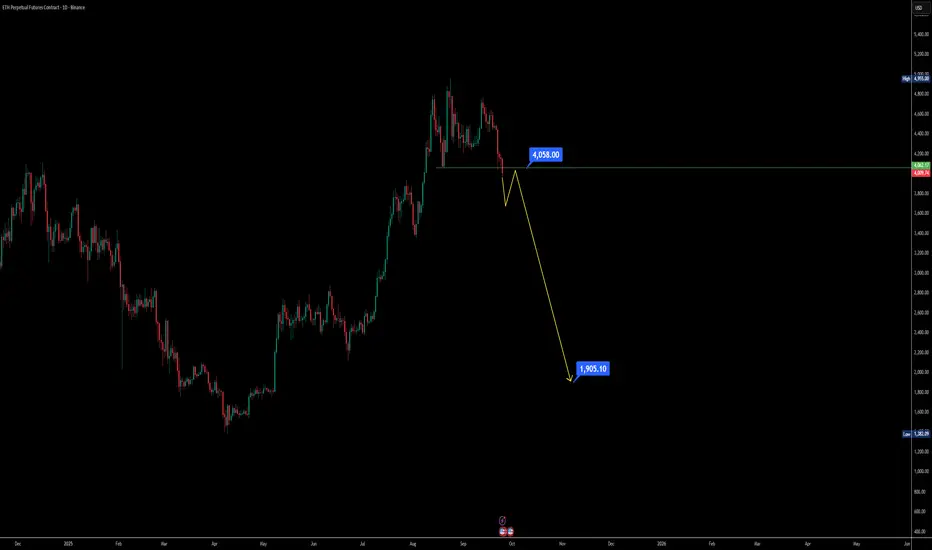
Ethereum Daily Chart Distribution Phase Signals huge dumpIf you’ve been tracking Ethereum on the daily chart, the structure is starting to look heavy — and not in a bullish way. Let’s break this down step by step so it’s easy to follow 👇
Support lost: ETH has already broken its key support zone around $4060, which previously acted as a higher low. Now, the recent dip is printing a new lower low, shifting market sentiment.
Daily close levels matter: If the daily candle closes below $4000, it confirms weakness and opens doors for a further sell-off.
Possible head and shoulders: A pullback toward the $4100 region could simply build the right shoulder of a bearish head and shoulder pattern. The structure matches what we saw earlier on the left shoulder.
Bearish momentum risk: If ETH fails to hold above $4000 after that pullback, we could be looking at extended downside — even a sharp fall toward the $2000 zone based on historical dump patterns.
Market behavior reminder: Over the past two years, whenever ETH started a distribution breakdown, the drop was often fast and violent. That’s why caution is key here.
📌 Key Takeaway: Ethereum is at a make-or-break daily level. Watch $4000 closely — losing this level could accelerate a bearish breakdown. Short-term traders may look for opportunities on the pullback, while long-term holders need to stay cautious of the possible head and shoulders pattern forming.
ETH/USD: The Perfect Time to Buy?! (PART II)Over the last four and a half years, the price range around $4000 has played an important role in ETH movements.
It first acted as support for a short period after ETH made its all-time high back in 2021. More importantly, this level has worked multiple times as strong support. Each touch has only reinforced its importance.
At the beginning of August 2025, COINBASE:ETHUSD made a strong breakthrough — a confirmed breakout. Heavy buying power smashed through the zone.
And now comes the best part: price is currently retesting that breakout zone, a classical Break & Retest setup.
So, this strong price level is now starting to act as support, and technically, this is a very solid setup.
I don’t post crypto that often, but the last time I shared an ETH/USD chart was just before the current rally started. Let’s call this Part II. 😉
Keep an eye on the current price levels — technically, it’s a very clean setup.
Good luck,
Vaido

Ethereum Elliott Wave Daily Analysis : Target 4500Ethereum (Timeframe: 4H)
1. Price Action & Trend
The chart shows a completed bearish wave that ended around zone (i) near the $3,700 level.
From this point, Ethereum started a clear upward move with strong bullish candles, suggesting the beginning of a new impulsive wave according to Elliott Wave Theory.
The first expected target for the current move is the key resistance area at $4,500, which represents a major technical level (the previous high .. clear horizontal line).
2. Support & Resistance
Nearest Support: $3,950 – $4,000 pivot zone of the latest bullish move.
Main Resistance: $4,500 both psychological and technical barrier.
3. Supporting Indicators
Momentum: The strong bullish candles reflect renewed buying demand.
Short-Term Trend: Bullish as long as price holds above $4,000.
✍️ Conclusion:
Analysis suggests that Ethereum is in the process of extending its bullish wave, potentially targeting the $4,500 zone in the coming sessions.
Any corrective pullback toward $4,000 remains a critical level to watch
👍 Don’t forget to boost this trading idea if you found it helpful,
and follow me for more daily crypto insights and trade signals.
Please note:
This is not financial advice – I’m only sharing my personal trades.
Always do your own research before taking action.
Best of luck 🌹

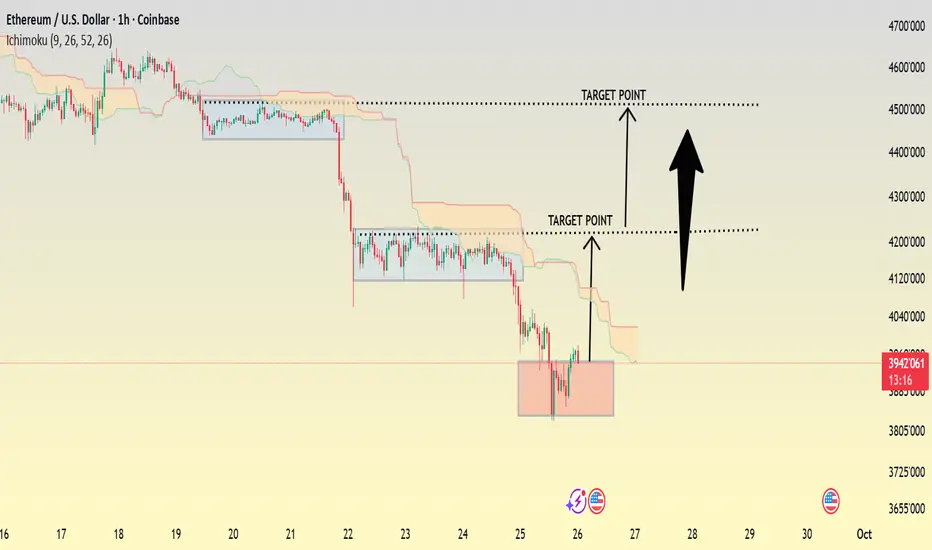
ETH/USD 1HOUR Chart Pattern ....ETH/USD is currently holding above a strong support zone, showing signs of bullish momentum building up. As long as price stays above this zone, buying pressure can continue toward the first target at 3,820 and further extension toward the second target around 4,120.
📌 Entry Zone: 3,945 – 3,940
📌 Target 1: 4,225
📌 Target 2: 4,515
📌 Stop Loss: Below 3,880
⚡ Summary:
ETH is forming a clean bullish structure after consolidation. This setup is favorable for buyers aiming for medium-term upside moves. A break and close above 4225 will confirm stronger bullish continuation.
$ETH Market OutlookCRYPTOCAP:ETH Market Outlook
Ethereum is currently consolidating, with a critical downside level at $4,000.
If $4,000 does not hold, the next supports are $3,500 and $2,400.
The $2,400 scenario remains highly unlikely, as it would imply a full retracement of the previous rally. In contrast, a pullback to $3,500 represents a 50% correction of the last upward move—a realistic outcome that would signal a temporary setback rather than a trend reversal, potentially setting the stage for continued upside momentum.
At present, CRYPTOCAP:ETH is trading within a range and sitting near the midpoint. Should this level break, the bottom of the range becomes the next logical target.
⚠️ Always DYOR.

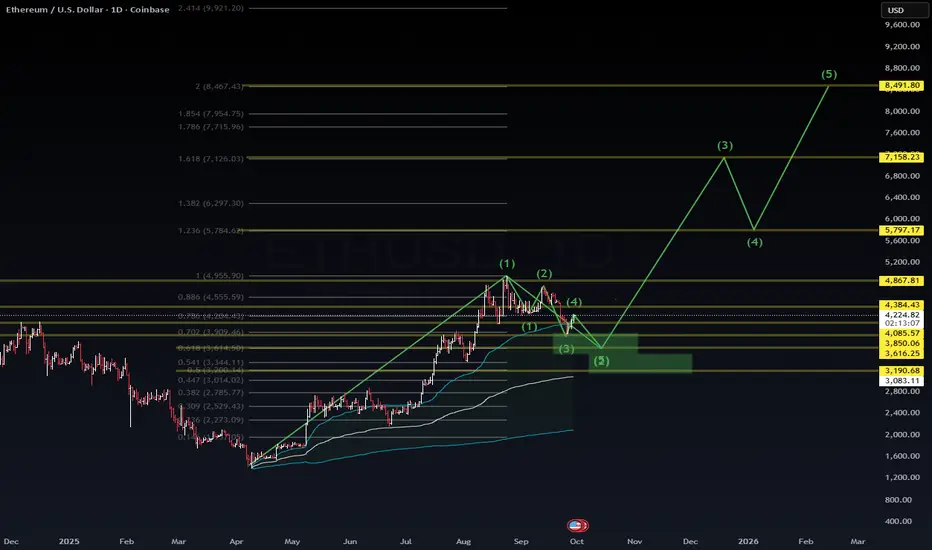
$ETH.X Wave count & Fib levels CRYPTOCAP:ETH 📊 Wave count & Fib levels suggest we could be in the middle of a corrective move before another impulsive leg higher.
✅ Potential accumulation zone highlighted (around $3.6–3.8K).
🎯 Targets: $5.8K → $7.1K → $8.4K if the structure holds.
This is not financial advice — just sharing my personal charting roadmap. Always DYOR and manage risk carefully.
Would love to hear how others are planning their ETH strategy here 👇
#Ethereum #Crypto #ElliottWave
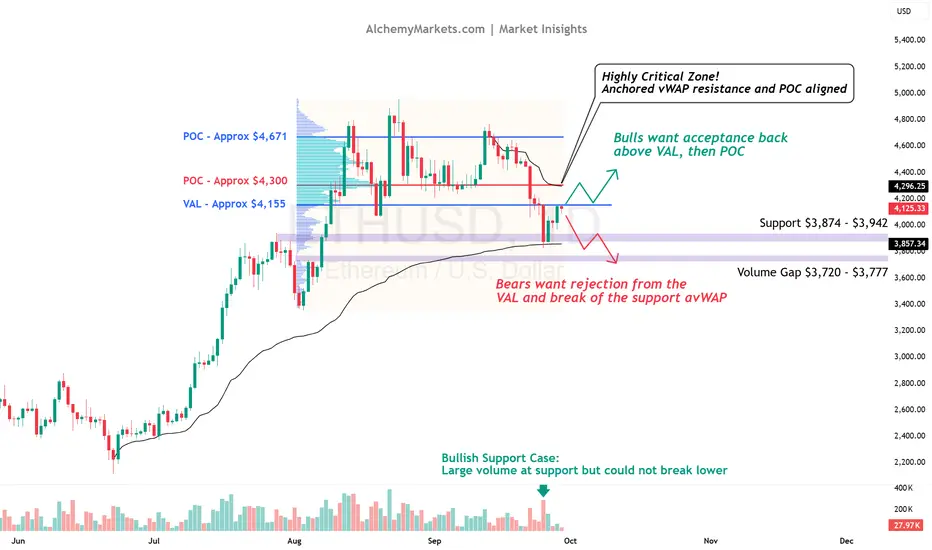
Ethereum Simple Analysis: Back to $4,000 or $4,300 next?After dropping from $4,700, ETH has actually held up better than BTC.
Now it’s sitting at a key decision point — retesting the Value Area Low (VAL) at $4,155, which marked the base of August’s rally from $3,400 to $4,900.
The bigger picture still leans bullish. ETH is holding above the anchored vWAP from July (~$3,857), the average entry point of that entire rally. Staying above means the market is still backing the trend. Lose it, and sentiment flips.
📌 Levels to watch:
$3,857 (anchored vWAP support)
$4,155 (VAL battleground)
$4,300 (critical resistance)
$3,720–$3,777 (volume gap support)
The fight now is simple:
Reject $4,155 → confirms weakness, ETH stays trapped under resistance.
Reclaim $4,155 → opens the door to rotate higher, with $4,300 as the real test.
Why $4,300? Because it’s both the Point of Control (POC) and anchored vWAP from the latest decline - meaning that it's both the most traded price level AND the average price since its decline.
Key takeaway: We are currently testing key resistance. Watch closely for a reaction and if we reclaim $4,155, expect the real test at $4,300.