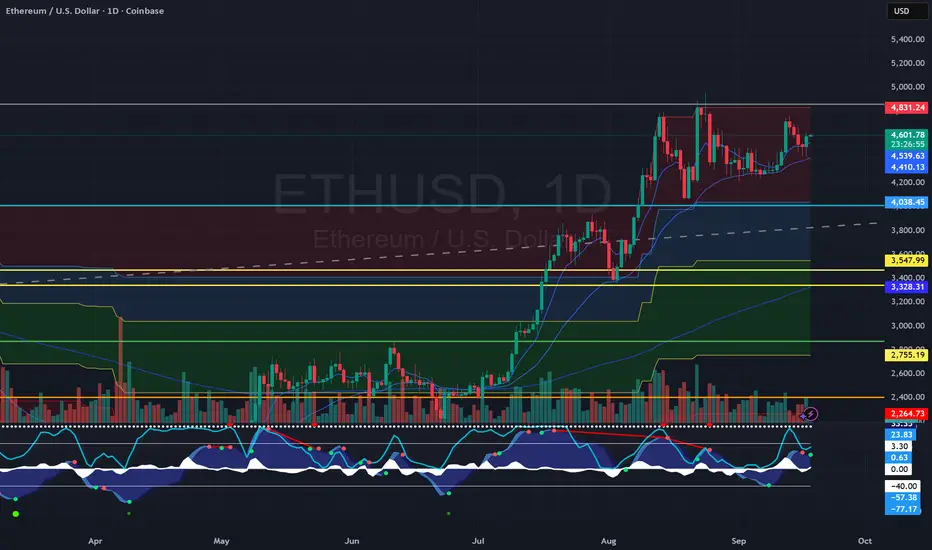
ETHUSD: Absolute Price Collapse Ahead! Short!
My dear friends,
Today we will analyse ETHUSD together☺️
The recent price action suggests a shift in mid-term momentum. A break below the current local range around 4,499.2 will confirm the new direction downwards with the target being the next key level of 4,490.1 and a reconvened placement of a stop-loss beyond the range.
❤️Sending you lots of Love and Hugs❤️
ETHWAVAX_1ACF15.USD trade ideas
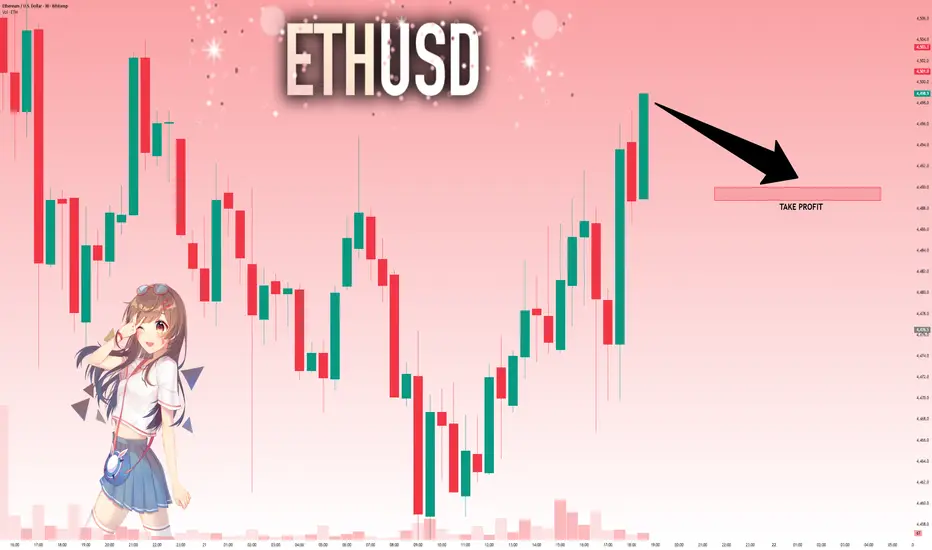
Need more downward movement TAYOR
🚨 ETH/USD Analysis (1H)
ETH still showing downtrend structure 👉 Lower Highs & Lower Lows 📉
🔹 Current setup:
Entry: 4,472 | SL: 4,644 | TP: 4,345
⚖️ RRR = 0.74 (Not ideal ❌)
💡 If we wait for a higher entry near resistance (4,580–4,600):
Risk becomes smaller, reward bigger 👉 RRR ≈ 5.8 ✅
📌 Lesson: Don’t just chase entries. Wait for the best price to get a stronger Risk–Reward Ratio. Minimum 2:1 RRR is the key to long-term success! 🔑
TAYOR

$ETHUSD 4hr timeframeTaking a closer look at BITSTAMP:ETHUSD 's current price structure. Looks like it's bound to go up again.

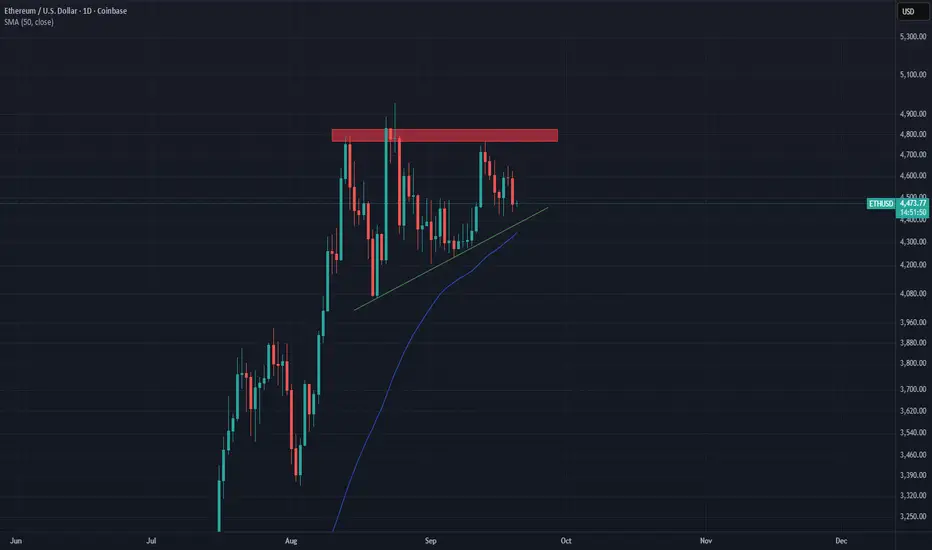
Accending Triangle on Daily ETH is on a critical juncture. We can see a test of ascending trend line at 4380, If it holds the chances of breakout could jump significantly.
There are two factor that are in play right now. The ascending triangle which is considered a bullish pattern and a hidden bullish divergence on RSI. These two factors make a scenario bullish but we need to see the test of green trendline first to confirm the scenario. Lets see how it plays out.
Hidden Bullish Divergenece On ETH DailyThe is a clear Hidden divergence on ETH Daily. Also an ascending triangle is forming on the same timeframe. Lets see where they can take us.

ETH SERIES | Part 1 – ETH/USDT (4H)
ETH is the biggest altcoin, and likely the driver of the next altcoin move.
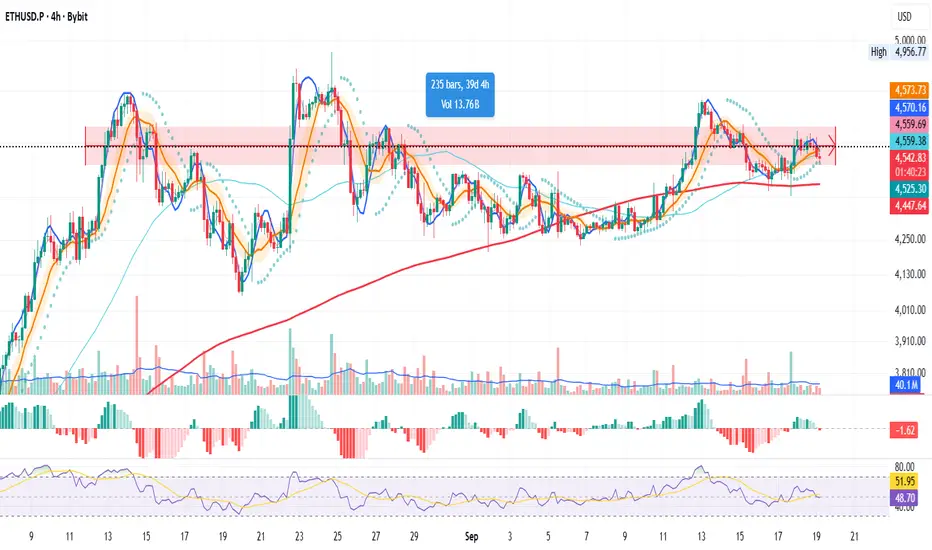
For 40 days, ETH has been fighting the red resistance zone while the 200MA holds as support.
Even after dipping below, the Fed rate cuts pushed price back over it, but ETH still couldn’t break higher.
For now:
No longs while price is below the BB center + 50MA
Just watching to see if price retests the 200MA for support
No shorts either, patience mode.
Next stop → ETH/BTC to get more context.
Always take profits and manage risk.
Interaction is welcome.
Bullish bounce from support?ETH/USD is falling towards the pivot which has been identified as an overlap support and oculd bounce to the 1st resistance.
Pivot: 4,477.50
1st Support: 4,239.45
1st Resistance: 4,761.40
Disclaimer:
The above opinions given constitute general market commentary, and do not constitute the opinion or advice of IC Markets or any form of personal or investment advice.
Any opinions, news, research, analyses, prices, other information, or links to third-party sites contained on this website are provided on an "as-is" basis, are intended only to be informative, is not an advice nor a recommendation, nor research, or a record of our trading prices, or an offer of, or solicitation for a transaction in any financial instrument and thus should not be treated as such. The information provided does not involve any specific investment objectives, financial situation and needs of any specific person who may receive it. Please be aware, that past performance is not a reliable indicator of future performance and/or results. Past Performance or Forward-looking scenarios based upon the reasonable beliefs of the third-party provider are not a guarantee of future performance. Actual results may differ materially from those anticipated in forward-looking or past performance statements. IC Markets makes no representation or warranty and assumes no liability as to the accuracy or completeness of the information provided, nor any loss arising from any investment based on a recommendation, forecast or any information supplied by any third-party.

ETHEREUM POSSIBLE NEXT MOVEETHUSD
price break above the 4hr resistance after a long time consolidation
the resistance has been tested so lets long for buying opportunity

ETH Cup and Handle on the DailyI think ETH is about to complete a Cup and Handle on the daily timeframe. What do you think?
FOMC ANTI CLIMAXThe long-awaited rate cut is finally here — but instead of a huge pump in crypto, the market gave us an anti-climax.
Bitcoin (BTC) barely moved higher after the news, leaving traders questioning what’s next.
In this video I break down:
- Why BTC didn’t rally after the rate cut
- What this means for the total crypto market
- The levels I’m watching next using ICT concepts
- A potential long setup I see forming on XRP
This is a reminder that the market doesn’t always follow the news — price action tells the real story.
👉 Were you surprised by the market’s reaction to the rate cut? Drop your thoughts in the comments.
#Crypto #Bitcoin #XRP #ICTTrading #CryptoAnalysis #RateCut #fomc
Stay tuned — this is NOT financial advice, just my analysis. Always do your own research before trading.

ETH re-distribution patternHere we have a classic Wyckoff re-distribution pattern for a continuation to the downside. I'm looking for 4200 by Friday.

ETHUSD NEW OUTLOOKAccording to ETHUSD market going in sidewave now it look bullish trade we have to wait for good opportunity market will be touch the SUPPORT LEVEL we can go buy from support level dont be greedy use money management
TRADE AT YOUR OWN RISK
REGARD ALBERT

The Bullish and Bearish Cases For ETH/USDOverview:
This idea contains both bullish and bearish cases for ETH/USD.
Bullish Case:
ETH/USD has formed a bullish pennant since April 8th. A strong break above the pennant's upper line indicates further upward momentum. The probability of success for a bullish pennant is roughly 54%.
Bullish Case Warning:
Although the bullish pennant is formed, there is a chance the price breaks below its bottom line, which would invalidate it. The bullish pennant is also accompanied by bearish RSI divergence, making a break of the bottom line more likely.
Bearish Case
Since December 17th, 2024, ETH/USD has formed a bearish butterfly harmonic pattern. The probability of success for a harmonic butterfly is roughly 75%. In addition to the butterfly, ETH/USD has short-term bearish divergence, further supporting point D as a turning point downward.
If the butterfly plays out, I would expect an initial drop to the 0.618 Fibonacci around $2750.
Bearish Case Warning
Given that there is a bullish pennant on the short term, I would wait until it is invalidated before taking a short position.

Don’t Buy Ethereum Yet: The Liquidity Sweep Trap You Must AvoidBefore the liquidity sweep , Ethereum’s price action can be highly unpredictable. Traders are advised to hold off on buying, stay patient, and focus on disciplined crypto risk management. Waiting for confirmation signals not only reduces exposure to volatility but also improves the effectiveness of any Ethereum trading strategy.

ETHUSD, bullish short-term caseBullish case for ETHUSD.
This Elliott Wave count has price in wave (5) of ((3)) of iii.
Wave (4) retracing to 4 of lesser degree, .236 from (3) to (2).
Current price sitting at .5-.618 support, with volume profile point-of-control providing support at well.
If this proves correct, target wave (5) completion above 6500.
Analysis invalid below support of 4209.01.

Ethereum to $15,000Ethereum to $15,000 during the completion of Wave 5. Ethereum is in a bullish triangle correction. Breakout from correction will complete pattern.

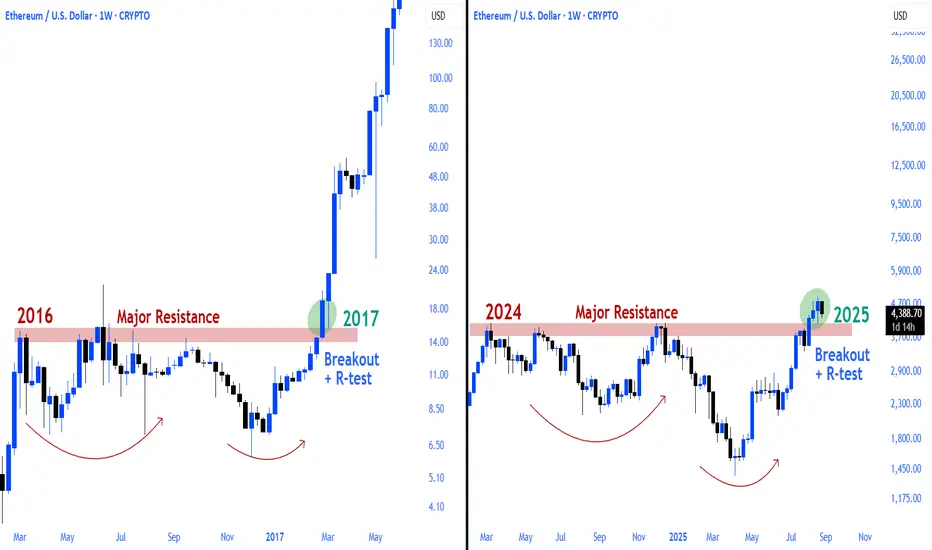
ETHEREUM Is it realistic to expect last Cycle's rally?Ethereum (ETHUSD) has been practically consolidating since the mid-August High, following an impressive rally on the April 07 Low. Technically it is coming off a 1W MA50/100 Bullish Cross.
It is the exact same pattern that confirmed ETH's massive parabolic rise (green Channel Up) during the previous Cycle in August 17 2020. The 1W RSI fractals between the two sequences are similar.
However, time-wise we are not in the same stage as last Cycle, in fact we are much closer to the end of the 4-year Cycle model. If there is still some time to repeat such a parabolic run, the price is 'limited' by the 1.618 Fibonacci extension at $13500, which again will be a wonderful and increasingly optimistic target for this Cycle Top.
Do you think it is realistic to expect such repeat at this stage?
-------------------------------------------------------------------------------
** Please LIKE 👍, FOLLOW ✅, SHARE 🙌 and COMMENT ✍ if you enjoy this idea! Also share your ideas and charts in the comments section below! This is best way to keep it relevant, support us, keep the content here free and allow the idea to reach as many people as possible. **
-------------------------------------------------------------------------------
💸💸💸💸💸💸
👇 👇 👇 👇 👇 👇

ETH Accumulates for Uptrend Above 5000ETH Technical Analysis
1. Current Market Structure
• ETH is consolidating within a symmetrical triangle pattern.
• The price is trading around 4,487, holding above the moving averages but facing strong resistance ahead.
2. Key Resistance Levels
• 4,573 – 4,653 (Fib 0.618 – 0.786 zone): A critical resistance area where sellers may emerge.
• 4,754: Strong resistance level and neckline of the triangle.
• 5,040: Major target if the price breaks above the 4,754 resistance, aligning with the 1.618 Fib extension.
3. Key Support Levels
• 4,295 – 4,310 zone: Strong demand area and lower triangle support.
• A breakdown below this level could trigger deeper corrections.
4. Price Outlook
• Scenario 1: ETH may retest the 4,295 support zone before bouncing back towards the upper resistance at 4,754.
• Scenario 2: A confirmed breakout above 4,754 could accelerate bullish momentum towards 5,040.
👉 Conclusion: ETH remains bullish as long as it holds above the 4,295 support. Watch for a breakout at 4,754 to confirm continuation towards 5,040.

NVIDIA & ETHUSD Daily Trade SetupsIN this update we review the recent price action in Nvidia and ETHUSD and identify the next high-probability trading opportunities and price objectives to target. To review today's video analysis, click below!

Ethereum: Breakout or Pullback After FOMC?Hello everyone, let’s take a look at ETH together! 🚀
On the H4 chart, ETH has paused after its surge to 4.8k, consolidating between 4.45k–4.62k while staying above the rising Ichimoku cloud – a sign the medium-term trend remains strong. The latest dip came with lighter volume, suggesting profit-taking rather than a full reversal. Key supports lie at 4.47k–4.45k, then deeper at 4.41k–4.39k and 4.35k–4.33k. On the upside, 4.58k–4.62k is the major resistance zone; if cleared, ETH could head toward 4.70k–4.80k. As long as the price holds above 4.41k, this remains an accumulation phase within the uptrend.
The spotlight this week is on the FOMC. A dovish Fed could cool USD and yields, lifting risk assets and giving ETH the push it needs to break past 4.62k. A hawkish outcome, however, might trigger a retest of 4.47k–4.41k to gauge demand. ETF flows and on-chain activity also matter: strong inflows would support recovery, while outflows could pressure supports. Overall, bias stays bullish, but the decisive move hinges on the FOMC – the switch that may set ETH’s next direction.
What’s your take on ETH’s setup? Share your view!

Interesting IndicatorOver the past few days I've published my first script "Fibonacci Trader". It spotted a good trade in ETH but the market started off red. I learned something new today and decided to implement that into a strategy. It is a trend continuation indicator. Works great in the lower time frame such as 1M or 3M(better).
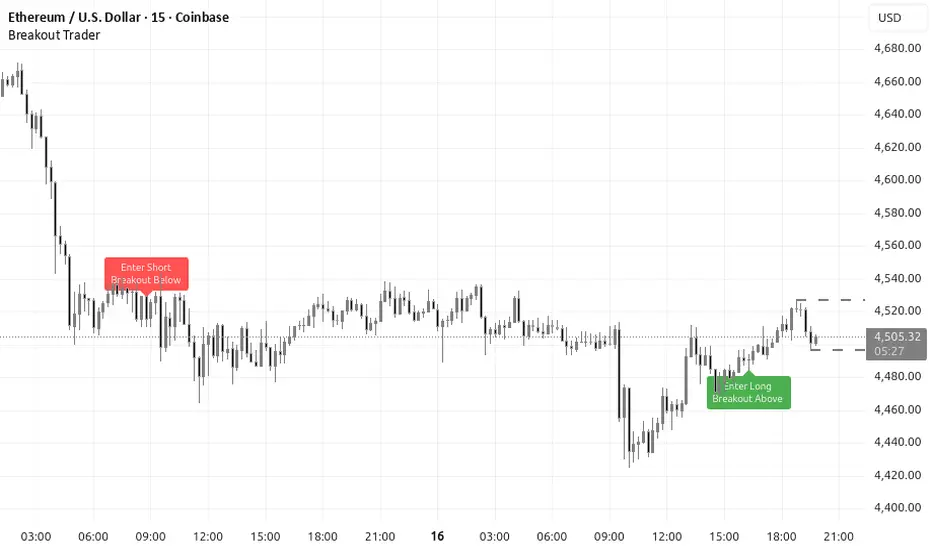
Breakout Trader
This script is designed to catch breakout opportunities that develop after a clear trend has already been established. By tracking price pivots and measuring key retracement levels, it can identify points where momentum shifts create the setup for a potential continuation move. These signals often occur when a failed attempt to push price further in the opposite direction leads instead to renewed strength in the original trend.
It is particularly effective on lower time frames, where breakouts can quickly evolve into strong extended moves. On charts like the 1-minute or 3-minute, the script helps traders capture these fast-developing opportunities, giving early warnings of potential entries that may lead to much longer trend extensions.
EthereumEthereum was below 4500 for a few days. After being broken again upwards, we are currently testing the 4500 support. The uptrend may continue and we can expect an all-time high at 5000.
