Why the Yen Remains Weak Despite Hawkish BoJ SignalsAt its 23/Jan policy meeting, the BoJ held rates steady but adopted a more hawkish tone, emphasizing that further hikes remain possible and flagging currency depreciation and bond yield volatility as near-term risks. Despite this shift, the yen weakened, falling to a two-week low near 159.
In the hours that followed, the yen reversed sharply, strengthening to 154. The move was driven not by the BoJ decision but by reports that the New York Fed had conducted a spot rate check, which markets interpreted as a possible precursor to coordinated intervention. The yen continued to strengthen over the following week, reaching a 90-day high near 152.
Sentiment then shifted again. The yen weakened back toward 155, reflecting renewed dollar strength and fading expectations of near-term intervention. Taken together, these moves highlight the forces driving the yen and point to a near-term outlook that remains biased to the downside. This paper examines these dynamics and outlines how investors can express views using CME futures.
Hawkish Rhetoric, Weak Fundamentals: Why the BoJ Is Not Moving the Yen
The BoJ has maintained a hawkish posture since December, yet this has failed to arrest the yen’s decline. Following the December rate hike, the yen weakened by more than 1% immediately after the announcement, reflecting scepticism that the policy shift was sufficient.
This sentiment, combined with divergence between monetary and fiscal policy, pushed the yen to 1.5-year lows. The January meeting produced a similar reaction, with the yen weakening by almost 0.5%. Market pricing continues to signal that investors view the BoJ’s actions as inadequate.
This occurred despite the BoJ’s Summary of Opinions indicating that further hikes may be necessary, particularly in response to yen weakness. Policymakers also stated they would act promptly if conditions deteriorate. If the yen remains significantly weaker by the March meeting, a rate hike becomes more likely.
However, with the next meeting still around 45 days away, near-term market forces are likely to dominate. Ongoing conflicts between monetary and fiscal policy continue to weigh on the currency and reinforce bearish sentiment.
Threats Don’t Stabilize FX: Intervention Only Works When It Hits the Tape
The sharp yen appreciation on 23/Jan may appear linked to the BoJ decision, but the timing suggests otherwise. The move occurred hours later and was triggered by reports of a New York Fed spot rate check, which markets interpreted as a signal of potential coordinated intervention.
Historically, such episodes have marked key reversal points for the yen, prompting traders to reduce short positions. This dynamic was reinforced by increasingly strong warnings from Japan’s prime minister and finance ministry over the following week.
At the World Economic Forum in Davos, US Treasury Secretary Scott Bessent stated that coordinated support for the yen was not under consideration, citing the US preference for a strong dollar. Without US participation, Japan would need to act alone. As of 28/Jan, no intervention had taken place.
While verbal warnings often precede action, the absence of concrete intervention suggests the yen is likely to revert to its broader weakening trend. The average gap between prior intervention warnings and actual interventions was 20 days.
Moreover, any intervention needs to be significantly larger than previous efforts, as the scale required has increased over time. This further limits the effectiveness of such measures.
As a result, traders should remain alert to the risk of sharp reversals and manage exposure carefully, including through stop losses or options-based hedging strategies.
Dollar Strength Is Becoming a Headwind, Not a Tail Risk
Renewed dollar strength has become a headwind. The Dollar Index has risen by more than 1% following reports that Donald Trump intends to appoint Kevin Warsh as the next Fed Chair. Warsh is viewed as an inflation hawk, a stance that would support a stronger dollar and reinforce confidence in Fed independence.
With the potential for a structural reversal in the dollar, conditions are becoming increasingly unfavourable for the yen. Over recent months, dollar weakness had limited yen depreciation. As that support fades, the yen faces renewed downside pressure.
Yen Options Use Case
Fundamental conditions for the yen remain weak. BoJ policy actions have had limited impact, while the US dollar is showing signs of a structural reversal. Together, these factors point to a bearish near-term outlook for the yen.
Last week, rising intervention risk triggered a sharp but temporary strengthening in the yen. Since then, no intervention has materialised. Historically, in the gap between warnings and action, the yen tends to weaken as bearish positioning tests official tolerance.
When the yen is expected to weaken ahead of potential intervention, holders of yen-denominated assets face asymmetric risk. Depreciation is typically gradual, while intervention-driven appreciation is abrupt. Hedging upside tail risk while maintaining exposure, therefore, makes sense.
One effective structure is to hedge yen exposure using CME JPY/USD futures paired with protective call options. A short futures position offsets near-term depreciation, while a long call preserves protection against intervention-driven appreciation.
The period from 21/Jun to 14/Jul 2024 illustrates this dynamic. Despite repeated MOF warnings, the yen continued to weaken until confirmed intervention on 11/Jul triggered a sharp price spike.
For holders of yen-denominated assets, this structure is well-suited to periods of elevated intervention risk. It protects against depreciation while converting sudden appreciation into a defined and manageable cost, without reducing underlying exposure.
For illustration, the calculation of payoff for these positions in 6J futures and options is described below:
Futures Entry: 0.006380
Futures Price on 10/July: 0.006245
Short Futures Profit/Loss on 10/July: 1687.5 ((0.00638-0.006245) x 12500000)
This content is sponsored.
MARKET DATA
CME Real-time Market Data helps identify trading setups and more effectively express market views. If you have futures in your trading portfolio, you can check out on CME Group data plans available that suit your trading needs at tradingview.com/cme .
DISCLAIMER
This case study is for educational purposes only and does not constitute investment recommendations or advice. Nor are they used to promote any specific products, or services.
Trading or investment ideas cited here are for illustration only, as an integral part of a case study to demonstrate the fundamental concepts in risk management or trading under the market scenarios being discussed. Please read the FULL DISCLAIMER, the link to which is provided in our profile description.
What traders are saying

A Supply-and-Demand View of the Japanese YenPattern recognition and technical analysis are the foundations of price action in forex trading. Supply and demand dictate that for markets to be in equilibrium, demand must equal supply. Excessive supply without compensatory demand causes prices to crater, vice versa is true.
Post Covid, the Japanese Yen has been on a steady decline mimicking the Yen futures. The price decline for the 5-year period caused a price imbalance that markets must correct via bullish price action targeting the supply zone at 0.0089 price handle.
Presently, on the daily charts, we have a confirmed signal of bullish reversal. Once price contacts the short-term imbalance/fair value gap at 0.0064 we will be on the look out for buying opportunities at the liquidity levels of 0.0063 price handle.

Yen February view
- Where is price?
Price is in Area3 on the quarterly and area 4 on the monthly timeframe. February candle will open in area 4, making it a congestion entrance candle. Direction is turning up, slopes also up on the monthly, the qyarterly has still three months for the candle to form
- What is it doing?
February will be congestion entrance candle, notfying us that the next type of trading after the trend down up till now will be congestion action. The congestion entrance target is two PLDots back, limits of congestion action is the January candle low and high in this case
- What is next?
For the monthly to trade in congestion action, the weekly needs to trade between the dotted line and the block level which in this case is Jan candles low and high. Next week, there is strong support at the static ETOP where price will open and should continue to push price towards the congestion entrance target which should be reached within Feb. (0.006632).

FX Trends with Lower DollarThe FX markets have entered 2026 defined by a structural shift in the U.S. dollar’s dominance and a resurgence of technical volatility. After a turbulent 2025 marked by "Liberation Day" tariffs and significant greenback depreciation, the first weeks of 2026 have seen FX futures traders pivot toward a "neutral rate" narrative. With the Federal Reserve expected to guide the federal funds rate toward a 3.00%-3.50% terminal range, the massive yield advantages that previously buoyed the dollar are narrowing. This has led to a steady bid in EUR/USD and GBP/USD futures, as market participants anticipate that the European Central Bank and the Bank of England have largely concluded their easing cycles, creating a more balanced interest rate differential across the Atlantic.
In the Asia-Pacific theater, the Japanese Yen and Chinese Yuan futures have become focal points for macro speculators. As the Bank of Japan signals further policy normalization to combat a 20% undervaluation of the Yen, USD/JPY futures have experienced sharp downward pressure, occasionally exacerbated by AI-driven "flash super-cycles" that compress weeks of price action into mere hours. Additionally, 2026 has introduced significant regulatory shifts, including China opening its nickel and lithium futures to foreign investors and the implementation of the SEC’s central clearing mandates for Treasury-linked derivatives. These "plumbing" changes are altering liquidity patterns, forcing institutional desks to manage FX risk with higher precision.
If you have futures in your trading portfolio, you can check out on CME Group data plans available that suit your trading needs tradingview.com/cme/
*CME Group futures are not suitable for all investors and involve the risk of loss. Copyright © 2023 CME Group Inc.
**All examples in this report are hypothetical interpretations of situations and are used for explanation purposes only. The views in this report reflect solely those of the author and not necessarily those of CME Group or its affiliated institutions. This report and the information herein should not be considered investment advice or the results of actual market experience.

JPY Futures – Swing Long IdeaCommercials (Smart Money) are clearly positioned bullish, indicating underlying accumulation.
At the same time, price is trading at relatively cheap levels versus the US Dollar from a short-term valuation perspective.
We are now approaching a well-defined demand zone, visible on both the weekly and daily timeframe, which increases the technical relevance of this area significantly.
Seasonality supports the idea as well: the current window is neutral to slightly bullish, which aligns well with a potential upside reaction from demand.
Trade idea:
Bias: Long
- Context: Smart Money bullish + favorable valuation
- Location: High-quality HTF + LTF demand zone
- Seasonality: Sideways → Bullish
- Target: 2R

Japanese Yen Near Recent LowsRecent selling pressure in Japanese yen futures has intensified as 2026 begins, driven primarily by a widening "policy divergence" between the Bank of Japan and other major central banks. Despite a slight move toward normalization late last year, the BoJ has maintained a cautious stance, with market participants increasingly betting that further interest rate hikes will be delayed until the second half of 2026. This dovish outlook, contrasted against a resilient U.S. economy and a Federal Reserve that has been slow to cut rates, has reinvigorated the "carry trade." In this environment, investors borrow yen at low costs to invest in higher-yielding assets abroad, creating a persistent technical downtrend that has pushed yen futures toward one-year lows.
Beyond monetary policy, a cocktail of domestic political uncertainty and geopolitical friction has further dampened appetite for the yen. Speculation that the Prime Minister may call for an early general election in late January has introduced a fiscal risk premium, as her administration’s focus on aggressive fiscal stimulus raises concerns about Japan's massive debt burden and future bond supply. Simultaneously, escalating trade tensions with China, specifically Beijing’s threats to restrict rare-earth exports, threaten Japan’s critical automotive and tech sectors. These combined factors have led speculators to treat the yen as a funding currency rather than a safe haven.
If you have futures in your trading portfolio, you can check out on CME Group data plans available that suit your trading needs tradingview.com/cme/
*CME Group futures are not suitable for all investors and involve the risk of loss. Copyright © 2023 CME Group Inc.
**All examples in this report are hypothetical interpretations of situations and are used for explanation purposes only. The views in this report reflect solely those of the author and not necessarily those of CME Group or its affiliated institutions. This report and the information herein should not be considered investment advice or the results of actual market experience.

Forget the Textbook: A 30-Year Reality CheckA Big Policy Moment
A central bank (BOJ) just pushed interest rates to levels not seen in 30 years.
That’s not a routine tweak — that’s a regime shift.
Textbooks might suggest a clean, logical market response.
Reality? Markets got emotional. Fast.
Selling Got Loud
Instead of an orderly adjustment, selling pressure exploded.
Not just “price going down,” but effort going through the roof.
That’s where Volume Delta comes in — the net difference between buying and selling volume. It tells us who is pressing the gas pedal.
And in this case, sellers floored it.
When an Indicator Starts Yelling
Now here’s the interesting part.
Bollinger Bands weren’t applied to price…
They were applied to Volume Delta itself.
Result?
Volume Delta plunged far below its lower Bollinger Band.
That’s not normal selling.
That’s everyone trying to get out at the same time.
Does that mean price must reverse?
Nope. But it does suggest selling is becoming inefficient.
No Safety Net Below
Here’s the catch.
There are no meaningful UFO supports (UnFilled Orders) below current price.
No obvious institutional “safety net.”
Instead, only two old technical floors remain:
0.0063330
0.0062415
Think of them as floors, not trampolines. Price may react… or punch straight through.
Reaction Beats Guessing
This is where patience matters.
Extreme selling doesn’t mean “buy now.”
It means watch closely.
At those levels, traders are looking for:
Selling pressure slowing down
Price stabilizing
Daily closes showing acceptance or rejection
No assumptions. Only reactions.
Don’t Forget the Ceiling
Even if price bounces, there’s a ceiling waiting above.
A clear sell-side UFO resistance sits near 0.0065640.
That’s leftover supply — the kind that often stops rallies in their tracks.
So any upside move?
Treat it as corrective until structure says otherwise.
Contract Specs
This analysis uses both standard and micro futures to illustrate scalable risk. Japanese Yen Futures (6J) have a tick size of 0.0000005 with a $6.25 tick value and currently require roughly ~$2,800 in margin per contract, while Micro JPY/USD Futures (MJY) use a 0.000001 tick size with a $1.25 tick value and margin closer to ~$280. Margin requirements vary by market conditions and broker policies, and micro contracts can be especially useful when volatility expands following major macro events.
The Big Takeaway
Historic policy decisions don’t end stories — they start messy chapters.
Extreme Volume Delta shows stress, not certainty.
Structure decides what comes next.
When markets digest big shocks, the edge doesn’t come from predicting —
It comes from staying disciplined while everyone else reacts.
Want More Depth?
If you’d like to go deeper into the building blocks of trading, check out our From Mystery to Mastery trilogy, three cornerstone articles that complement this one:
🔗 From Mystery to Mastery: Trading Essentials
🔗 From Mystery to Mastery: Futures Explained
🔗 From Mystery to Mastery: Options Explained
When charting futures, the data provided could be delayed. Traders working with the ticker symbols discussed in this idea may prefer to use CME Group real-time data plan on TradingView: www.tradingview.com - This consideration is particularly important for shorter-term traders, whereas it may be less critical for those focused on longer-term trading strategies.
General Disclaimer:
The trade ideas presented herein are solely for illustrative purposes forming a part of a case study intended to demonstrate key principles in risk management within the context of the specific market scenarios discussed. These ideas are not to be interpreted as investment recommendations or financial advice. They do not endorse or promote any specific trading strategies, financial products, or services. The information provided is based on data believed to be reliable; however, its accuracy or completeness cannot be guaranteed. Trading in financial markets involves risks, including the potential loss of principal. Each individual should conduct their own research and consult with professional financial advisors before making any investment decisions. The author or publisher of this content bears no responsibility for any actions taken based on the information provided or for any resultant financial or other losses.

3-Decade Rate Milestone: How Markets Digest Policy ShocksA Central Bank Decision Decades in the Making
When a central bank moves interest rates to levels not seen in three decades, markets rarely respond in a linear or orderly fashion. Such decisions are not interpreted as isolated adjustments, but as structural signals that force participants to reassess positioning, risk, and longer-term assumptions.
The recent interest rate increase by the Bank of Japan marked exactly that kind of milestone. Beyond the numerical change itself, the decision carried symbolic weight: a clear departure from an era defined by extraordinary accommodation. Yet, rather than triggering a straightforward repricing, the immediate market response leaned heavily toward aggressive selling pressure in the Japanese Yen.
This disconnect between policy intent and market reaction highlights an important reality: markets do not simply react to decisions — they digest them. And digestion is often messy.
From Policy Shock to Positioning Shock
Major policy announcements tend to unfold in two phases. The first phase is informational, where the headline is absorbed. The second phase is positional, where traders and institutions adjust exposure based on how that information interacts with existing risk.
In this case, the rate hike represented a known risk event, but its implications were far from binary. Messaging around future policy paths, real-rate dynamics, and external yield differentials all contributed to uncertainty. That uncertainty translated into heavy participation on the sell side, not because the outcome was definitively bearish, but because positioning needed to be reset.
This is where flow-based tools become especially valuable. Price alone often obscures what is really happening beneath the surface.
Flow Exhaustion as an Analytical Framework
Flow exhaustion is not about calling tops or bottoms. It is about identifying moments when participation becomes unusually one-sided, increasing the probability that continuation becomes harder to sustain.
One easy way to observe this phenomenon is through Volume Delta, defined as the net difference between buying volume and selling volume over a given period. Volume Delta provides insight into how aggressively one side of the market is pressing its case.
Unlike traditional price-based indicators, Volume Delta focuses on effort rather than outcome. Price can move modestly while effort is extreme — and it is often in those situations where future responses become most interesting.
Bollinger Bands® on Volume Delta, Not Price
In this framework, Bollinger Bands® are applied not to price, but to Volume Delta itself. This distinction is critical.
Bollinger Bands® on price measure volatility relative to price behavior. Bollinger Bands® on Volume Delta measure participation extremes relative to historical flow behavior. When Volume Delta trades far beyond its lower band, it signals that selling pressure is not just dominant, but statistically stretched.
On the daily chart, Volume Delta recently moved well below its lower Bollinger Band®. This represents an exaggerated imbalance, suggesting that sellers were acting with urgency and intensity rarely sustained over extended periods.
Importantly, this does not imply that price must reverse. It simply indicates that the marginal impact of additional sellers may be diminishing.
What Extreme Selling Really Means
Extreme selling does not mean that buyers suddenly appear in force. It means that the market has already absorbed a significant amount of sell-side participation.
In practical terms, when Volume Delta reaches such depressed levels, one of two things tends to occur:
Selling slows, leading to consolidation or corrective movement.
Price seeks lower levels where new participants are willing to engage.
Which outcome unfolds depends heavily on structure — specifically, what lies beneath price.
The Support Landscape Below Price
A critical observation in the current structure is the absence of UFO support levels (UnFilled Orders) beneath current price levels. UFO supports represent areas where prior institutional participation was not fully satisfied, often acting as structural reference points.
Without meaningful UFOs below, the market cannot rely on obvious liquidity-backed demand. Instead, attention shifts to historical technical supports derived from prior pivot lows.
Two such levels stand out:
0.0063330
0.0062415
These levels represent areas where price previously found acceptance.
Reaction Zones, Not Assumptions
At this stage, the distinction between anticipation and reaction becomes essential. Extreme Volume Delta does not justify preemptive positioning. Instead, it highlights zones where observation becomes critical.
At each technical support, traders may evaluate:
Whether selling pressure visibly decelerates
Whether price stabilizes despite continued effort
Whether daily closes show acceptance or rejection
The first support may hold. It may also fail. The absence of structural UFO support means the market retains flexibility, and traders must adapt accordingly.
Overhead Structure: Supply Still Matters
While attention often gravitates toward potential downside exhaustion, it is equally important to recognize what exists above price.
A relevant sell-side UFO resistance is located near 0.0065640. This zone represents UnFilled Sell orders and remains structurally intact.
Should price respond positively from lower levels, this area becomes a natural reference point where supply could reassert itself. In downtrending environments, rebounds frequently encounter resistance before any broader shift occurs.
This reinforces the importance of framing any upside move as corrective unless proven otherwise by structure.
Hypothetical Trade Framework (Illustrative Case Study)
To translate these observations into a practical framework, consider a purely illustrative example.
A hypothetical long-side case study could involve:
Monitoring price behavior at either technical support level
Waiting for evidence of stabilization or responsive buying
Using the support zone as a contextual risk reference
Defining invalidation below the chosen support
Referencing the overhead UFO resistance as a potential objective (target)
The reward-to-risk profile in such a framework depends entirely on execution and confirmation. This example is presented solely to demonstrate how flow exhaustion and structure may be combined.
Contract Specifications
This analysis references both standard and micro futures contracts to illustrate scalability and risk calibration.
Japanese Yen Futures (6J):
Tick size: 0.0000005
Tick value: $6.25
Currently ~$2,800 per contract
Micro JPY/USD Futures (MJY):
Tick size: 0.000001
Tick value: $1.25
Currently ~$280 per contract
Margin requirements vary by market conditions and broker policies. Micro contracts can be particularly useful in environments where volatility expands following macro events.
Risk Management Considerations
Policy-driven markets tend to remain unstable longer than expected. Even when selling pressure appears exhausted, uncertainty persists.
Key risk management principles include:
Defining risk before engagement
Adjusting size to reflect volatility
Avoiding emotional responses to extreme indicators
Accepting that not all exhaustion leads to reversals
Structure, not conviction, should guide decision-making.
How Markets Digest Policy Shocks
Major policy milestones do not resolve narratives — they reshape them. Flow extremes reveal stress points in positioning, not certainty in direction.
In the aftermath of a 3-decade rate milestone, the market enters a digestion phase. Volume Delta extremes suggest that selling pressure has been intense, but structure determines how that pressure resolves.
Patience, observation, and disciplined reaction remain the most reliable tools when markets recalibrate after historic decisions.
Data Consideration
When charting futures, the data provided could be delayed. Traders working with the ticker symbols discussed in this idea may prefer to use CME Group real-time data plan on TradingView: www.tradingview.com - This consideration is particularly important for shorter-term traders, whereas it may be less critical for those focused on longer-term trading strategies.
General Disclaimer
The trade ideas presented herein are solely for illustrative purposes forming a part of a case study intended to demonstrate key principles in risk management within the context of the specific market scenarios discussed. These ideas are not to be interpreted as investment recommendations or financial advice. They do not endorse or promote any specific trading strategies, financial products, or services. The information provided is based on data believed to be reliable; however, its accuracy or completeness cannot be guaranteed. Trading in financial markets involves risks, including the potential loss of principal. Each individual should conduct their own research and consult with professional financial advisors before making any investment decisions. The author or publisher of this content bears no responsibility for any actions taken based on the information provided or for any resultant financial or other losses.

Smart Money Made a Weird Move in JPY..Here’s What It Means for UJPY Futures: A Rare & Complex "Condor" in Play
On the JPY futures chart, just above current price, lies a wing of a "Condor" option structure that formed last week.
This isn’t a small play — the size suggests a serious participant.
Historically, in 4 out of 5 cases, price has reacted to the wings of a Condor — often reversing at these levels.
The logic here is clear:
For maximum profit, price must stay within a specific range by expiry.
But here’s the twist:
This Condor was built across multiple expiry series — an unusual setup that adds complexity and questions about its effectiveness.
So honestly?
I’m genuinely curious:
Will price respect this non-standard Condor wing?
📌 I’ve set an alert.
And yes — a sell limit order is in place (with reduced size).
Anyone else have different observations? Let’s discuss.

(JPY) futures: The Risk and Rate DifferentialThe Yen chart highlights global risk appetite and the impact of interest rate divergence.Pattern: The price is in a long-term decline, consolidating in a descending wedge/triangle above major support approx 0.0063$.
Signal: The Yen's weakness is fundamentally caused by the massive interest rate differential between low Japanese yields and high US yields.
- US 10Y Yield approx 4.02%
- Japan 10Y Yieldapprox 1.81%
The differential is approx 2.21% (high) and has caused the Yen to sell off (Futures price down).
Monetary Divergence. A break of the Yen's consolidation suggests either a continuation of this divergence (Yen weakness) or a major shift in global risk flows (Yen strength), which historically has a positive correlation with gold (and thus silver), as both are considered safe-haven assets.

Rapid ORB Pro- Hyper PrecisionWe received this signal on 6J yesterday.
We waited for price to revisit the level, and our indicator delivered a hyper-precise confirmation exactly as expected.
A full video tutorial is coming soon on our channel, where we will reveal how to use this indicator and extract maximum value from it.

Japan is at a Policy Crossroads, Yen Offers a GuideThe Japanese Yen is echoing memories of last year when monetary policy clashed with fiscal policy. A recent shift in the Japanese government has led to a divergence between the country’s fiscal policy and its monetary policy. This has triggered a collapse in the Yen, driving it 6% lower over the past 2 months.
However, with the Yen approaching previous intervention levels and BOJ action, the possibility of a sharp reversal is rising.
The Clash of Fiscal and Monetary Policy
Japan’s central bank and government are diverging sharply, with BOJ turning hawkish while the new Japanese government paves a dovish path.
In the October policy meeting, 8 of 13 BOJ board members argued that conditions for a near-term rate hike were in place.
While Governor Ueda initially stated that the BoJ would look towards the spring wage negotiations before deciding on a rate hike, recent BoJ member statements signal that this may be shifting. Further, labor unions recently stated that they will push for bumper hikes.
After ending a decade of ultra-easy policy only last year – lifting the short-term rate to 0.5% in January – the BOJ is now widely expected to tighten further soon. Recent trends suggest that this may take place in the very near term, perhaps over the next 2 meetings – in December or January.
By contrast, Prime Minister Sanae Takaichi’s new government is pursuing an aggressively expansionary fiscal path. In November, it approved a JPY 21.3 trillion stimulus package – Japan’s largest since the pandemic – including JPY 17.7 trillion in spending and JPY 2.7 trillion in tax cuts. We covered this in a previous note in detail.
As fiscal policy clashes with monetary policy, the yen has slid to 10-month lows, and long-term JGB yields jumped to multi-year highs. Loose fiscal policy in Japan runs the risk of straining Japan’s already strained debt levels and clashing with the monetary policy and rising bond yields that make the additional debt cost even higher.
These developments have sent Japanese bond yields sharply higher. Conditions in the JGB markets could get even worse due to a dangerous feedback loop between weak auctions and rising yields as stated by economists at MUFG.
The yen is a flashpoint in this scenario. USD/JPY has dropped to levels not seen since the start of the year, perilously close to the USD/JPY rate of 160 that previously saw authorities step in with currency intervention in July 2024.
Source: CME CVOL
With yen option implied volatility still low and hedged positions light, the FX market seems ready to test authorities again. Notably, past episodes offer a cautionary tale: when the BOJ last tightened amid a weak yen, the currency rebounded sharply.
For example, in July 2024, the BOJ raised rates to 0.25% in tandem with the government’s yen-buying intervention, and the yen subsequently jumped from its lows. Today’s near-intervention yen levels and Fed-distorted currency flows could set the stage for a similar outcome. A BOJ move might quickly trigger significant yen appreciation and a repricing of risk, echoing the past.
Options markets are suggesting early signals of participants positioning for such a move, with a recent buildup in call positions over the past week in the December contract.
Source: CME QuikStrike
BOJ to Follow Fed Action in December
Source: CME FedWatch
The other side of the USD/JPY pair is the dollar – which has recently seen its own rollercoaster. In October, market expectations of a rate cut by the Fed in December were high. Those expectations shifted rapidly to signal a hold, but are now back to signaling a rate cut.
This is crucial as Yen positioning is heavily impacted by the Yen carry trade which relies on the yield differential between the US and Japan. A rate cut will reduce this differential and support the Yen. While uncertainty on both Fed and BoJ remain, an action by both central banks – a rate hike by the BoJ and a rate cut by the Fed could together provide ample support to the Yen and override the uncertainty related to the fiscal policy.
It is important to note that the December FOMC meeting takes place one week before the BoJ meeting, so any BoJ action in December may factor in the Fed’s decision. A reasonable compromise for the BoJ may be to delay a hike if the Fed chooses to cut rates. This scenario would lead to the conservative scenario in the chart above.
Historical Trade Setup
The current juncture recalls mid-2024. Then, a weak yen and rising yields prompted a swift BOJ hike and intervention, which quickly reversed currency moves and repriced bond risk. In plain terms, the clash of loose fiscal and tighter monetary stances is a dangerous mix. If history is any guide, a near-term BoJ hike in this environment could lead to an abrupt yen rally (testing the previous intervention band) and renewed stress in the JGB market.
At the same time, new risks are materializing for the Yen that could lead performance to diverge from historical trends.
Entry: 0.006394
Exit: 0.007035
Profit at Exit: 0.000641 x 12,500,000 = USD 8,012.50
Max Drawdown: 0.006242
Loss at Max Drawdown: 0.000152 x 12,500,000 = -USD 1,900
Traders could also express this view using the Micro JPY/USD contract which provides exposure to 1/10th the size of the full contract.
This content is sponsored.
MARKET DATA
CME Real-time Market Data helps identify trading set-ups and express market views better. If you have futures in your trading portfolio, you can check out on CME Group data plans available that suit your trading needs at tradingview.com/cme.
DISCLAIMER
This case study is for educational purposes only and does not constitute investment recommendations or advice. Nor are they used to promote any specific products, or services.
Trading or investment ideas cited here are for illustration only, as an integral part of a case study to demonstrate the fundamental concepts in risk management or trading under the market scenarios being discussed. Please read the FULL DISCLAIMER the link to which is provided in our profile description.

JPY collapse loading?The yen is entering a phase of maximum turbulence: deteriorating fundamentals, a deeply asymmetric options market, a sell-side community unanimously targeting 160+ on spot, and Japanese authorities trapped in a rhetoric-heavy but action-light stance. Full breakdown below.
Fundamental Analysis
The fundamental backdrop for the yen remains clearly tilted toward sustained weakness, as the previously dominant FED-cut/BOJ-hike narrative loses traction.
The Bank of Japan continues to adopt an extremely cautious posture, with an even more accommodative tilt reinforced by recent signals from the Takaichi government. At the same time, expectations for another Fed rate cut in 2025 keep diminishing, with markets increasingly pricing a December hold. This shift removes one of the few supportive angles for the yen and re-anchors monetary policy divergence in favour of the US dollar.
Japanese authorities have intensified their verbal intervention to one of the highest levels seen in recent years. However, this escalation has not altered the market’s dominant assumption: no real intervention before USD/JPY reaches 160. Official warnings about “speculative moves” have done little to curb investor appetite, as market participants openly test policymakers’ tolerance levels. The lack of coherence between the Ministry of Finance’s alarmist tone and the absence of concrete action only strengthens this perception.
Portfolio flows also work against the yen. Japanese institutional investors continue to prioritise foreign asset allocation, keeping the basic balance in a structurally negative position. This persistent capital outflow acts as a continuous fundamental headwind.
Overall, the macro pressure remains aligned against the yen, anchored by a remarkably unfavourable policy differential. The Bank of Japan shows very few signs of preparing meaningful tightening. Conversely, the Fed is increasingly perceived as maintaining restrictive policy longer than anticipated. The probability of a rate cut in December 2025 keeps fading, reinforcing the baseline scenario of the federal funds corridor staying within 375–400 bps. This environment structurally sustains the dollar’s yield advantage, making any durable yen rebound difficult to justify without a major policy shift from Tokyo.
Technical Analysis
On the technical front, the yen is breaking support levels one after another without hesitation, heading back toward the annual lows recorded in January.
If momentum accelerates further, the next major support sits around 0.00625, a level already tested unsuccessfully in July 2024. A clean break below this threshold would likely open the path toward even lower levels, given the lack of meaningful historical congestion zones below it.
Sentiment Analysis
Among FX/CFD brokers, retail traders, who typically sell into rallies, are unsurprisingly heavily short USD/JPY, and thus long yen, with approximately 70% of positions betting on a reversal.
With the CFTC COT report still unavailable due to the US government shutdown, sell-side positioning provides valuable insight. Major FX banks remain strongly aligned on a bearish JPY narrative, with consensus calling for further gains in USD/JPY toward 158.90, 160, and even 161.96.
JP Morgan states that it is “hard to be anything other than short JPY,” recommending bearish positioning through options to better capture potential acceleration. Bank of America also maintains a structurally negative view on the yen, citing an overly cautious BOJ, a government inclined toward looser policy, and persistent capital outflows. Crédit Agricole notes that intervention rhetoric is at extremely elevated levels but stresses that markets remain largely unbothered by the possibility of real action below 160.
The broad takeaway: positioning, narratives, and institutional sentiment overwhelmingly favour further yen weakness.
CME Options Analysis
The open-interest heatmap highlights a markedly unbalanced structure confirming the market’s bearish bias on the yen.
The largest concentrations lie in put options at strikes below current levels, particularly at 0.00625 and 0.0062. These clusters, amounting to several thousand contracts, signal investors are either hedging against or actively positioning for another leg of USD strength versus JPY. Meanwhile, the absence of significant call volumes above market prices confirms the lack of any meaningful option barrier that would support a yen rebound.
This configuration underscores clear asymmetry: markets view continued yen depreciation as the more probable path and appear increasingly wary of a sharp downward break.
Trade Idea
Friday’s mild pullback (21/11) offers an entry opportunity for short exposure on the 6JZ5 contract, with 0.00625 and potentially 0.0062 as targets. A daily close above 0.006575 would invalidate the scenario.
Final Thoughts
The market continues to test the patience of the Japanese Ministry of Finance, yet without credible action from either the BOJ or the government, little resistance seems capable of blocking the dollar’s advance against the yen. Positioning, options structures, and flow dynamics all heavily support continuation, where each consolidation appears more like a pause within a structural trend than the start of a reversal.
The key risk now is the prospect of a delayed but forceful reaction from Tokyo should the situation become disorderly.
---
When charting futures, the data provided could be delayed. Traders working with the ticker symbols discussed in this idea may prefer to use CME Group real-time data plan on TradingView: tradingview.com/cme/ .
This consideration is particularly important for shorter-term traders, whereas it may be less critical for those focused on longer-term trading strategies.
General Disclaimer:
The trade ideas presented herein are solely for illustrative purposes forming a part of a case study intended to demonstrate key principles in risk management within the context of the specific market scenarios discussed. These ideas are not to be interpreted as investment recommendations or financial advice. They do not endorse or promote any specific trading strategies, financial products, or services. The information provided is based on data believed to be reliable; however, its accuracy or completeness cannot be guaranteed. Trading in financial markets involves risks, including the potential loss of principal. Each individual should conduct their own research and consult with professional financial advisors before making any investment decisions. The author or publisher of this content bears no responsibility for any actions taken based on the information provided or for any resultant financial or other losses.

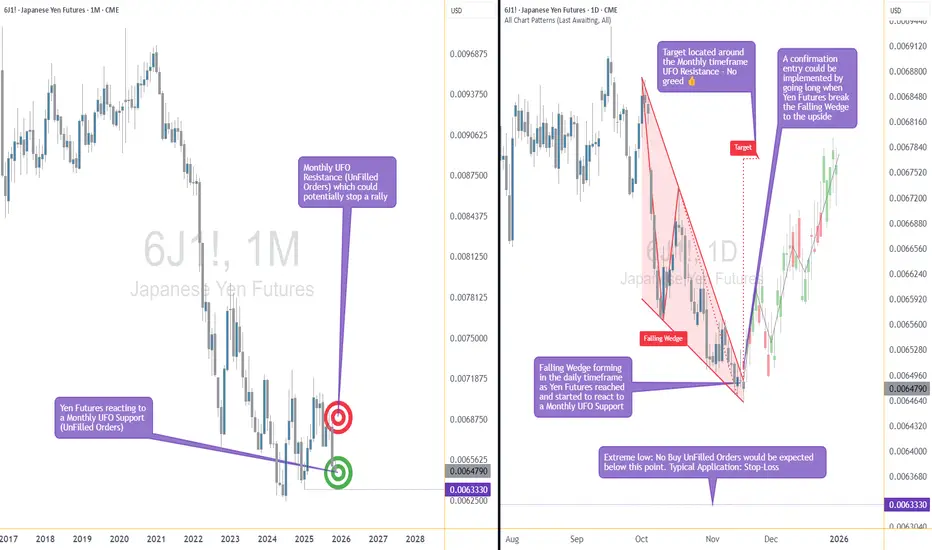
The Support Zone That Refused To Be IgnoredSome chart zones whisper. This one practically waved its arms.
Price slid right into a hefty support area on the higher timeframe… and suddenly started behaving like it had forgotten how to move lower. Classic clue.
Zoom in, and the daily chart shows price squeezing itself into a falling wedge — the market’s equivalent of someone pacing in a hallway, unsure whether to sit down or sprint. Sellers kept trying to push prices lower, but each attempt had less conviction than the last.
When you stack those two pieces together — a big support zone from the monthly chart and a daily pattern running out of room — things start to get interesting. Not predictive, just… interesting.
A breakout above the wedge (around 0.0065030) would basically say, “Alright, I’m done compressing.”
A stop tucked below the lower support range (roughly 0.0063330) keeps the scenario clean.
And a structural projection toward 0.0067695 gives the idea a tidy endpoint if momentum decides to stretch its legs.
Of course, leverage cuts both ways, and traders working with the standard or micro contracts often choose size based on how much room they want between entry and invalidation. When traders choose between the standard and micro versions of this market, it usually comes down to scale. The bigger contract represents 12,500,000 units of the underlying with a $6.25 tick, while the micro mirrors the behavior at 1,250,000 units with a $1.25 tick. Estimated margins also differ — roughly $2,800 for the larger contract and about $280 for the micro. Same chart logic, just two very different footprints on the account.
The real takeaway? When a major zone teams up with a compression pattern, it’s usually worth paying attention. Maybe it leads to a beautiful breakout. Maybe it fizzles. But structurally, this is one of those “save the screenshot” moments.
And whatever the outcome, risk management keeps the whole thing sensible — size smartly, define failure points, and let the chart prove itself instead of assuming it will.
Want More Depth?
If you’d like to go deeper into the building blocks of trading, check out our From Mystery to Mastery trilogy, three cornerstone articles that complement this one:
🔗 From Mystery to Mastery: Trading Essentials
🔗 From Mystery to Mastery: Futures Explained
🔗 From Mystery to Mastery: Options Explained
When charting futures, the data provided could be delayed. Traders working with the ticker symbols discussed in this idea may prefer to use CME Group real-time data plan on TradingView: www.tradingview.com - This consideration is particularly important for shorter-term traders, whereas it may be less critical for those focused on longer-term trading strategies.
General Disclaimer:
The trade ideas presented herein are solely for illustrative purposes forming a part of a case study intended to demonstrate key principles in risk management within the context of the specific market scenarios discussed. These ideas are not to be interpreted as investment recommendations or financial advice. They do not endorse or promote any specific trading strategies, financial products, or services. The information provided is based on data believed to be reliable; however, its accuracy or completeness cannot be guaranteed. Trading in financial markets involves risks, including the potential loss of principal. Each individual should conduct their own research and consult with professional financial advisors before making any investment decisions. The author or publisher of this content bears no responsibility for any actions taken based on the information provided or for any resultant financial or other losses.


A High-Impact Support Zone Meets a Breakout StructureIntroduction
Markets occasionally compress into areas where structure, momentum, and historical buying pressure align with surprising precision. When that compression occurs at a major higher-timeframe floor, traders often pay closer attention—not because the future is predictable, but because the chart reveals a location where price behavior typically becomes informative.
The current case study centers on a market pressing into a high-impact support zone visible on the monthly chart, while the daily chart displays a falling wedge pattern that has gradually narrowed the range of movement. This combination often highlights moments where the auction process is nearing a decision point. The purpose here is to dissect that confluence using multi-timeframe structure, pattern logic, and broad order-flow principles—strictly for educational exploration.
Higher-Timeframe Structure (Monthly)
The monthly chart shows price approaching a well-defined support area between 0.0065425 and 0.0063330, a region that has acted in the past as a base for significant reactions. These areas often develop because markets rarely absorb all buy interest in a single pass; pockets of unfilled orders may remain, leading to renewed reactions when price returns.
This type of zone does not guarantee a reversal. However, historically, when price reaches such levels, traders tend to monitor whether selling pressure slows or becomes less efficient. In this case, the structure suggests a recurring willingness from buyers to engage at these prices, forming a foundation that has held multiple swings.
The presence of a clear, higher-frame resistance at 0.0067530 anchors the broader range. When price rotates between such boundaries, the monthly context often acts as a roadmap: major support below, major resistance above, and room in between for tactical case-study exploration.
Lower-Timeframe Structure (Daily)
Shifting to the daily chart, price action has carved a falling wedge, a pattern often associated with decelerating downside movement. In wedges, sellers continue to push price lower, but with diminishing strength, as each successive low becomes less effective.
This type of compression structure can provide early evidence that the auction is maturing. Traders studying such patterns often watch for:
tightening of the range,
shorter waves into new lows,
initial signs that buyers are defending intraday attempts to drive price lower.
The daily wedge in this case sits directly on top of the monthly support zone—an alignment that strengthens its analytical relevance. The upper boundary of the wedge sits near 0.0065030, and a break above that line is often interpreted as price escaping the compression phase.
Multi-Timeframe Confluence
Multi-timeframe confluence arises when higher-frame structure provides the background bias and lower-frame patterns offer the tactical trigger. In this case:
The monthly chart signals a historically responsive support zone.
The daily chart shows structural compression and slowing downside momentum.
The interaction between them creates a scenario where educational case studies tend to focus on breakout behavior, as the daily timeframe may provide the first evidence that higher-frame buyers are engaging.
This confluence does not imply certainty. It simply highlights a location where structure tends to become more informative, and where traders often study the transition from absorption to response.
Order-Flow Logic (Non-Tool-Specific)
From an order-flow perspective, strong support zones typically develop where prior buying activity left behind unfilled interest. When price returns to that region, two things often happen:
Sellers begin to encounter difficulty driving price lower, as remaining buy orders absorb their activity.
Compression patterns form, as the market oscillates in a tightening range while participants test whether enough liquidity remains to cause a directional shift.
A breakout of the daily wedge represents a potential change in the auction dynamic. While sellers are still active inside the wedge, a breakout suggests their pressure may have become insufficient to continue the sequence of lower highs and lower lows. Traders studying market transitions often use such moments as part of hypothetical scenarios to understand how imbalances evolve.
Forward-Looking Trade Idea (Illustrative Only)
For educational purposes, here is how a structured case study could frame a potential opportunity using the discussed charts:
Entry: A hypothetical entry could be placed above the falling wedge, around 0.0065030, once buyers demonstrate the ability to break outside the compression structure.
Stop-Loss: A logical invalidation area in this case study would be at or below the monthly support, around 0.0063330, where failure would indicate the higher-timeframe zone did not hold.
Target: A purely structural wedge projection would suggest a target near 0.0067695, aligning closely with the broader resistance region on the monthly chart.
These price points yield a reward-to-risk profile that is measurable and logically linked to structure, though not guaranteed. This case study exists solely to illustrate how support-resistance relationships and pattern logic can be combined into a coherent, rules-based plan, not as an actionable idea for trading.
Yen Futures Contract Context
The larger (6J) and micro-sized (MJY) versions of this futures market follow the same underlying price but differ in exposure and margin scale. The standard contract generally carries a greater notional value and therefore translates each price movement into a larger monetary change. The micro contract mirrors the same structure at a reduced size, allowing traders to adjust position scaling more precisely when navigating major zones or breakout structures such as the one discussed in this case study:
6J equals 12,500,000 Japanese Yen per contract, making it suitable for larger, institutional players. (1 Tick = 0.0000005 per JPY increment = $6.25. Required Margin = $2,800)
MJY equals 1,250,000 Japanese Yen per contract, making it suitable for larger, institutional players. (1 Tick = 0.000001 per JPY increment = $1.25. Required Margin = $280)
Understanding margin requirements is essential—these products are leveraged instruments, and small price changes can result in large percentage gains or losses.
Risk Management Considerations
Strong support zones can attract interest, but risk management remains the foundation of any structured approach. Traders studying these transitions typically:
size positions relative to the distance between entry and invalidation,
maintain clear exit criteria when structure fails,
avoid adjusting stops unless the market has invalidated the original reasons for the plan,
adapt to new information without anchoring to prior expectations.
These principles emphasize the importance of accepting uncertainty. Even at major support zones, markets can remain volatile, and scenarios may unfold differently than anticipated.
When charting futures, the data provided could be delayed. Traders working with the ticker symbols discussed in this idea may prefer to use CME Group real-time data plan on TradingView: www.tradingview.com - This consideration is particularly important for shorter-term traders, whereas it may be less critical for those focused on longer-term trading strategies.
General Disclaimer:
The trade ideas presented herein are solely for illustrative purposes forming a part of a case study intended to demonstrate key principles in risk management within the context of the specific market scenarios discussed. These ideas are not to be interpreted as investment recommendations or financial advice. They do not endorse or promote any specific trading strategies, financial products, or services. The information provided is based on data believed to be reliable; however, its accuracy or completeness cannot be guaranteed. Trading in financial markets involves risks, including the potential loss of principal. Each individual should conduct their own research and consult with professional financial advisors before making any investment decisions. The author or publisher of this content bears no responsibility for any actions taken based on the information provided or for any resultant financial or other losses.
Japanese Yen Consolidates Near Critical SupportFenzoFx—Japanese Yen is consolidating near 0.0065 after the price slightly gapped below this level on Monday. This level has further support from the lower line of the bearish channel.
The primary trend is bearish. However, the currency is oversold. Therefore, a consolidation toward higher resistance levels is expected before the downtrend resumes. In this scenario, JPY could tap into the liquidity void at 0.0066. This level can provide a premium price to sell JPY against other major currencies such as GBP and EUR.

USDJPY LONG (JPYUSD SHORT)1300 PIPS!Looks like a strong short setup with a clean retest under institutional level structure, bearish weekly bias confirms downside probable move, valid.

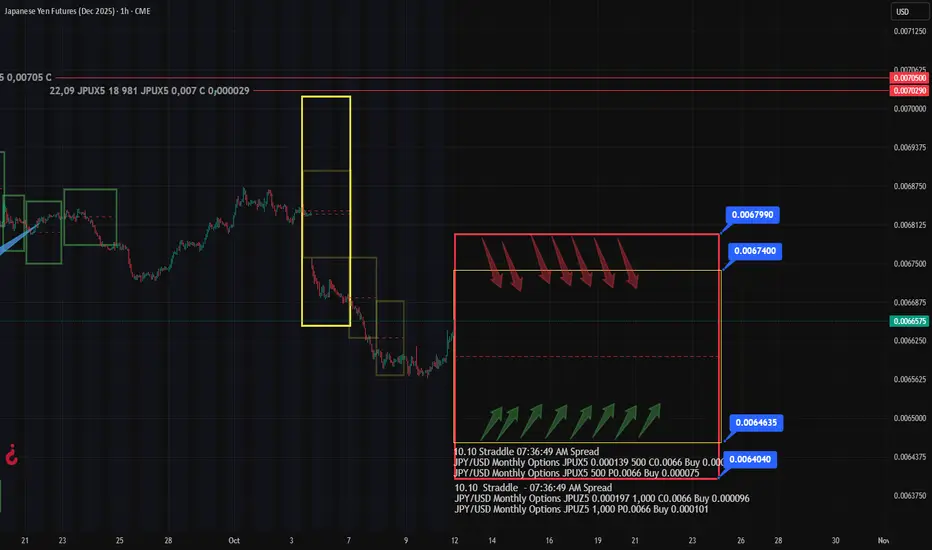
JPY Analysis & Outlook: Friday’s Options Flow Tells the StoryFriday’s trading on the options market revealed two key developments in JPY:
🔸 Two Straddles appeared in the current front-month expiry series
Plus a mid-sized Call Spread near 0.00675
Upper boundaries: 0.00674 and 0.006799 (marked on chart)
🔍 Key Takeaways:
Option traders are positioning likely for a correction in JPY futures after last week’s sharp drop.
But, Straddle isn’t a directional bet — it’s a volatility play with structure.
Call Spread is a a directional bet
As usual, when price approaches either Straddle boundary, option players will likely convert positions into synthetic calls or puts, reinforcing these levels as BE zones.
🎯 Strategic Levels:
0.00674 – 0.006799 → Potential resistance zone in the medium term
But here’s what’s interesting:
If you apply a Fibonacci retracement tool, the 61.8% level aligns almost perfectly with one of the already marked Straddle levels.
That kind of confluence?
It could attract additional downside liquidity from traders using Fib grids — especially those selling into "expected" reversal zones.
Is it a coincidence?
Sure, probably 😉
When the Yen Fell Out of Bed — And Time Picked It Up1. Yen Drama at the Open 🎭
The Japanese Yen Futures (6J) woke up after the weekend and immediately faceplanted into the lower Bollinger Band®. Big gap, lots of noise — the classic “what just happened?” moment.
Now, that gap around 0.0068 might just invite a mean reversion, because markets love to clean up after their weekend messes. Instead of chasing direction, we’ll let time do the heavy lifting.
2. The Strategy — A Time-Based Power Nap 😴
We’re running a Horizontal Call Spread (Calendar Spread) — same strike, different expiration dates:
Buy Nov 7 Call @ 0.00680
Sell Oct 24 Call @ 0.00680
You’re basically saying: “Hey, Yen, take your time — but drift a little upward, okay?”
If price chills near 0.0068, theta decay works for us. If it crashes again, we lose just our debit. Simple, elegant, zen.
3. Quick Specs (Because You’re Smart) 💡
Contract size: 12,500,000 Yen
Tick value: $6.25 (0.0000005)
Margin: ≈ $2,800 (outright futures)
Calendar Spread Risk = $237.50 debit
Setup target: gap-fill near 0.0068+
Risk is capped, reward potential roughly 3:1, and all you need is a calm market — not a hero move.
4. The Trader’s Zen Moment 🧘
This setup wins if price stabilizes and time passes — that’s it.
You’re not fighting the market; you’re getting paid for waiting.
While others panic, you’re sipping tea, letting theta do the work.
5. Takeaway 🍵
Gaps often fill.
Time spreads love calm markets.
Less stress, more logic.
Sometimes, the best move in trading is to stop anticipating — and start aging gracefully with your positions.
Want More Depth?
If you’d like to go deeper into the building blocks of trading, check out our From Mystery to Mastery trilogy, three cornerstone articles that complement this one:
🔗 From Mystery to Mastery: Trading Essentials
🔗 From Mystery to Mastery: Futures Explained
🔗 From Mystery to Mastery: Options Explained
When charting futures, the data provided could be delayed. Traders working with the ticker symbols discussed in this idea may prefer to use CME Group real-time data plan on TradingView: www.tradingview.com - This consideration is particularly important for shorter-term traders, whereas it may be less critical for those focused on longer-term trading strategies.
General Disclaimer:
The trade ideas presented herein are solely for illustrative purposes forming a part of a case study intended to demonstrate key principles in risk management within the context of the specific market scenarios discussed. These ideas are not to be interpreted as investment recommendations or financial advice. They do not endorse or promote any specific trading strategies, financial products, or services. The information provided is based on data believed to be reliable; however, its accuracy or completeness cannot be guaranteed. Trading in financial markets involves risks, including the potential loss of principal. Each individual should conduct their own research and consult with professional financial advisors before making any investment decisions. The author or publisher of this content bears no responsibility for any actions taken based on the information provided or for any resultant financial or other losses.

Japanese Yen Sharp SelloffOver the last few months, there has been a narrative that many currencies around the world have been bouncing to the upside because of the weakness in the Dollar, and that may be changing in the short term looking at the Japanese Yen futures. Over the last 4 trading days, the contract has dropped significantly falling below the 50-day moving average and the 200-day moving average, and the 200-day moving average has acted as a “floor” in the market where buyers have stepped in since it crossed over it in February. The market also broke below a trendline that goes back to January and has drawn a lot of attention from traders across the globe.
There were a few reasons why this market may have broken to the downside, and through significant levels, and the first one has been the general strength in the Dollar over the past few days which has been boosted by rising treasury yields in the U.S. Outside of Dollar strength, there has been a political shift in Japanese leadership where it is expected that there will be more aggressive government spending which would hurt the currency market relative to the Dollar. Although the market has seen the drop significantly lower, the relative strength on a daily basis remains in neutral territory and is trading well above the low for the year, so traders will be keeping an eye for continued selling pressure if strength in the Dollar continues.
If you have futures in your trading portfolio, you can check out on CME Group data plans available that suit your trading needs tradingview.com/cme/
*CME Group futures are not suitable for all investors and involve the risk of loss. Copyright © 2023 CME Group Inc.
**All examples in this report are hypothetical interpretations of situations and are used for explanation purposes only. The views in this report reflect solely those of the author and not necessarily those of CME Group or its affiliated institutions. This report and the information herein should not be considered investment advice or the results of actual market experience.

Options Blueprint Series [Advanced]: Gap Fill Time Spread Play1. The Market Context — Yen’s Weekend Gap and Mean Reversion Setup
The Japanese Yen futures (6J) reopened after the weekend with an aggressive downside gap, immediately catching the eye of volatility traders. Gaps of this nature are often emotional reactions to global macro news or overnight FX shifts — yet, when structural levels like the Bollinger Band lower boundary are involved, traders begin to anticipate a mean reversion rather than continued momentum.
This is exactly what we see on 6J:
Price plunged into the lower Bollinger Band, finding temporary balance near 0.0067+, while the middle band — representing the 20-period mean — sits around 0.0068+. The gap above remains open, and that area coincides with the Bollinger mean, creating a convergence between technical equilibrium and market memory.
Historically, the Yen tends to exhibit mean reversion behavior after outsized weekend gaps, as liquidity normalizes. That statistical tendency does not guarantee results, but it provides the foundation for a non-directional strategy applied with a slight directional bias — exactly where options on futures can shine.
2. Strategy Rationale — A Non-Directional Tool Used Directionally
Instead of a pure directional play (like buying calls), we opt for a Horizontal Call Spread — also known as a Calendar Spread or Time Spread — positioned around the 0.00680 strike. This structure allows us to express a view on time and volatility, rather than raw price movement.
Objective: capture a modest recovery or stabilization near 0.0068
Approach: profit from time decay and implied volatility behavior as the front option (short leg) loses value faster than the back month (long leg)
Outcome: defined risk, limited exposure to violent swings, and a smoother equity curve
In essence, we’re using a non-directional strategy (time-based) in a slightly directional context (mean reversion target) — a powerful way to let the clock, not the market, do most of the work.
3. Constructing the 6J Horizontal Call Spread
Let’s break it down with specific contracts:
Buy Nov 7 Call (0.00680 strike)
Sell Oct 24 Call (0.00680 strike)
This combination forms a calendar spread, where both options share the same strike but different expirations. The trade is initiated for a net debit, meaning we pay a small premium upfront for the position.
Mechanics
As time passes, the shorter-dated Oct 24 call decays faster.
If price drifts toward the 0.0068 area by the front expiry, the short leg expires near-the-money (or worthless), while the back-month call retains time value.
The spread expands — producing the ideal outcome.
The position benefits from stabilization, controlled volatility, and time decay alignment — instead of needing a directional surge.
Greeks behave in a nuanced way:
Theta: positive near the target zone
Vega: long volatility — the position gains if implied volatility rises in the back month
Delta: small positive exposure (mild bullish tilt)
That’s the “slightly directional” essence of this setup — time-sensitive, but gently leaning toward a gap-fill move.
4. Chart Perspective — The Technical Catalyst
The Bollinger Bands® tell the story clearly.
Lower band: 0.00672 → recent test zone
Mean (20-period average): 0.00681 → target
Upper band: 0.00690 → secondary resistance
The weekend gap remains unfilled, overlapping perfectly with the Bollinger mean.
Should price gravitate back toward equilibrium, the spread reaches its best reward zone as Oct 24 time decay accelerates.
5. Risk Management — Structuring Control, Not Hope
Every options trade begins with a cost — the net debit — which defines maximum risk. This makes the horizontal spread particularly appealing in uncertain environments.
Here’s the structured approach:
Entry zone: 0.0067+ area or below the lower Bollinger Band
Target zone: 0.0068+ (Bollinger mean & partial gap fill)
Stop: below 0.0066575 (recent intraday swing), or no stop at all since the options strategy provides a limited risk natively.
That defines a maximum reward-to-risk ratio of roughly 3:1 when measured against time decay and expected mean reversion distance.
It’s also crucial to track macro catalysts. The Yen can react sharply to U.S. yields or Bank of Japan policy headlines. Avoid holding this position through major FX events if volatility spikes uncontrollably — horizontal spreads work best in stable-to-moderate volatility environments.
Lastly, avoid scaling without liquidity awareness. 6J options are institutionally liquid, but ensure bid–ask stability during execution.
6. CME Context — Contract Specs
Understanding contract size and margin requirements is essential before structuring any options-on-futures strategy.
Contract size: 12,500,000 Japanese Yen
Minimum tick: 0.0000005 USD per JPY
Tick value: $6.25 per contract
Trading hours: Nearly 24-hour access Sunday–Friday
As of recent CME data, the initial margin for the standard 6J futures contract is around $2,800, though this varies with volatility. Traders using options on futures generally post the premium paid as margin (for debit spreads), which in this case is $237.5 (0.000019/0.0000005 x $6.25).
7. Risk, Reward & Realistic Expectations
The goal here is not to “predict” a direction — it’s to position intelligently around time.
A well-constructed calendar spread lets traders participate in short-term stabilization moves with predefined exposure.
If 6J consolidates and slowly lifts toward 0.0068:
The short Oct call decays,
The long Nov retains premium,
The spread widens — success.
If the Yen collapses further or volatility implodes across the curve, losses remain contained to the initial debit — no margin calls, no open-ended risk.
For advanced traders, layering such spreads across correlated expirations can create calendar ladders, offering continuous time exposure while recycling theta — but that’s a topic for another Blueprint.
8. Key Takeaways
Directional calendar spreads can be powerful after emotional gaps.
6J’s gap down plus Bollinger reversion potential creates an interesting time-based setup.
Using non-directional tools directionally provides precision control over risk and exposure.
Proper risk management defines the edge — not prediction accuracy.
This approach emphasizes professional-grade thinking: controlling variables (time, volatility, strike) rather than chasing price movement.
When charting futures, the data provided could be delayed. Traders working with the ticker symbols discussed in this idea may prefer to use CME Group real-time data plan on TradingView: www.tradingview.com - This consideration is particularly important for shorter-term traders, whereas it may be less critical for those focused on longer-term trading strategies.
General Disclaimer:
The trade ideas presented herein are solely for illustrative purposes forming a part of a case study intended to demonstrate key principles in risk management within the context of the specific market scenarios discussed. These ideas are not to be interpreted as investment recommendations or financial advice. They do not endorse or promote any specific trading strategies, financial products, or services. The information provided is based on data believed to be reliable; however, its accuracy or completeness cannot be guaranteed. Trading in financial markets involves risks, including the potential loss of principal. Each individual should conduct their own research and consult with professional financial advisors before making any investment decisions. The author or publisher of this content bears no responsibility for any actions taken based on the information provided or for any resultant financial or other losses.
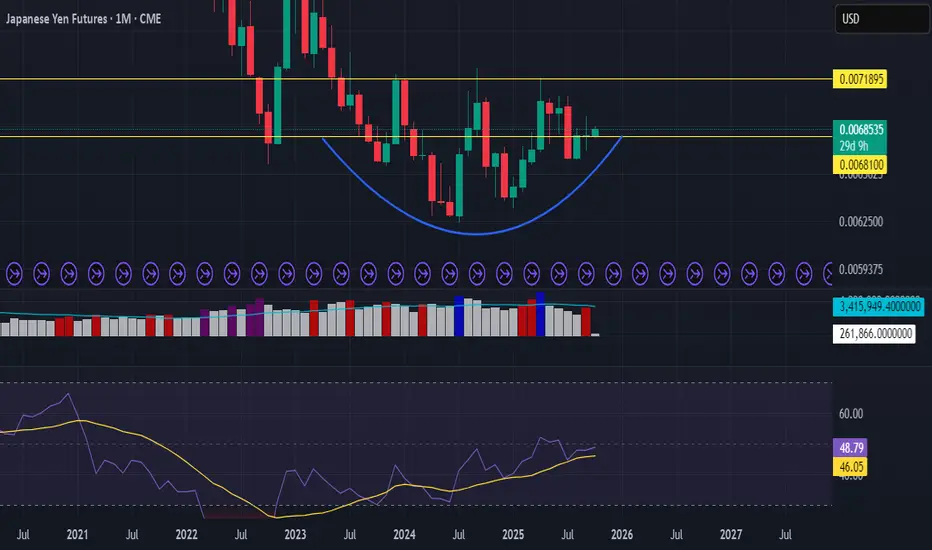
jpy index jpy index make rounding bottom in monthly, so i predict its going more compliqued for usdjpy to make higher hight