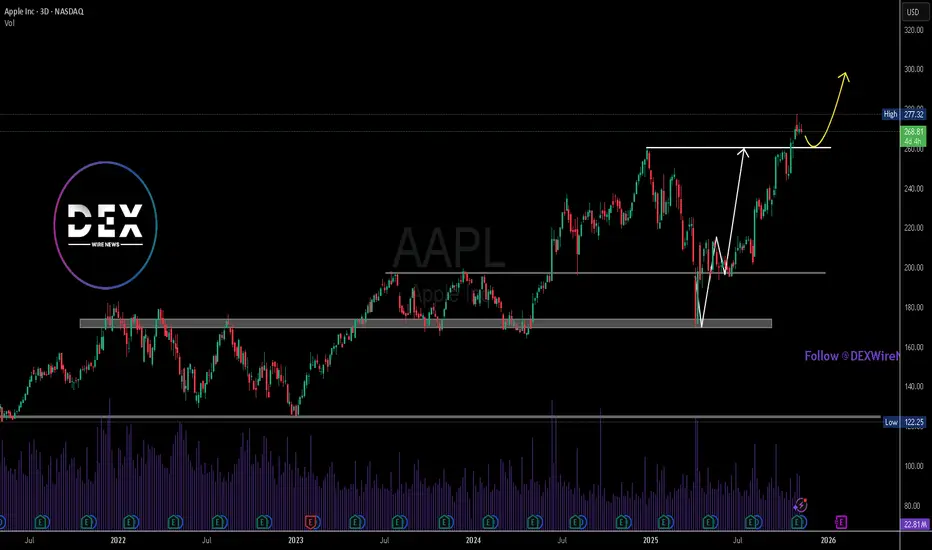
This Time I’m Watching AppleGreetings fellow traders and chart lovers!
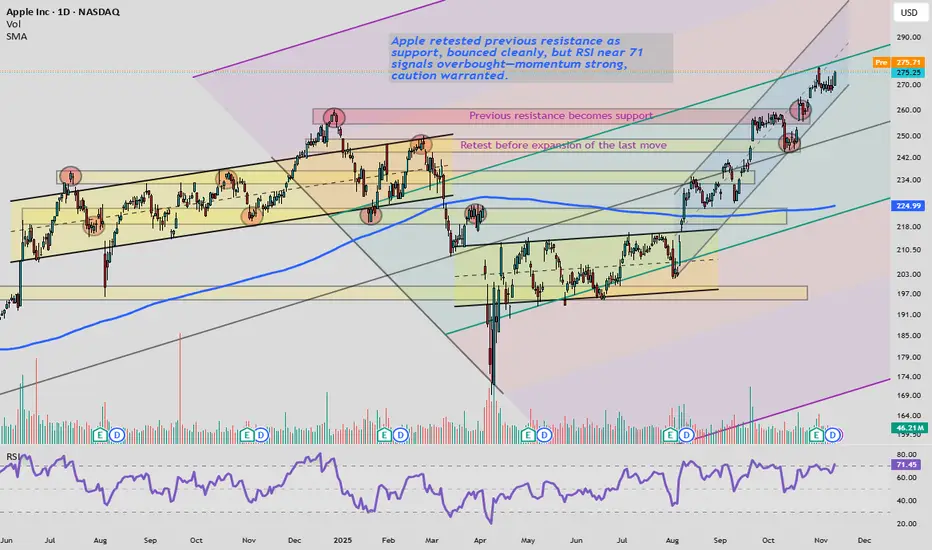
Here’s my updated view on Apple’s long term channel, which remains one of the cleanest trends on the NASDAQ. A perfect example of how patience pays in technical analysis.
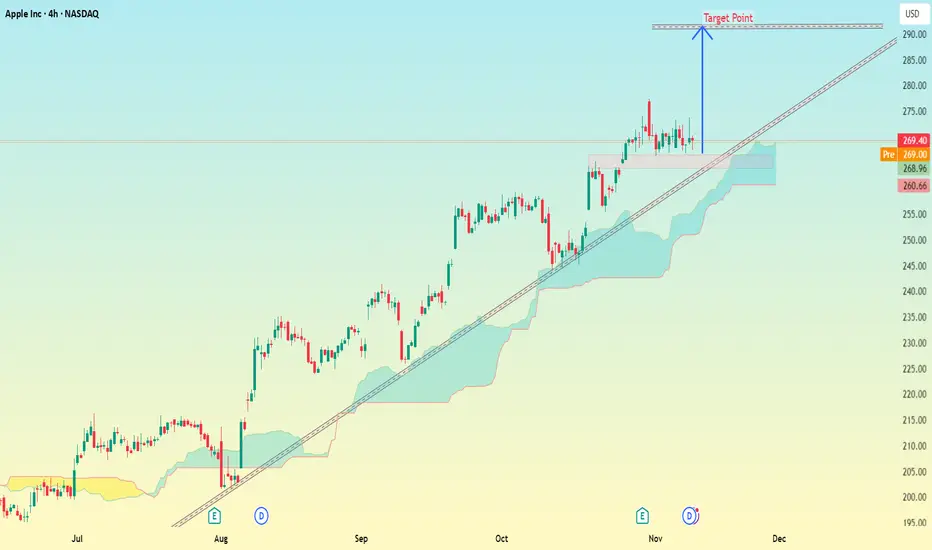
Apple at the Edge: Key Retest Zone Before the Next Big Move 🍏
Apple Inc. (AAPL) has
Key facts today
Next report date
—
Report period
—
EPS estimate
—
Revenue estimate
—
6.40 EUR
95.45 B EUR
354.65 B EUR
14.76 B
About Apple Inc
Sector
Industry
CEO
Timothy Donald Cook
Website
Headquarters
Cupertino
Founded
1976
ISIN
US0378331005
FIGI
BBG000QFTD07
Apple, Inc. engages in the design, manufacture, and sale of smartphones, personal computers, tablets, wearables and accessories, and other varieties of related services. It operates through the following geographical segments: Americas, Europe, Greater China, Japan, and Rest of Asia Pacific. The Americas segment includes North and South America. The Europe segment consists of European countries, as well as India, the Middle East, and Africa. The Greater China segment comprises China, Hong Kong, and Taiwan. The Rest of Asia Pacific segment includes Australia and Asian countries. Its products and services include iPhone, Mac, iPad, AirPods, Apple TV, Apple Watch, Beats products, AppleCare, iCloud, digital content stores, streaming, and licensing services. The company was founded by Steven Paul Jobs, Ronald Gerald Wayne, and Stephen G. Wozniak in April 1976 and is headquartered in Cupertino, CA.
Related stocks

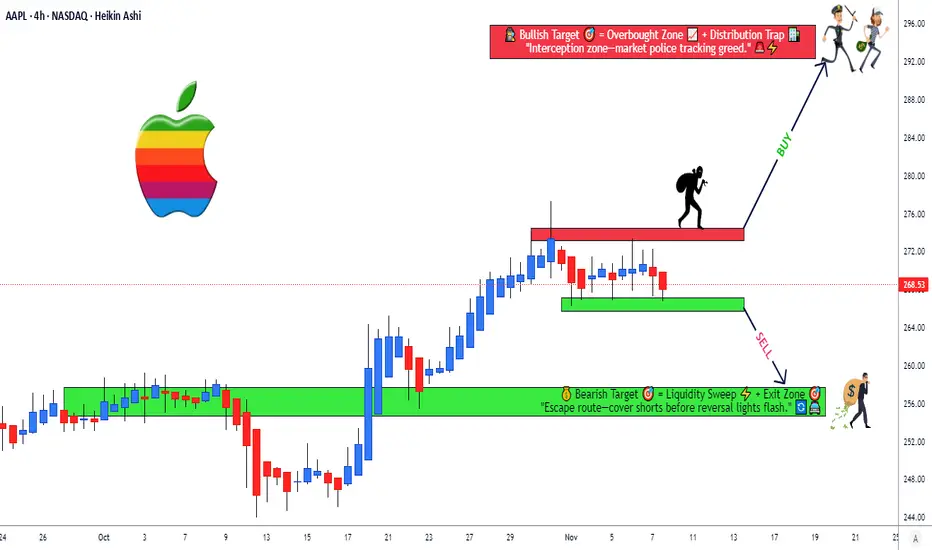
Apple Inc. (AAPL) 4H – NASDAQ chart Pattern...Apple Inc. (AAPL) 4H – NASDAQ chart:
Here’s a detailed read of the setup my drawn 👇
---
🧭 Chart Overview
Current Price: ≈ $269.4
Trend: Strong uptrend (price holding above Ichimoku cloud & rising trendline)
Support Zone: Around $265 – $266 (where price retested the trendline + cloud)
Resista
AAPL Coiling for a Break, Gamma Pressure Tightening. Nov 12-15AAPL has been drifting sideways on the surface, but underneath the calm exterior, the order flow is tightening. The candles look slow, even boring — but the gamma structure behind the scenes is anything but.
Right now, AAPL is sitting inside a highly reactive GEX pocket, and pressure is building for
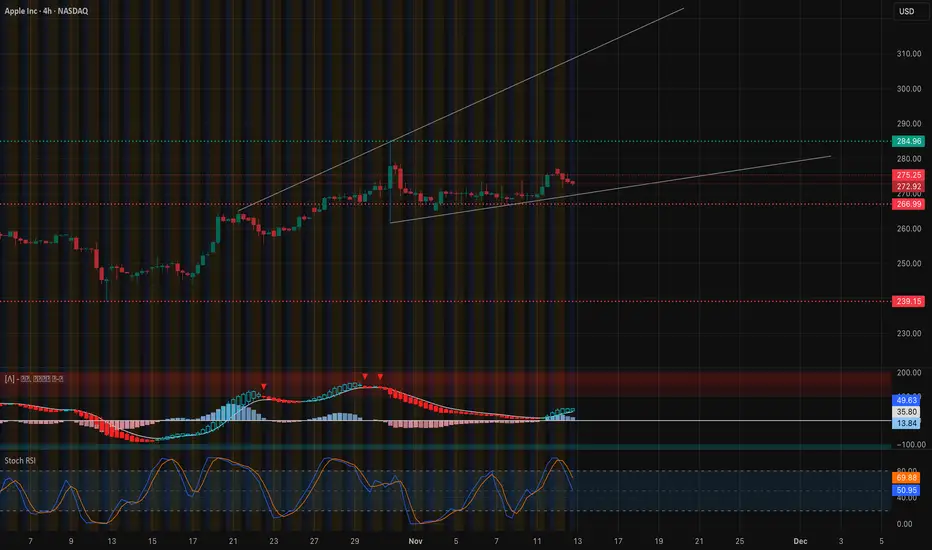
$AAPL bull move above 275Nice 3rd leg potential above 275 for NASDAQ:AAPL of a break down lower if we close below 270
AAPL Retest & Bounce | Overbought but Holding SupportFollow GoldenZoneFX for more content and valuable insights about financial markets.
Apple coming downiPhone dominance is declining
retest zone 260–254 , a retracement
Key Levels to Watch:
🟥 Resistance Trendline: 280–285
🟦 Retest Zone: 260–254
🟩 Support Trendline: 210–220

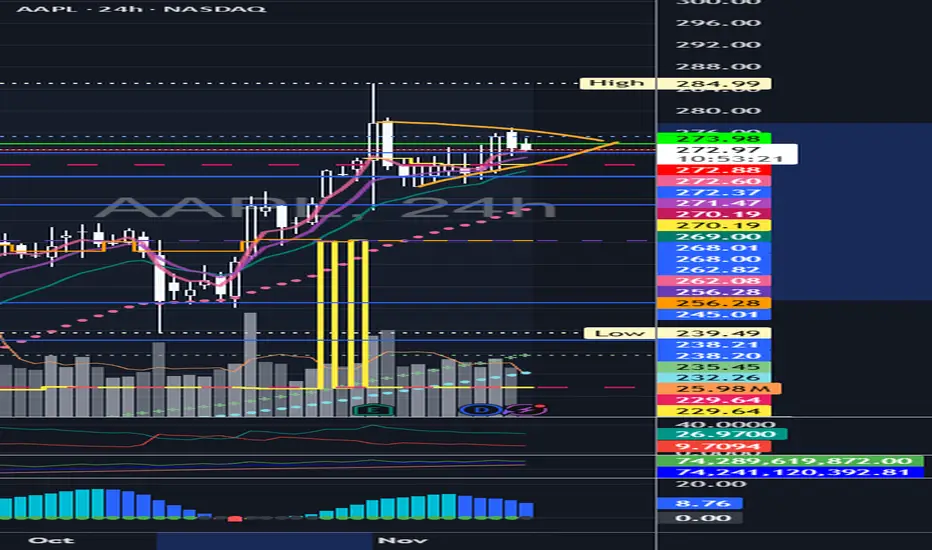
Apple Inc. Swing Setup – Breakout or Breakdown Ahead?🍎 AAPL | Apple Inc. - Swing Trade Profit Blueprint 💰
NASDAQ: AAPL | Breakout Pattern Setup ⚡
Master the Swing Trade Game 🎯
📊 TECHNICAL OVERVIEW
Currently trading at $268.47 with strong momentum indicators aligning for a breakout scenario. Apple is positioned in a critical decision zone with defined
Apple Inc.($AAPL): Morgan Stanley Sees $130B Robotics Potential Apple Inc. (Nasdaq: NASDAQ:AAPL ) stock dipped 0.52% to $268.37 on Friday despite bullish long-term projections from Morgan Stanley. The investment bank’s new report suggests that Apple’s emerging robotics division could generate as much as $130 billion in annual revenue by 2040.
According to the
$AAPL: The Market's Breath | A Contrarian Perspective at a Point"My capital is finite, but opportunity is infinite. I will not risk my finite capital on an 'okay' setup when a perfect one is inevitable. I can miss this move and feel nothing, because the next one is already forming."
This is a core tenet for those of us who aim to trade without limits—not finan
APPLE The Target Is UP! BUY!
My dear friends,
My technical analysis for APPLE is below:
The market is trading on 268.53 pivot level.
Bias - Bullish
Technical Indicators: Both Super Trend & Pivot HL indicate a highly probable Bullish continuation.
Target - 271.24
Recommended Stop Loss - 266.96
About Used Indicators:
A pi

See all ideas
Summarizing what the indicators are suggesting.
Neutral
SellBuy
Strong sellStrong buy
Strong sellSellNeutralBuyStrong buy
Neutral
SellBuy
Strong sellStrong buy
Strong sellSellNeutralBuyStrong buy
Neutral
SellBuy
Strong sellStrong buy
Strong sellSellNeutralBuyStrong buy
An aggregate view of professional's ratings.
Neutral
SellBuy
Strong sellStrong buy
Strong sellSellNeutralBuyStrong buy
Neutral
SellBuy
Strong sellStrong buy
Strong sellSellNeutralBuyStrong buy
Neutral
SellBuy
Strong sellStrong buy
Strong sellSellNeutralBuyStrong buy
Displays a symbol's price movements over previous years to identify recurring trends.
US37833DW7
Apple Inc. 2.65% 11-MAY-2050Yield to maturity
5.42%
Maturity date
May 11, 2050
US37833DQ0
Apple Inc. 2.95% 11-SEP-2049Yield to maturity
5.41%
Maturity date
Sep 11, 2049
APCL
Apple Inc. 3.6% 31-JUL-2042Yield to maturity
5.41%
Maturity date
Jul 31, 2042
US37833ER7
Apple Inc. 4.1% 08-AUG-2062Yield to maturity
5.40%
Maturity date
Aug 8, 2062
US37833EG1
Apple Inc. 2.8% 08-FEB-2061Yield to maturity
5.38%
Maturity date
Feb 8, 2061
US37833EL0
Apple Inc. 2.85% 05-AUG-2061Yield to maturity
5.38%
Maturity date
Aug 5, 2061
US37833EK2
Apple Inc. 2.7% 05-AUG-2051Yield to maturity
5.37%
Maturity date
Aug 5, 2051
US37833EF3
Apple Inc. 2.65% 08-FEB-2051Yield to maturity
5.37%
Maturity date
Feb 8, 2051
US37833EQ9
Apple Inc. 3.95% 08-AUG-2052Yield to maturity
5.35%
Maturity date
Aug 8, 2052
US37833DD9
Apple Inc. 3.75% 12-SEP-2047Yield to maturity
5.35%
Maturity date
Sep 12, 2047
US37833DZ0
Apple Inc. 2.4% 20-AUG-2050Yield to maturity
5.34%
Maturity date
Aug 20, 2050
See all 4AAPL bonds
Curated watchlists where 4AAPL is featured.


Frequently Asked Questions
The current price of 4AAPL is 230.30 EUR — it has decreased by −2.66% in the past 24 hours. Watch Apple Inc. stock price performance more closely on the chart.
Depending on the exchange, the stock ticker may vary. For instance, on EUROTLX exchange Apple Inc. stocks are traded under the ticker 4AAPL.
4AAPL stock has fallen by −1.83% compared to the previous week, the month change is a 7.77% rise, over the last year Apple Inc. has showed a 7.32% increase.
We've gathered analysts' opinions on Apple Inc. future price: according to them, 4AAPL price has a max estimate of 297.68 EUR and a min estimate of 185.51 EUR. Watch 4AAPL chart and read a more detailed Apple Inc. stock forecast: see what analysts think of Apple Inc. and suggest that you do with its stocks.
4AAPL reached its all-time high on Jan 2, 2025 with the price of 255.00 EUR, and its all-time low was 12.60 EUR and was reached on Oct 3, 2013. View more price dynamics on 4AAPL chart.
See other stocks reaching their highest and lowest prices.
See other stocks reaching their highest and lowest prices.
4AAPL stock is 2.74% volatile and has beta coefficient of 1.25. Track Apple Inc. stock price on the chart and check out the list of the most volatile stocks — is Apple Inc. there?
Today Apple Inc. has the market capitalization of 3.47 T, it has increased by 1.09% over the last week.
Yes, you can track Apple Inc. financials in yearly and quarterly reports right on TradingView.
Apple Inc. is going to release the next earnings report on Jan 29, 2026. Keep track of upcoming events with our Earnings Calendar.
4AAPL earnings for the last quarter are 1.58 EUR per share, whereas the estimation was 1.51 EUR resulting in a 4.10% surprise. The estimated earnings for the next quarter are 2.30 EUR per share. See more details about Apple Inc. earnings.
Apple Inc. revenue for the last quarter amounts to 87.32 B EUR, despite the estimated figure of 87.12 B EUR. In the next quarter, revenue is expected to reach 118.37 B EUR.
4AAPL net income for the last quarter is 23.41 B EUR, while the quarter before that showed 19.89 B EUR of net income which accounts for 17.66% change. Track more Apple Inc. financial stats to get the full picture.
Yes, 4AAPL dividends are paid quarterly. The last dividend per share was 0.22 EUR. As of today, Dividend Yield (TTM)% is 0.37%. Tracking Apple Inc. dividends might help you take more informed decisions.
Apple Inc. dividend yield was 0.40% in 2025, and payout ratio reached 13.66%. The year before the numbers were 0.43% and 16.11% correspondingly. See high-dividend stocks and find more opportunities for your portfolio.
As of Nov 18, 2025, the company has 166 K employees. See our rating of the largest employees — is Apple Inc. on this list?
EBITDA measures a company's operating performance, its growth signifies an improvement in the efficiency of a company. Apple Inc. EBITDA is 123.35 B EUR, and current EBITDA margin is 34.78%. See more stats in Apple Inc. financial statements.
Like other stocks, 4AAPL shares are traded on stock exchanges, e.g. Nasdaq, Nyse, Euronext, and the easiest way to buy them is through an online stock broker. To do this, you need to open an account and follow a broker's procedures, then start trading. You can trade Apple Inc. stock right from TradingView charts — choose your broker and connect to your account.
Investing in stocks requires a comprehensive research: you should carefully study all the available data, e.g. company's financials, related news, and its technical analysis. So Apple Inc. technincal analysis shows the neutral today, and its 1 week rating is buy. Since market conditions are prone to changes, it's worth looking a bit further into the future — according to the 1 month rating Apple Inc. stock shows the buy signal. See more of Apple Inc. technicals for a more comprehensive analysis.
If you're still not sure, try looking for inspiration in our curated watchlists.
If you're still not sure, try looking for inspiration in our curated watchlists.