Steady uptrend on eurcadThe trend of this currency pair is generally up, and we expect this trend to remain up and continue its movements within the range of its ascending channel, and we can take good trades in this currency pair.
Trade ideas

EURCAD Set To Grow! BUY!
My dear friends,
Please, find my technical outlook for EURCAD below:
The instrument tests an important psychological level 1.6218
Bias - Bullish
Technical Indicators: Supper Trend gives a precise Bullish signal, while Pivot Point HL predicts price changes and potential reversals in the market.
Target - 1.6231
Recommended Stop Loss - 1.6209
About Used Indicators:
Super-trend indicator is more useful in trending markets where there are clear uptrends and downtrends in price.
Disclosure: I am part of Trade Nation's Influencer program and receive a monthly fee for using their TradingView charts in my analysis.
———————————
WISH YOU ALL LUCK


EURCAD LONG
📈 EURCAD 55m Long Setup – Breakout Continuation in Play
Technical Overview:
EURCAD has confirmed a breakout above descending structure on the 55-minute chart, followed by a clean retest. Price action is supported by bullish divergence on RSI and MACD, with volume expansion signaling institutional interest. EMAs are aligned bullishly, and the corrective phase appears complete.
Trade Parameters:
- Entry: 1.46850
- Stop-Loss: 1.46490 (below structure base and EMA cluster)
- Take-Profit 1: 1.47420 (first resistance zone, fib extension)
- Take-Profit 2: 1.47880 (prior swing high, psychological level)
- Risk/Reward: TP1 ≈ 1:1.58 | TP2 ≈ 1:2.86
- ROI:
- TP1: +158%
- TP2: +286%
Strategic Notes:
This setup qualifies as a Breakout Continuation with high tactical confidence. Ideal for journaling under “Legacy Trades” and dashboarding with CrocoBot or ECLIPS overlays. Consider trailing stop recalibration post-TP1 and tagging this as a conviction trade.
Overlay Ideas:
- Annotate breakout zone with “Retest Confirmed” label
- Deploy impulse tracker module with fib-based TP zones
- Use momentum confirmation toggle (RSI > 55, MACD histogram rising)
- Visual theme: Iron Pulse or Momentum Surge
---
#EURCAD #ForexTrading #BreakoutSetup #TechnicalAnalysis #MomentumDivergence #CrocoBot #ECLIPS #TradingView #ForexSignals #TradeJournal #AnnotatedCharts #TradingStrategy #ForexSetup #SmartMoney #PriceAction #TradingDiscipline #VisualTrading #ForexMentor #FXMomentum #TradingDashboard #ForexPrecision #LegacySetup #ConvictionTrade #TPHit #ForexLife #TradeWithConfidence #ForexLegacy #TradingWithAdam

EUR/CAD – Watching for ContinuationEUR/CAD has been grinding higher as CAD weakness continues to play out, mainly driven by softer oil prices and the Bank of Canada's dovish lean. Meanwhile, the euro is holding steady with the ECB staying cautious on further cuts, giving this pair a solid bullish tilt.
This can play out 1 of 2 ways, a sweep to the downside to catch liquidity before breaking through recent highs (best). Or we may see bullishness from here in which case the re test of the broken area will be the optimal entry. Trade safe, Trade smart, Trade Drippy!


Two EURCAD Positions Trade Recap 10.09.25Two positions covered in this recap.
EUR / CAD -1%
EUR / CAD Re-Entry BE
Full explanation as to why I executed on these positions and how I maintained my mindset to allow me to get back into the second position after taking the loss. Something I have been working on the past month or so is maintaining the executional mindset after being taken out of a trade, and if it is still intact to actually get back in to the market.
Any questions you have just drop them below 👇

A SELL CALL ON EURCADI’m looking for a sell opportunity in EURCAD As price is reacting around the resistance level of the rising channel. I anticipate price to drop from that zone. A sell opportunity is envisaged.

EURCADDouble Top pattern found with Brarish divergence in EURCAD 1H time frame, which looks like bearish. Expected Entry point, Stop loss and TP mentioned.

EURCAD Is Bearish! Sell!
Please, check our technical outlook for EURCAD.
Time Frame: 1D
Current Trend: Bearish
Sentiment: Overbought (based on 7-period RSI)
Forecast: Bearish
The market is trading around a solid horizontal structure 1.623.
The above observations make me that the market will inevitably achieve 1.598 level.
P.S
The term oversold refers to a condition where an asset has traded lower in price and has the potential for a price bounce.
Overbought refers to market scenarios where the instrument is traded considerably higher than its fair value. Overvaluation is caused by market sentiments when there is positive news.
Disclosure: I am part of Trade Nation's Influencer program and receive a monthly fee for using their TradingView charts in my analysis.
Like and subscribe and comment my ideas if you enjoy them!

will divergence factor will play for EURCADcurrently there is a bearish divergence on RSI if it plays out we can see drop in price of the pair a possible hint for us that price can probably hit the daily timeframe bullish trendline

EUR/CAD Trade IdeaPrice has pushed upward, breaking structure to the upside. However, this move left behind an imbalance (fair value gap), suggesting the market may look to correct before continuing higher.
Plan:
Wait for a retracement to fill the imbalance (correction).
Look for bullish confirmations once the correction completes.
Expectation: continuation to the upside after correction.
Key things to watch:
Where the imbalance sits (mark out the FVG zone).
Price reaction as it corrects—look for bullish order blocks or rejection wicks.
Structure holding above the most recent higher low.

WHAT YOU DON'T SEE ON EURCADHere’s a clean, trader-to-trader read on your EURCAD intraday chart.
### Market structure
* **Context:** After yesterday’s impulsive push up, price distributed, printed a lower high, then **shifted bearish** with a clean impulsive selloff into London hours (your timestamp shows \~09:00).
* **Structure break:** The drop took out the prior intraday higher-low cluster and set **LL–LH** flow. Until price **reclaims 1.6230–1.6235**, bears control the session.
* **Imbalance/FVG:** LuxAlgo marks a **bearish imbalance just above price (\~1.6228–1.6235)**—that’s the first magnet on any bounce. Expect mitigation wicks there.
### Key levels on your screenshot
* **1.6260–1.6265:** Prior support turned resistance; top of your blue target zone. If price can reclaim and hold above, the bearish leg is likely over for the session.
* **1.6230–1.6235:** Imbalance/mini supply from the sell program; first decision point.
* **1.6210–1.6207:** Current execution zone / micro demand pivot. Lose it decisively and momentum should extend lower.
* **1.6180–1.6185 (and 1.6170):** Next downside liquidity pools; where shorts would look to take profit if the FVG rejection holds.
### What the long setup on your chart needs
You’ve drawn a long (blue profit box above, red risk below). For that to play out with good odds:
1. **Reclaim:** Bullish **ChoCh** on the 1–5m and a candle *close* above **1.6230–1.6235** (full FVG fill).
2. **Hold:** Subsequent pullback **holds 1.6228–1.6230** as fresh support (no immediate shove back under).
3. **Targets:**
* TP1: **1.6252–1.6255** (pre-break shelf).
* TP2: **1.6260–1.6265** (structural flip).
* Stretch: **1.6275–1.6285** if momentum returns.
4. **Invalidation:** Clean 5–15m close **below 1.6207** or a drive into **1.6180** (your red risk block) voids the bullish idea.
*R\:R from your drawing looks roughly \~1.5–2.0 if targeting 1.626x/1.628x; tighten the stop only after TP1 is paid.*
### Bearish continuation path (most probable until 1.623x is reclaimed)
* **Scenario:** Price wicks into **1.6230–1.6235** (FVG/last sell OB), shows rejection (upper wicks/engulf on 1–5m), and rotates back under **1.6220**.
* **Plan:** Fade the FVG mitigation with risk above **1.6238–1.6242**.
* **Targets:** **1.6207 → 1.6180 → 1.6170**. Trail behind 1–5m lower highs once under 1.6210.
### Liquidity & sessions
* The London impulsive dump likely **swept late Asian longs**. That often creates a **mean-reversion pop** to fill the first imbalance (your 1.623x), then decides trend. Use that fill as the day’s decision point.
* Above **1.6265**, buy stops from intraday shorts become fuel; below **1.6180**, sell stops under equal lows are exposed.
### How I’d trade it (rules-based)
* **If long:** Wait for a **close above 1.6235**, then buy the retest; partial at **1.6252**, move stop to BE, let the rest try **1.6265/1.6280**.
* **If short (base case until proven otherwise):** Look for **rejection at 1.6230–1.6235**, enter on a bearish 1–5m engulf, stop **1.6240–45**, scale out **1.6207 → 1.6180**.
### Risk notes
* EURCAD can snap on CAD headlines (oil, BoC chatter). Size accordingly; you only need one side to pay—don’t marry both scenarios.
* Keep it mechanical: **confirmation > entry > partials > BE**. No confirmation above 1.6235 = no longs for me.
**Bottom line:** Bias is **sell rallies** into **1.6230–1.6235** unless bulls **reclaim and hold above** that imbalance. Reclaim turns the day neutral-to-bullish toward **1.6265+**; rejection keeps pressure toward **1.6180/1.6170**.

EURCAD ShortBroader Market Structure (EUR/CAD 15M):
The broader structure is bearish. After printing a high at 1.62571, price shifted downward with a strong selloff, creating a new Change of Character (CHoCH) to the downside and confirming a Break of Structure (BOS) below earlier lows. This signaled that sellers regained control. The current upward push is corrective in nature, as it hasn’t yet broken the main bearish structure, suggesting continuation lower remains more likely.
Supply and Demand Analysis:
The upper supply zone around 1.6240–1.6250 is strong, as price previously dropped sharply from this area, showing clear selling pressure. A mid-level demand zone sits near 1.6225–1.6230, but since price sliced through it earlier without much reaction, it is relatively weak. The deeper demand zone around 1.6185–1.6195 is more significant, as buyers stepped in aggressively from there and created the current retracement. That zone remains the key area to test if sellers push back down.
Price Action Within Marked Region:
Right now, price is pushing up toward the overhead supply zone. Candles are showing strength on the climb, but this aligns with corrective retracement behavior rather than a trend reversal. The projection indicates sellers likely defending supply, leading to a push lower toward the 1.6185 demand zone.
Current Trade Bias & Outlook:
The bias is bearish, with the expectation that once price taps into supply near 1.6240–1.6250, it will reverse lower. The target is the deeper demand zone around 1.6185. The invalidation level for this outlook is a clean break and close above 1.6257, which would erase the bearish structure and open space for further upside.
Momentum & Candlestick Behavior:
Short-term momentum currently favors buyers during this retracement, but the broader flow still favors sellers. No strong bullish reversal pattern has formed, only corrective price action. If rejection candles appear at supply, it would confirm continuation down.

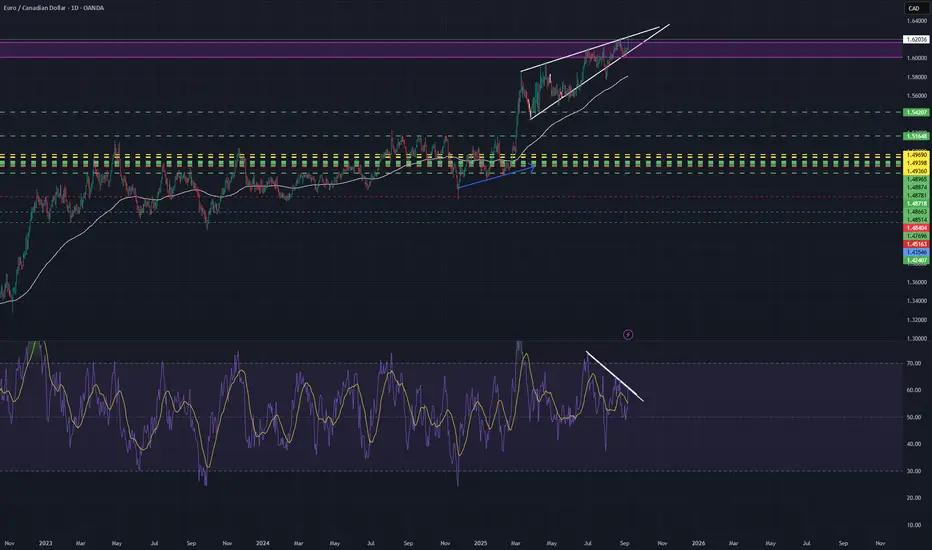
Potential rising Wedge on 1D TimeframeCurrently for EUR/CAD Price has been climbing steadily since February of 2025. With the initial weakness on the CAD due to Tariffs and then the Strength on EUR in late march of 2025 causing a 4 -5% increase in value across most EUR pairs. Now if we look at the daily timeframe we can see price is still making slow gains BUT!! we can start to see a formation of a rising wedge last Fridays poor NFP data Caused the DXY to plumet and in turn cause the EXY to rise as a result. Canadas poor unemployment and PMI fueled the strength in Fridays gains in the EUR/CAD.
While yes we made a new high on Friday at 1.62578 we did not however maintain and close above the previous high of August 22nd at 1.62084 we ended up closing at 1.62036. If you also take a look at RSI we are starting to show Clear as day divergence as price is showing a climb and RSI is showing a fall. This paired with the potential rising wedge has me looking for potential sell setups in the near term.
EURCAD Possible SELL and Buy projection. We need a little lower high on that zone then we sell once the Pex entry model show up, once we got take profit on the next support zone. If reactions shows up, and it’s in session for London or New York, we buy

EURCAD Will Go Up! Buy!
Please, check our technical outlook for EURCAD.
Time Frame: 12h
Current Trend: Bullish
Sentiment: Oversold (based on 7-period RSI)
Forecast: Bullish
The market is trading around a solid horizontal structure 1.605.
The above observations make me that the market will inevitably achieve 1.619 level.
P.S
We determine oversold/overbought condition with RSI indicator.
When it drops below 30 - the market is considered to be oversold.
When it bounces above 70 - the market is considered to be overbought.
Disclosure: I am part of Trade Nation's Influencer program and receive a monthly fee for using their TradingView charts in my analysis.
Like and subscribe and comment my ideas if you enjoy them!

Confirmation of the bullish trend in eurcadIn the long term, the price was supported in the MPL demand range, which indicates an upward trend and a rejection of the supply range we are in, and we can be buyers of this currency pair.

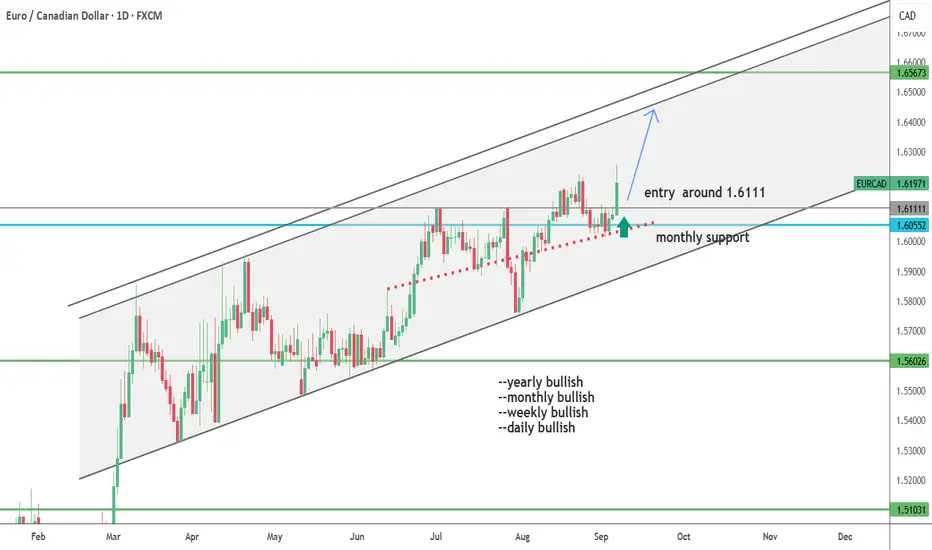
EURCAD--Strong bullish momentumstrong bullish momentum
--yearly bullish
--monthly bullish
--weekly bullish
--daily bullish
--tp and entry levels are as shown on chart
EURCADEURCAD (8H) — Bias: Buy-the-dip within rising channel
Structure: Price is trending up inside an ascending channel and just broke above recent range highs, leaving a fair value gap (FVG) below—classic setup for a pullback then continuation.
Flow/Momentum: Impulsive breakout candle, RSI turning up → buyers in control unless the breakout fails.
Idea: Look for a retrace into the FVG / prior ceiling turned support, form a higher-low, then continuation toward the upper channel rail.
Triggers: 1) Bullish rejection in the FVG; or 2) Break–retest holds with 1H/4H turning back up (5–15–30m align long).
Invalidation: An 8H close back inside the old range / sustained loss of the channel midline → neutralize the long bias.

EURCAD Long TradeOANDA:EURCAD Long Trade
Entry: 0.60500 - 0.60650
TP: 1.61336
This is good trade.
Don't overload your risk like Greedy gambler!!!
Be Disciplined Trader, what what you can afford.
Use proper risk management.
Disclaimer: Trading is risky, only idea, not advice.

EUR/CAD: Launching Long! Layered Entry Strategy For Gains💸 EUR/CAD "Euro vs Loonie" Bank Plan (Swing / Scalping) 📊
🎯 Trading Plan (Thief Layering Strategy)
Asset: EUR/CAD
Setup: Bullish Hull Moving Average breakout + retest 🟢
Entry (Layering Style): Multiple buy limit orders at
1.60800
1.60900
1.61000
1.61200
(You can expand layers based on your own risk preference)
Stop Loss (SL): Thief SL @ 1.60600 (adjust to your own risk strategy) 🛡️
Target (TP): Resistance "police barricade" around 1.62200 🏁
⚠️ Note: This is not financial advice — manage your own TP and risk as per your trading plan.
🔍 Why This Plan? (Fundamental + Macro + Sentiment + Thief Blend)
📈 Real-Time Snapshot (Sept 5, 2025)
EUR/CAD Spot Rate: 1.6025
Daily Change: +0.12%
52-Week Range: 1.4650 – 1.6350
👥 Trader Sentiment
Retail Traders: 42% Long 🐂 | 58% Short 🐻
Institutions: 55% Long 🐂 | 45% Short 🐻
😱 Investor Mood (Fear & Greed)
Index: 48/100 → Neutral ⚖️ (leaning fear due to global trade + US jobs data)
📋 Fundamentals
Score: 62/100 🟢
Drivers:
Eurozone growth resilient, ECB steady at 2% 🏦
Canada facing weak jobs data, BoC at 2.75% 🛢️
Oil prices steady, modest CAD support ⚡
🌍 Macro Score
Score: 58/100 🟡
Factors:
Global trade tensions weigh on CAD 🛡️
Eurozone recovery boosts EUR 💪
US policy uncertainty adds volatility 🌪️
🧭 Overall Market Outlook
Bias: Neutral → Slightly Bullish Tilt 📈
Why: ECB support + Eurozone recovery outweigh CAD’s oil-linked strength. Range likely 1.60 – 1.63 short-term.
🚦 Related Pairs to Watch
FX:EURUSD , OANDA:USDCAD , OANDA:GBPCAD , OANDA:EURGBP
Keep an eye on BLACKBULL:WTI (Oil) for CAD correlation.
✨ “If you find value in my analysis, a 👍 and 🚀 boost is much appreciated — it helps me share more setups with the community!”
#EURCAD #Forex #TradingPlan #SwingTrading #Scalping #ThiefStrategy #HullMovingAverage #Fundamentals #MacroAnalysis #Sentiment #FXCommunity

First Day Of Going Part-Time In A 10% WeekQuick breakdown of my EUR/CAD position from last week combined with two other positions that could have yielded a 10+% return this week. Also it is my first day of going part time and it feels surreal doing trading work while my colleagues are at work.
Have fun watching and let me know if you enjoyed this series!
