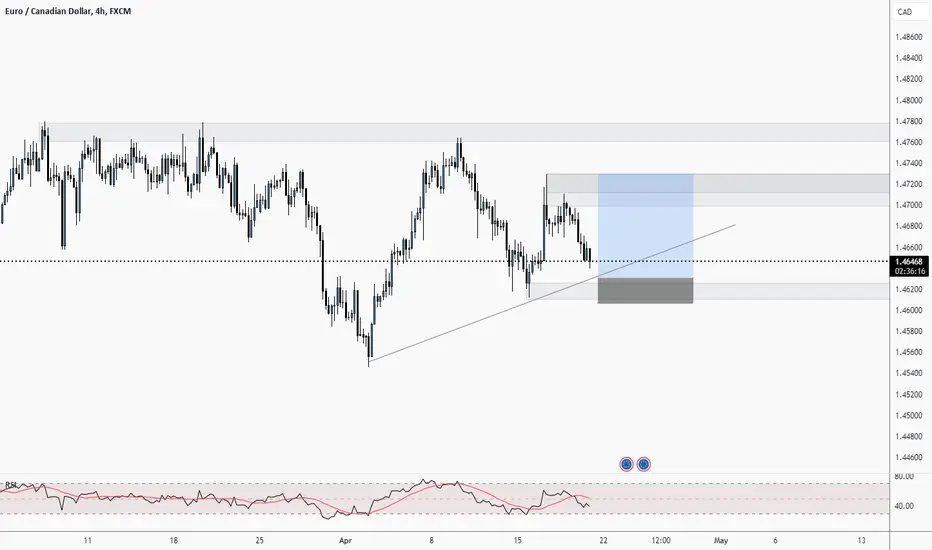
EURCAD Sells IdeaWaiting for price to retest 1.46349 and Sells after confirmations.
or
Waiting to cross price 1.46204 and Sells after confirmations.
EUXCAD trade ideas

EURCAD likely to move downwardsEURCAD is following a downward trendline which it has respected severally. It has now retested it again and seems likely to continue downwards to around 1.45870 or beyond.

Euro/CAD Possible MoveThe Euro/Cad pair has recently completed a Gartley harmonic pattern and is currently showing bullish momentum. If the price breaks out of the pennant formation to the upside, we could potentially see the formation of an AB=CD pattern.

Accumulation completeFrom the 1.4551 level we could see buyers coming into the market, but not all entered so the market returned to the area acculating its buy orders.
We recently broke structure at 1.46009 level, this confirms that the orders are all filled. We are looking to reach 1.47604 level as target!!

EURCAD (2 Scenarios)Depending on how structure stabilizes, we have two different scenarios for buys.

eurcad long trade setupeurcad long trade setup
* a stop hunt occured
* 1h/ displacement after red news folder
* we have failure swings on the left ( low resistance liquidity run )
* we are on the mean thrushold of a daily ob+
2RR
not a trading advice !!!

EURCAD Gartley222Nice looking Gartley 222 respecting well the textbook Fib levels. Not exactly with the trend hence the longer target better be the closest top and not further as the chance of getting a 161% extension is not that great.
At 1 to 1 or at the 61% Fib retracement put stop to entry.
Bulkowski has an interesting article about bullish Gartleys quoting that the hit rate of the target at the A point (where we have the longer-term target) is 45%. I am not saying it is exactly our hit rate, but if you have 1 to 3 RR up to there even with 30% hit rate you are all set.
We are playing poker here, not chess - be mindful of the odds.

EURCAD LongMarket Structure Bullish on HTF
Weekly Rejection at AOI
Weekly and Daily Around Same AOI
Previous indecision candle on the Weekly
Rejection at Daily AOI
Previous Daily Structure Point
H4 Rejection at AOI
REMEMBER: Trading is a Game Of Probability
: Manage Your Risk
: Be Patient
: Every Moment Is Unique
: Rinse, Wash, Repeat!
: Stay Hydrated
#Follow#Share#Comment#Boost

EURCADthe 4h chart, waiting to see if the demand holds and we get a rejection from the trend line for a buy back up to the supply.
Potential upside move in EURCADOANDA:EURCAD is showing potential reversal from current zone. It is currently trading in potential reversal zone of XABCD butterfly pattern along with ascending trendline retest and bullish divergence confluence. These evidences suggest a potential up move in EURCAD from here. We can look for buying setups.

EURCAD Low Risk Pair to Trade This WeekSo I've been getting some questions from some of my students and followers regarding what are some low risk pairs to trade this week.
The first thing I like to do when deciding on which pair to trade is find the pair that is primarily consolidating on larger timeframes such as the daily.
After spotting a consolidating pair, I then want to decide which side I should only enable with my EAs and Bots. In this example, since we are approaching support with little economic data on the agenda this week, I'm only interested in enabling the long side.
When I say enable the side long, I mean enable just the buy side with my EAs that trade in a grid technique, where it will trade micro lots and continue adding if the pair continues to trade against me. By trading micro lots relative to the account balance, I can afford not to use stop loses and look to add hundreds of positions if needed and I'll still be in a good position.
Hope that all makes sense.
That's it - That's all
Trade Safe


EURCAD: Bullish Continuation & Long Signal
EURCAD
- Classic bullish formation
- Our team expects pullback
SUGGESTED TRADE:
Swing Trade
Long EURCAD
Entry - 1.4607
Sl - 1.4577
Tp - 1.4662
Our Risk - 1%
Start protection of your profits from lower levels
❤️ Please, support our work with like & comment! ❤️

EURCAD Will Explode! BUY!
My dear friends,
Please, find my technical outlook for EURCAD below:
The instrument tests an important psychological level 1.4643
Bias - Bullish
Technical Indicators: Supper Trend gives a precise Bullish signal, while Pivot Point HL predicts price changes and potential reversals in the market.
Target - 1.4696
About Used Indicators:
Super-trend indicator is more useful in trending markets where there are clear uptrends and downtrends in price.
———————————
WISH YOU ALL LUCK

EURCAD ____ INCOMING BULLISH MOVEHello Guys,
So there's not so much clarity on the 3M timeframe, however, on the monthly chart, there is a clear W pattern that should lead to a bullish impulse move. There is also an unmitigated continuation order block I would like to trade off from.
Dropping into the weekly timeframe, there is a clear shift in market structure, and inducement of early buyers, an unmitigated demand orderblock that aligns with the monthly order block, and lastly, buy-side liquidity which is just under a clear Fair Value Gap (as seen on the daily chart).
You can keep this on your radar to see how it develops.
Follow for more updates.
Cheers,
Jabari

EUR/CAD SENDS CLEAR BEARISH SIGNALS|SHORT
Hello,Friends!
We are targeting the 1.465 level area with our short trade on EUR/CAD which is based on the fact that the pair is overbought on the BB band scale and is also approaching a resistance line above thus going us a good entry option.
✅LIKE AND COMMENT MY IDEAS✅

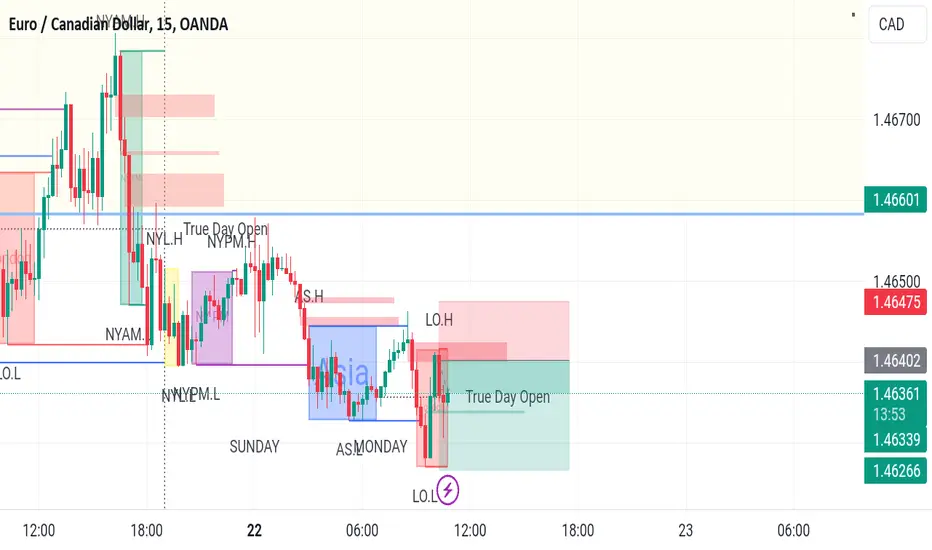
EURCAD londonAsian high swept in the London session. Market structure shift and left behind an imbalance which has been filled to get an entry. Shorts targeting sell side liquidity.
Could EUR/CAD bounce from here?Price is falling towards a support level which is a pullback support that aligns with the 78.6% Fibonacci projection. A bounce from this level could lead the price to rise to our take profit.
Entry: 1.46155
Why we like it:
There is a pullback support level which aligns with the 78.6% Fibonacci projection
Stop loss: 1.45877
Why we like it:
There is an overlap support level
Take profit: 1.46737
Why we like it:
There an overlap resistance level
Please be advised that the information presented on TradingView is provided to Vantage (‘Vantage Global Limited’, ‘we’) by a third-party provider (‘Everest Fortune Group’). Please be reminded that you are solely responsible for the trading decisions on your account. There is a very high degree of risk involved in trading. Any information and/or content is intended entirely for research, educational and informational purposes only and does not constitute investment or consultation advice or investment strategy. The information is not tailored to the investment needs of any specific person and therefore does not involve a consideration of any of the investment objectives, financial situation or needs of any viewer that may receive it. Kindly also note that past performance is not a reliable indicator of future results. Actual results may differ materially from those anticipated in forward-looking or past performance statements. We assume no liability as to the accuracy or completeness of any of the information and/or content provided herein and the Company cannot be held responsible for any omission, mistake nor for any loss or damage including without limitation to any loss of profit which may arise from reliance on any information supplied by Everest Fortune Group.


EURCAD What Next? SELL!
My dear followers,
I analysed this chart on EURCAD and concluded the following:
The market is trading on 1.4675 pivot level.
Bias - Bearish
Technical Indicators: Both Super Trend & Pivot HL indicate a highly probable Bearish continuation.
Target - 1.4658
About Used Indicators:
A super-trend indicator is plotted on either above or below the closing price to signal a buy or sell. The indicator changes color, based on whether or not you should be buying. If the super-trend indicator moves below the closing price, the indicator turns green, and it signals an entry point or points to buy.
———————————
WISH YOU ALL LUCK

EURCAD Date 22nd April Week Analysis22nd April to 26th April Week Analysis.
It's all about probability. You can't predict price with 100% Accuracy, Atleast you can try it!
Watch the charts, If you like then do follow on X and Tradingview.

eurcad-Weekly bull move pullback holing right on 26 ema.
-Weekly reverse hnd formation.
-Daily consolidation area with absorption around the 40% of the original bull move.
-Second consolidation with a shakeout around 50% of the move.
Entry after a confirmative strong bull candle-move or after a bullish pattern.
Stop bellow the pullback move that takes place.
First target on the 100% of the original move.

EURCAD is moving towrad breaking its support lines.chart has already broke its first support so we can take entry after break of second support.
