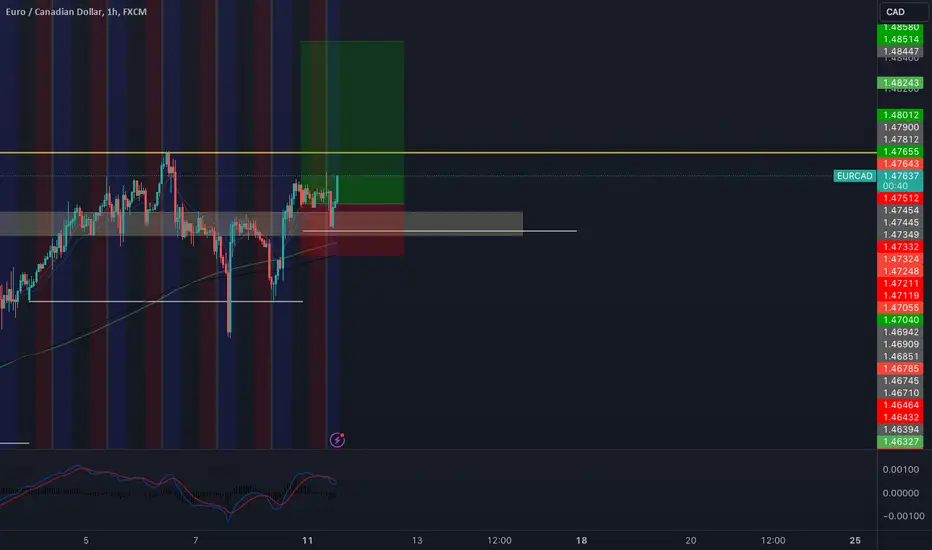
Eurcad has a potential of reaching 1.48000 this week. The reason is its bullish on the Weekly and Daily timeframes. so far the daily timeframe resistance has held it for more than 6 trading days. we see no reason to sell at this moment
EUXCAD trade ideas

EURCAD: Forecast & Trading Plan
The analysis of the EURCAD chart clearly shows us that the pair is finally about to tank due to the rising pressure from the sellers.
❤️ Please, support our work with like & comment! ❤️

bullish trendThe long term bullish analysis from news. The price will move up to resistance area and retest later on.

EURCAD H4 | Reacting off resistance Based on the H4 chart analysis, we can see that the price has just reacted off our sell entry at 1.47467, which is an overlap resistance.
Our take profit will be at 1.4622, a swing-low support level.
The stop loss will be placed at 1.4794, which is above the swing high resistance level."
High Risk Investment Warning
Trading Forex/CFDs on margin carries a high level of risk and may not be suitable for all investors. Leverage can work against you.
Stratos Markets Limited (www.fxcm.com):
CFDs are complex instruments and come with a high risk of losing money rapidly due to leverage. 66% of retail investor accounts lose money when trading CFDs with this provider. You should consider whether you understand how CFDs work and whether you can afford to take the high risk of losing your money.
Stratos Europe Ltd, previously FXCM EU Ltd (www.fxcm.com):
CFDs are complex instruments and come with a high risk of losing money rapidly due to leverage. 70% of retail investor accounts lose money when trading CFDs with this provider. You should consider whether you understand how CFDs work and whether you can afford to take the high risk of losing your money.
Stratos Trading Pty. Limited (www.fxcm.com):
Trading FX/CFDs carries significant risks. FXCM AU (AFSL 309763), please read the Financial Services Guide, Product Disclosure Statement, Target Market Determination and Terms of Business at www.fxcm.com
Stratos Global LLC (www.fxcm.com):
Losses can exceed deposits.
Please be advised that the information presented on TradingView is provided to FXCM (‘Company’, ‘we’) by a third-party provider (‘TFA Global Pte Ltd’). Please be reminded that you are solely responsible for the trading decisions on your account. There is a very high degree of risk involved in trading. Any information and/or content is intended entirely for research, educational and informational purposes only and does not constitute investment or consultation advice or investment strategy. The information is not tailored to the investment needs of any specific person and therefore does not involve a consideration of any of the investment objectives, financial situation or needs of any viewer that may receive it. Kindly also note that past performance is not a reliable indicator of future results. Actual results may differ materially from those anticipated in forward-looking or past performance statements. We assume no liability as to the accuracy or completeness of any of the information and/or content provided herein and the Company cannot be held responsible for any omission, mistake nor for any loss or damage including without limitation to any loss of profit which may arise from reliance on any information supplied by TFA Global Pte Ltd.
The speaker(s) is neither an employee, agent nor representative of FXCM and is therefore acting independently. The opinions given are their own, constitute general market commentary, and do not constitute the opinion or advice of FXCM or any form of personal or investment advice. FXCM neither endorses nor guarantees offerings of third party speakers, nor is FXCM responsible for the content, veracity or opinions of third-party speakers, presenters or participants.

Important areas and general trendsConsidering that after a strong upward trend, the price hit the spot, and this spotting up and down is important for us, and in addition, the price hit a resistance zone from above, and considering all these conditions, these movement modes Which I imagine is the same for this currency pair.

EURCAD: A decision to be made
On the daily chart, we are near the equilibrium of the last 4 months, lurking just below the Fair Value Gap from 30/11/23.
I think that if the price goes higher, it is likely to come back for this nice liquidity of three equal 4H Lows giving a good short opportunity.
Else, if the price goes lower first and takes this level out, it may be viable to buy as the long-standing Daily FVG is just too good of the liquidity level to pass up.

Continue the upward trendGreetings
Dear analysts and traders,
I hope you are doing well and are motivated for the week ahead. I wish you all the success in your business endeavors. Remember that success in trading lies in consistently defining and sticking to your rules.
As someone interested in the Elliott Wave Principle, I find it to be an invaluable tool for market analysis. I have developed my approach by combining this principle with my personal experience and by considering different scenarios that are likely to occur in the market. It should be noted that I do not like to be surprised in the market, and that's why I have different market prospects. I follow them to be sure and recognize the structure that is forming so that I can 100% recognize it.
I will share my analysis with you, but please note that I am not providing any buy or sell signals. My perspective on idea analysis is completely unbiased, so if the idea analysis meets your standards, you can use it as a guide to make an informed decision.
I have attached my previous analysis of the same market so that you can compare and see the differences. All the details of my analysis are clearly labeled, making it easy for you to understand. However, having a basic familiarity with the Elliott Wave Principle theory will help you understand the analytical idea more easily.
I have been studying the Elliott Wave Principle for almost three years now, and over time, my understanding of this knowledge and experience has grown. What I have achieved so far is the legacy of a genius called Ralph Nelson Eliot, and I am really happy with my progress. May peace be upon him.
Thank you for your support so far. I will always remember your kindness. Please share your comments and criticisms with me.
I hope my analysis will be useful to you in your business journey, and I wish you all the best.
Sincerely,
Mr. Nobody
A bearish scenario in the direction of the higher degree pattern of the wave

DeGRAM | EURCAD consolidation marketEURCAD pulled back following the divergence. It created a pinbar on the D chart, meaning level rejection.
Price action is consolidating around the psychological level of 1.47000.
We might see a sharp move down if the price breaks and closes below the support.
-------------------
Share your opinion in the comments and support the idea with like. Thanks for your support!

EURCADPossible 70 pips sell on EURCAD if price breaks the trendline then we should see a sell to 1.46624 zone .

EUR/CAD SELLEUR/CAD rapped into main supply and showed rejections with a bearish Engulfing and close of candle below Doji.
Upon seeing this I waited for retirement to my sell entry@1.47500 with sl@1.47835 (Risking 33 pips).
Tp1: 1.47000 TP2: 1.4675 TP3: 1.4655 TP4:1.4630
* Where has the market moved since I entered my trade? Did 20PIPS now gone back near BE
* If I looked at the market now, would I take the same trade? Yes
* How do I feel about my trade? Optimistic
* What do I like about this trade ? good descent entry
* What do I dis-like about this trade now? Choppy and taking time to move
* On a scale of 1 to 10, where would I rate this Trade now? 7/10
* If I were not in a trade now, would I take the opposite trade ? no

eurcad long welcome
here is my eurcad long idea
its based on
bullish market, buying pressure , trend continuation
lets see how this setup plays out
EURCAD SELL FX:EURCAD
We had a steady uptrend on the 2-hour time frame until we reached the 1.47800 level creating a double top. From that point price reacted with a hard rejection, pushing price to retest the .382 level on the Fib. Price held at that level created a micro support level rejecting again to retest the highs. Once the 2-hour double top was retested price was rejected. If price fails to break above this level, there is a chance that we could see a break of the .382 level on the Fib or possibly retesting the .618.
"If the price of the asset succeeds in surpassing its previous high levels, which could be an indication of a major price breakout, the upward trend is expected to continue, indicating a potential buying opportunites.


EURCAD LongMarket Structure Bullish on HTF
Weekly and Daily at same AOI
Weekly Rejection at AOI
Break of Previous Resistance inside the Weekly Market Structure
Daily Rejection at AOI
Around Psychological level 1.46500
H4 EMA Retest
70% +3
REMEMBER: Trading is a Game Of Probability
: Manage Your Risk
: Be Patient
: Every Moment Is Unique
: Rinse, Wash, Repeat!
: Stay Hydrated
#Follow#Share#Comment#Boost

EURCAD SELL expecting price to sell down to 1.45717 and taking out the liquidity below it, the imbalance has been filled and we should see a continuation of the sell market to 1.45717 zone

EURCAD Eurcad retesting 1hr -30min resistance with a nice rejection candle, expecting price to drop to 1.46975

EURCAD I Potential long from support zone Welcome back! Let me know your thoughts in the comments!
** EURCAD Analysis - Listen to video!
We recommend that you keep this pair on your watchlist and enter when the entry criteria of your strategy is met.
Please support this idea with a LIKE and COMMENT if you find it useful and Click "Follow" on our profile if you'd like these trade ideas delivered straight to your email in the future.
Thanks for your continued support!

EURCAD Sell AnalysisCounter trend Sell with 4hr as my timeframe
Decided to sell purely based on technical analysis and Volume. News supporting the move from yesterday and todays EU news during NY.

EURCAD: Significant Breakout & Bearish setup.The EURCAD pair had been consistently increasing within a rising parallel channel for the past three weeks. However, it recently hit a crucial daily resistance level and began to face strong selling pressure.
As a result, the price broke below the support of the channel, indicating a potential bearish trend continuation. The next support levels to watch for are at 1.4637.

EUR/CAD Analysis: Daily Zones and Cautions
Traders,
Let's assess EUR/CAD's daily zones and accompanying considerations:
Wait for LTF Confirmations: Exercise patience and await confirmations from lower time frames before making trading decisions.
Monthly RSI: Suggests a range zone, indicating potential stability.
Weekly RSI: Indicates a potential bearish move, urging caution regarding long trades.
Daily RSI: Signals more bearish days ahead, reinforcing the need for caution.
Daily Chart: Presents a bullish channel, providing a potential avenue for upward movement.
1-Hour Chart: Identifies a buy zone around a broken level and a sell zone near the supply zone.
Be mindful of these dynamics and ensure thorough analysis before entering trades.
Best regards,


EURCAD EURCAD just entring the bearish trend.
Broke last HL>
Bearish divergence also form in RSI.
We didn,t wait for the breakout .
Sell short at CMP.

EURCADThis Weekly FORECAST
Opportunity for EURCAD. This setup trading idea is for intraday. >> TAYOR
Risk Factors:
1. Market conditions, unexpected news, or external events could impact the trade.
2. Always use risk management strategies to protect your capital.
