Swing Continuation Play Long On EURCADthis is a purely technical trade, don't know (or care) about the fundamentals, EURCAD has been bullish on the 4HR and Daily chart for a long time now, and no reason to assume it's over, also even if it was over, I believe there is a high chance we retest previous highs in either case.
4 scenarios might occur in this case: a higher low reversal where i'd miss the trade or look for lower timeframe pullbacks after a move up, an equal low reversal where i'd enter the trade with minimal drawdown, a lower low followed by pulling back up above the support and continue higher, or we rip right through the lows and I lose this trade.
i might take profit early if we push up very much very quickly near the original TP, i will not move the stop as even if the trade would win, it's very possible that price creates and breaks several lows before going in my favor.
Trade ideas

EURCAD - SHORTTRADING ADVICE REVIEW - EUR/CAD
**✓ SUMMARY: Recommendation REVISED - WAIT FOR CONFIRMATION**
## Previous Context Review
- **Date of Original Analysis**: October 13, 2025
- **Original Recommendation**: SHORT EUR/CAD
- **Key Price Levels**: Entry below 1.6200, Stop 1.6350, Targets 1.6095/1.6030
- **Original Setup Grade**: B+ (15/21 points, 1.75% risk allocation)
***
## ✓ FUNDAMENTAL UPDATE
**New developments: YES - Mixed Signals**
**Key Changes (Past 24-48 Hours):**
1. **French Political Crisis INTENSIFIED**
- Macron **rejected resignation calls** on October 13
- **Two no-confidence motions** filed against reinstated PM Lecornu
- Political instability **worsening** - supports EUR weakness ✅
2. **Oil Price Recovery**
- WTI crude **+2.36%** to $59.61 on October 13
- Bounced from $58.26 low on October 10
- Still **-19.26% YoY** but short-term recovery could strengthen CAD ⚠️
3. **Canadian Employment Surprise**
- September jobs **+60K** vs expectations
- Unemployment steady at 7.1%
- **Reduces urgency** for aggressive BOC cuts ⚠️
**Impact on Original Bias: NEUTRAL/MIXED**
- EUR weakness factors strengthened (French crisis)
- CAD weakness factors mixed (oil recovery vs employment)
***
## ✓ TECHNICAL UPDATE
**Setup Still Valid: YES - But Pending Confirmation**
**Critical Observation**: The **1.6200 support level has NOT been breached**
**Price Action Analysis:**
- Current Price: **1.6237** (from 2H chart)
- 24H Range: **1.6195 - 1.6286**
- Distance from 1.6200: **+37 pips** (still above key level)
- Pattern: **Consolidation above support** - no clean breakdown yet
**Technical Status:**
- ✅ Support zone **integrity maintained**
- ⚠️ **No confirmation signal** yet (bearish breakdown pending)
- ✅ French crisis **fundamental catalyst** still active
- ⚠️ Oil recovery creating **short-term CAD strength**
***
## ✓ REVISED RECOMMENDATION
**Entry Strategy - MODIFIED:**
- **Primary Entry**: **WAIT** for clean break below **1.6200** with volume
- **Alternative**: Sell limit at **1.6280-1.6290** on any pullback to resistance
- **Stop Loss**: **1.6350** (unchanged)
- **Target 1**: **1.6095** (1:2.3 R:R)
- **Target 2**: **1.6030** (1:3.1 R:R)
- **Risk**: **1.5%** (reduced from 1.75% due to mixed signals)
**Reasoning**:
Original setup remains **fundamentally sound** with French political crisis worsening, but **technical confirmation is still pending**. Oil recovery and Canadian employment data create **short-term headwinds** for the short thesis.
***
## ✓ ACTION ITEMS
**Immediate Actions:**
- **Monitor 1.6200 level closely** - wait for clean breakdown
- **Track oil prices** - further recovery above $60 reduces setup attractiveness
- **Watch French political developments** - no-confidence vote timing
- **Prepare entry orders** below 1.6200 but DO NOT execute yet
**Key Monitoring Points:**
- **1.6200 break confirmation** with 4H candle close below
- **Oil price action** - sustained move above $60 would weaken setup
- **BOC meeting prep** (October 29) - market pricing for cuts
**Reassessment Timeline:**
- **Daily review** until 1.6200 breaks or setup invalidates at 1.6350
- **Immediate reassessment** if oil reaches $62+ or French crisis resolves
***
## ✓ CHECKLIST COMPLIANCE
**All 6 Checkpoints Status:**
1. **Confluence (3+/8)**: ✅ **PASS** - French crisis worsened (+1 factor)
2. **Freshness**: ✅ **PASS** - Still first touch of 1.6200 breakdown level
3. **Confirmation**: ⚠️ **PENDING** - No clean breakdown yet (CRITICAL)
4. **Grade**: ✅ **B+** maintained (mixed fundamentals = neutral)
5. **Limits**: ✅ **APPROVED** - Within daily/weekly risk limits
6. **Correlation**: ✅ **APPROVED** - No new correlation concerns
**Zero-Tolerance Violations**: ❌ **NONE**
**Current Compliance**: **5/6 checkpoints passing** - WAIT for Checkpoint 3 confirmation
***
## Final Assessment
The **fundamental thesis remains intact** with the French political crisis intensifying EUR weakness. However, **technical confirmation is still required** as the critical 1.6200 support has held firm. The **oil price recovery** and **Canadian employment surprise** create short-term headwinds but don't invalidate the medium-term setup.
**Patience is required** - this is exactly the type of disciplined approach your institutional checklist demands. Wait for clean confirmation rather than forcing a trade that hasn't fully materialized yet.
(www.nytimes.com)
(www.reuters.com)
(www.aljazeera.com)
(markets.businessinsider.com)
(tradingeconomics.com)
(www.marketwatch.com)
(global.morningstar.com)
(www.exchangerates.org.uk)
(wise.com)
(ppl-ai-file-upload.s3.amazonaws.com)
(tradingeconomics.com)
(www.reuters.com)
(wise.com)
(think.ing.com)
(www.poundsterlinglive.com)
(www.ecb.europa.eu)
(www.abc.net.au)
(finance.yahoo.com)
(www.ecb.europa.eu)
(www.cnn.com)
(www.investing.com)
(wolfstreet.com)
(www.france24.com)
(www.ofx.com)
(www.rba.gov.au)
(www.tradingview.com)
(www.truenorthmortgage.ca)
(www.goodreturns.in)
(stockinvest.us)
(myperch.io)
(www.mitrade.com)
(equalsmoney.com)
(www.tradingview.com)
(www.eia.gov)
(www.investing.com)
(www.bankofcanada.ca)
(au.investing.com)
(www.fastbull.com)
(www.bankofcanada.ca)
(oilprice.com)
(www.fxempire.com)

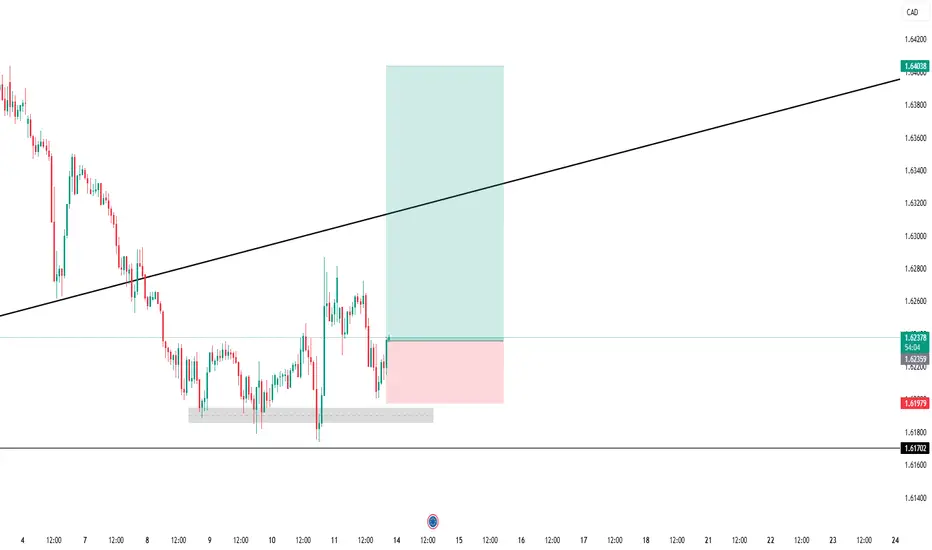
Trade Setup (BUY Position)I’m entering a buy position from a key demand zone, where price previously showed strong rejection and formed a potential double-bottom structure. The recent bullish reaction from this support area indicates renewed buying pressure. My stop loss is placed just below the structural low to protect against false breakouts, while the take-profit target is aligned with the upper trendline, where potential resistance may appear.
This trade follows the overall market structure shift, anticipating a continuation toward higher highs as long as the price maintains above the identified demand zone.
Key Highlights:
Entry: Near 1.6237 (support zone retest)
Stop Loss: Below 1.6197 (structural low)
Take Profit: Around 1.6403 (trendline resistance)
Risk-to-Reward Ratio: Approximately 1:3
Bias: Bullish continuation following a correction
POTENTIAL UPSIDE FOR EURCADCheck a retest of the breakout of EURCAD recently, I hope to see bullish action for the remainder of the week. Cheers

EURCAD Wedge Break Suggests Correction AheadPrice has been climbing within a rising wedge, a pattern often showing buyer exhaustion as momentum weakens near the top.
The recent break below the lower trendline suggests that sellers are starting to step in, shifting momentum in their favor.
If price holds below this broken structure, we could see a deeper pullback. I would anticipate at around 1.6000.

EURCAD Technical & Order Flow AnalysisOur analysis is based on a multi-timeframe top-down approach and fundamental analysis.
Based on our assessment, the price is expected to return to the monthly level.
DISCLAIMER: This analysis may change at any time without notice and is solely intended to assist traders in making independent investment decisions. Please note that this is a prediction, and I have no obligation to act on it, nor should you.
Please support our analysis with a boost or comment!

Long @ EURCAD, possibility of trend reversalFollowing the 4h chart confirmation the EURCAD, in my honest opinion, is moving from an down trend to an up trend on the 1H chart.
The Accumulation and Distribution indicator confirms by going above 50 WMA.
We can spot a small little flag breakout.
I am going long now @ 1.62698 with my stop at 1.62258 (previous low) and the target is 1.63572 (161.8% projection of the previous spike).
Low leveraged, since the signal is good but not so perfect.
Now which ever touches first I'm out.
Disclaimer: This is NOT a trading advice, I do not offer this services and I'm not responsible for your decisions. If someone ask you money pretending to be me, report immediately to the moderators. I'm not licensed to manage 3rd party capital, so I don't offer this type of service.

13.10.25 Moring ForecastPairs On Watch
FX:GBPUSD Long
FX:AUDNZD Long
FX:EURCAD Long
FX:USDCHF Short
FX:EURNZD Short
A short overview of the instruments i am looking at for Today, Multi-timeframe analysis down to what i will be looking at for entry

EURCAD| Bullish Intent LoadingPair: EUR/CAD
Bias: Bullish
HTF Overview:
Higher timeframe shows strong bullish momentum, breaking significant highs with structure clearly favoring continuation. Price remains aligned with smart money’s directional bias.
MTF Insight:
Price retraced into discounted areas, fully aligned with HTF bullish intent. Sell-side liquidity (SSL) has been swept, and price is now resting within the refined order block — setting up for the next bullish leg.
LTF Confirmation:
Lower timeframe shows a breached lower high, now running toward higher highs. Once a clean microstructure setup forms, buy positions can be considered in line with the bullish continuation.
Entry Zone:
Refined OB in discounted area post-liquidity sweep — awaiting LTF confirmation.
Targets:
Recent highs and unmitigated HTF supply zones.
Mindset Note:
Patience and precision are key — let smart money dictate timing, and the next bullish push will follow the structure naturally. 🚀

EUR-CAD Strong Breakout! Buy!
Hello,Traders!
EURCAD breaks above the key horizontal level, signaling Smart Money expansion after liquidity grab beneath structure. Price may now rebalance inefficiency toward 1.6300, confirming bullish intent. Time Frame 3H.
Buy!
Comment and subscribe to help us grow!
Check out other forecasts below too!
Disclosure: I am part of Trade Nation's Influencer program and receive a monthly fee for using their TradingView charts in my analysis.

EUR/CAD Analysis: Strategic Layer Entries for Swing/Day Trade💹 EUR/CAD Forex Market Profit Blueprint (Swing/Day Trade)
📌 Asset:
EUR/CAD — Euro vs Canadian Dollar
📖 Trading Plan:
I’m looking Bullish on EUR/CAD — waiting for a resistance breakout at 1.62800.
👉 To track it easily, set an alert on TradingView at this breakout level so you don’t miss the move.
🧩 Layered Entry Approach (aka “Thief Layer Strategy”)
This method is basically multiple buy limit orders stacked at key levels to catch the breakout momentum smoothly:
🔑 1.62000
🔑 1.62300
🔑 1.62500
🔑 1.62800
(You can add more layers if you like — the idea is scaling in smartly with the breakout confirmation.)
🛡️ Stop Loss Placement
Suggested SL: 1.61700 (after breakout confirmation).
⚠️ Important: This is just a sample placement. Please adjust your stop loss according to your own strategy, risk management, and comfort.
🎯 Target Zone
Upside target at 1.64000, where:
Moving averages act as resistance
Market looks overbought
Potential liquidity trap signals may appear
So the idea is to secure profits before the market reverses — exit smart, not greedy.
⚖️ Risk Disclaimer
Ladies & Gentlemen (a.k.a. the “Thief OGs” community) 🕶️ — this blueprint is not financial advice.
✅ Use your own TP/SL levels.
✅ Trade at your own risk.
✅ Take profit when it makes sense for you.
This is simply my analysis blueprint for educational purposes.
🔗 Correlated Pairs to Watch
Keep an eye on related crosses to see how momentum aligns:
💵 FX:EURUSD (tracks core EUR strength)
💵 OANDA:USDCAD (mirrors CAD flows & oil link)
💵 OANDA:EURGBP (helps confirm EUR sentiment)
Correlation check helps you filter fake breakouts and confirm real market momentum.
✨ “If you find value in my analysis, a 👍 and 🚀 boost is much appreciated — it helps me share more setups with the community!”
#EURCAD #ForexTrading #SwingTrade #DayTrade #BreakoutStrategy #LayeringStrategy #EURUSD #USDCAD #TradingBlueprint #FXAnalysis

Uptrend in EURCADThe trend of this currency pair is completely bullish and we can enter a buy position when the price corrects.

I Was The First to Talk About It (S&P500)!!!!!I was The first to talk about the correction in the S&P500 and others, but no one is listentin carefully to what I am saying.
Also I talked about the AUD/NZD and EUR/USD.
EURCAD EURNZD BTC analysis included.
Good Luck For All of Us.
Markets Titan

Bulls Trapped Bears at Support - EURCAD Coils for BreakoutBulls Trapped Bears at Support - EURCAD Coils for Breakout
**RECOMMENDED EXIT DATE TO AVOID VOLATILITY:** October 28, 2025 (End of Day) - This gives you 17 trading days to capture the technical move while avoiding the Bank of Canada rate decision on October 29, which could cause significant volatility and potentially gap through your stop loss.
The Market Participant Battle:
At point 1, sellers established resistance around 1.6350 on this 4H EURCAD chart. Price then dropped to point 2, creating a low near 1.6180. The critical moment came at point 3, where bulls successfully closed above point 1's resistance level, proving that the buyers who entered at point 2 were stronger than the sellers at point 1. This breakout validated point 2 as a zone of proven market participants.
Now at point 4, we see price returning to this exact proven support level at 1.6180. The market participant narrative is clear: bears tried to push lower after the point 3 high, but they are now returning to the location where bulls previously demonstrated their strength. The expectation is that these same proven buyers will defend this level again, launching price back toward the highs and beyond. This is a classic support retest pattern showing institutional buyers positioning at a level they previously defended successfully.
Confluences:
Confluence 1: Triple Bullish Divergence with Oversold Indicators
This confluence shows a powerful triple divergence setup on the 4H timeframe. While price formed a higher low between points 2 and 4 (remaining relatively flat around 1.6180), three key momentum indicators all made lower lows:
- RSI dropped into oversold territory below 40, making a clear lower low
- MFI similarly declined into oversold conditions below 50, also making a lower low
- CVD Candles showed declining cumulative volume delta, indicating selling pressure exhaustion
Additionally, the OBV indicator touched the lower Bollinger Band at point 4, which historically signals an oversold extreme often followed by mean reversion. All RSI signals throughout the decline showed "Bear" labels, confirming sustained downward pressure that is now exhausted. This triple divergence combined with multiple oversold readings creates a high-probability reversal setup. When momentum indicators decline while price holds support, it signals that selling pressure is weakening despite bears' best efforts.
Confluence 2: Andrews Pitchfork Median Line Rejection
Switching to the daily timeframe, an Andrews Pitchfork drawn from major swing points reveals a textbook physics-based setup. The pitchfork shows price respecting the upper and lower boundaries throughout its construction, with point 3 reaching the upper channel boundary before reversing.
At point 4, price has returned precisely to the median line - the most significant line in any pitchfork structure. The pitchfork operates on action-reaction principles: the magnitude of the undershoot below the median should project to a similar overshoot above it, assuming the system remains consistent.
What makes this confluence particularly powerful is the price action at the median line. Point 4 produced a large green daily candle that is both a fractal bar (showing divergence on lower timeframes) and an outside bar (encompassing the entire range of the previous bar). This aggressive bullish candle at the median line indicates strong buyer entry and suggests institutional participants are positioning for the move back to the upper channel boundary. The symmetry principle of the pitchfork supports a projected move that mirrors the previous downside deviation.
Confluence 3: Anchored Volume Profile Support Defense
The anchored volume profile on the daily timeframe reveals where significant trading activity has occurred across different price levels. At point 4 around 1.6180, we can observe substantial volume accumulation, indicating this is a high-conviction area for market participants.
The critical element here is the price action: price briefly dipped below a key volume node but then recovered to close above it at point 4. This "stop hunt and recovery" pattern is a classic institutional fingerprint. It suggests that large players allowed price to briefly sweep liquidity below the obvious support level (triggering retail stop losses) before aggressively buying the dip and pushing price back above the volume node.
This behavior indicates that institutional buyers viewed the dip as an opportunity rather than a breakdown. When volume profile shows this type of defense at a high-volume node, it confirms that smart money is actively accumulating at this level, treating it as value rather than distribution.
Confluence 4: AVWAP Mean Reversion from Extreme Deviation
An Anchored VWAP from point 1 on the daily chart provides our fourth confluence. AVWAP shows the average price weighted by volume from the anchor point, with standard deviation bands indicating how far price has stretched from this average.
At point 4, we observed price piercing down through the 2nd standard deviation below the AVWAP - a statistical extreme representing significant oversold conditions. Price then closed back above the 1st standard deviation, showing the beginning of mean reversion.
The significance here is twofold: First, reaching the 2nd standard deviation represents an extreme that statistically should revert to the mean. Second, price is currently still below the AVWAP line itself, meaning we are entering this trade at "value pricing" before price returns to the volume-weighted average. This is optimal entry timing for a mean reversion trade - we are buying after the extreme stretch but before the full reversion has occurred, providing excellent risk-reward positioning.
Confluence 5: AVWAP Failed Breakdown - Institutional Positioning
A second AVWAP, this time anchored to a previous high, provides additional confirmation from a different reference point. This AVWAP shows a red line with standard deviation bands (black curves) above and below.
In the area around point 4, price dipped below this AVWAP but quickly closed back above it. Most significantly, price failed to even reach the 1st standard deviation below the AVWAP despite breaking below the mean line. This failure to follow through indicates sellers lacked conviction and buyers stepped in immediately.
This confluence reveals sophisticated institutional positioning. When retail traders see "price below VWAP" they often think "sell signal." However, institutional participants recognize "price below VWAP from a high" as a buying opportunity - particularly when the price is still relatively close to the VWAP and hasn't extended to the 1st deviation. This hints at smart money positioning at optimal risk-reward zones, buying when retail sentiment is bearish but technical conditions favor a reversal.
Web Research Findings:
- Technical Analysis: Multiple technical analysis sources show mixed short-term signals but acknowledge EURCAD's strong 2025 uptrend. The pair surged from a low of 1.4742 in January to a high of 1.6400 on October 3, 2025 - a gain of over 11%. Recent analysis from BabyPips (published 2 days ago) specifically mentions that if steady demand holds above 1.6250, trend followers could drive prices toward 1.6400 highs or fresh 2025 highs. FX Leaders forecasts daily closing prices around 1.6375 CAD with bullish RSI at 62.85. Current support is identified at 1.6180-1.6250 zone, with resistance at 1.6400-1.6450.
- Recent Monetary Policy: The Bank of Canada cut rates by 25 basis points on September 17, 2025, bringing the policy rate to 2.50% from 2.75%. This marks a continuation of the BOC's easing cycle that began in mid-2024. Meanwhile, the ECB cut rates to 2.00% (deposit facility) at its September 11, 2025 meeting. Both central banks are in easing mode, but the BOC has been more aggressive, which has kept CAD relatively weaker.
- Upcoming BOC Decision: The next Bank of Canada rate announcement is scheduled for October 29, 2025 - just 18 days away. Market pricing via bond futures shows a 64% probability of another 25 basis point cut, with 36% expecting a hold. This uncertainty stems from unclear tariff impacts on growth and inflation. Multiple economists expect at least one more cut before year-end, with some forecasting the policy rate could reach 2.00-2.25% by end of 2025.
- Economic Conditions: The euro has demonstrated strong performance in 2025, supported by increased EU investment plans in infrastructure and military sectors. The Canadian dollar faces pressure from trade uncertainties and weaker economic data. Canada's manufacturing PMI has shown contraction (48.3 in August, up from 46.1 but still below 50). Meanwhile, Eurozone inflation remains near the ECB's 2% target at 2.1%, providing stability for the euro.
- Market Sentiment: The EUR/CAD pair broke out of a 1.40-1.50 range that held for four years, signaling a major structural shift. Analyst forecasts for December 2025 range from 1.6043 to 1.6463, with most seeing continued strength. The COT report from early May showed both EUR and CAD at intermediate positioning extremes, with EUR closer to all-time extremes, making it susceptible to sentiment shifts. However, the technical breakout and fundamental support for EUR strength remain dominant themes.
- Interest Rate Divergence: While both the ECB and BOC are cutting rates, market expectations show the BOC may cut more aggressively through year-end. This divergence supports EUR strength against CAD. The ECB's September projection sees inflation averaging 2.1% in 2025, 1.7% in 2026, and 1.9% in 2027, providing a stable backdrop for gradual easing. Canada faces more uncertainty due to tariff impacts on trade-sensitive sectors.
Layman's Summary:
Here is what all this research means for your trade in simple terms: EURCAD has been on a tear in 2025, breaking out of a multi-year range because the euro is getting stronger while the Canadian dollar is getting weaker. The European economy is doing better with solid investment plans, while Canada is dealing with manufacturing weakness and trade uncertainty.
Both the European Central Bank and Bank of Canada are cutting interest rates to support their economies, but Canada is expected to cut more aggressively. When one country's central bank cuts rates more than another's, the first country's currency tends to weaken - which is exactly what is happening with the Canadian dollar.
Your trade is trying to catch a bounce at support around 1.6180, which multiple technical indicators suggest is a strong level. Recent analyst commentary specifically mentioned that if this support holds, prices could rally back to the 1.6400 highs or even make new highs for 2025.
The main risk is the Bank of Canada meeting on October 29. If they surprise markets with their decision or messaging, it could cause sharp moves in either direction. That is why exiting before October 28 makes sense - you can capture the technical bounce without risking a volatile central bank reaction that could gap through your stops. Overall, the fundamental backdrop supports EUR strength, and your technical entry is at a well-defended support zone, giving you a good setup for the short-term bounce you are targeting.
Machine Derived Information:
- Image 1 (Narrative Setup - 4H Chart): Shows EURCAD with numbered points 1-4. Point 1 is resistance at 1.6350, point 2 is support low at 1.6180, point 3 is breakout above point 1 proving point 2 buyers, point 4 is return to proven support at 1.6180. Horizontal support line drawn at 1.6180 level. - Significance: Establishes the core market participant battle narrative where sellers at point 1 were defeated by buyers at point 2 (proven by point 3 breakout), and now we return to these proven buyers at point 4. Classic support retest pattern. - AGREES
- Image 2 (RSI/MFI/CVD Divergence - 4H Chart): Shows price with three momentum indicators below. OBV touching lower Bollinger Band at point 4. RSI in oversold territory with "Bear" signals, making lower low from point 2 to 4 via blue trendline. MFI also making lower low, oversold below 50. CVD Candles showing declining delta from point 2 to 4. Price formed higher low while all three indicators made lower lows. - Significance: Triple bullish divergence setup with all momentum indicators oversold and diverging from price action. Suggests selling pressure exhaustion despite price holding support. OBV at lower Bollinger Band indicates extreme oversold condition typically preceding mean reversion. - AGREES
- Image 3 (Andrews Pitchfork - Daily Chart): Shows 1D EURCAD with Andrews Pitchfork drawn from major swing points. Price respects upper and lower channel boundaries. Point 3 reaches upper boundary. Point 4 returns to median line with large green daily candle that appears to be both fractal and outside bar. Pitchfork shows symmetry with undershoot and projected overshoot potential. - Significance: Median line is the most important line in pitchfork analysis. Price returning to median with strong bullish candle (fractal + outside bar) indicates aggressive buyer entry. Physics-based pitchfork suggests symmetry - magnitude of undershoot should project to similar overshoot. - AGREES
- Image 4 (Anchored Volume Profile - Daily Chart): Shows 1D EURCAD with horizontal volume profile bars. Price action at point 4 around 1.6180 shows volume accumulation. Price briefly dipped below high-volume node but recovered to close above it at point 4. - Significance: Stop hunt and recovery pattern at key volume node indicates institutional buying. Large players swept liquidity below obvious support (triggering retail stops) then aggressively bought, pushing price back above volume node. Confirms smart money defending and accumulating at this level. - AGREES
- Image 5 (AVWAP from Point 1 - Daily Chart): Shows 1D EURCAD with Anchored VWAP (red line) from point 1, with standard deviation bands (black curves). At point 4, price pierced 2nd standard deviation below VWAP, then closed back above 1st standard deviation. Current price remains below VWAP red line. - Significance: Reaching 2nd standard deviation represents statistical extreme oversold condition. Closing back above 1st deviation shows mean reversion beginning. Price still below VWAP means entry at "value pricing" before full reversion to average - optimal timing for mean reversion trade. - AGREES
- Image 6 (AVWAP from Previous High - Daily Chart): Shows 1D EURCAD with Anchored VWAP (red line) from previous high, standard deviation bands (black curves). At point 4 area, price dipped below VWAP but quickly closed back above. Notably failed to reach 1st standard deviation below despite breaking below mean line. - Significance: Failed breakdown with immediate recovery shows seller lack of conviction and eager buyers. Failure to reach even 1st standard deviation indicates strong support. Reveals institutional positioning - smart money buying when retail sees "price below VWAP" as bearish. Hints at institutions positioning at optimal risk-reward zones. - AGREES
- Image 7 (Conclusion - R/R Setup - Daily Chart): Shows 1D EURCAD with complete trade setup. Entry at 1.62865 BUY. Stop loss at 1.61317 (0.98% risk, 160.1 pips). Target at 1.72622 (5.96% profit, 970.4 pips). Risk/Reward Ratio displayed as 6.06:1. Volume profile areas marked with cyan and pink zones. Points 1, 2, 3, 4 labeled. Horizontal line at 1.61896 marking structure. - Significance: Exceptional 6:1 risk-reward ratio. Entry is at proven support (point 4) with stop below structure at 1.61896 level. Target aims for extension above point 3 highs toward upper volume zone. Trade structure shows conviction with tight stop relative to substantial upside target. - AGREES
Actionable Machine Summary:
The machine-derived analysis reveals a remarkably aligned setup across all six unique technical confluences. Every single confluence agrees with the bullish thesis, which is exceptionally rare and indicates high-probability conditions.
Key actionable insights:
1. The market participant battle clearly favors bulls - proven buyers at point 2 successfully defended against point 1 sellers (evidenced by point 3 breakout), and we are now returning to these same proven participants
2. Triple divergence (RSI, MFI, CVD) in oversold territory is one of the strongest reversal signals in technical analysis - momentum declining while price holds support indicates imminent directional change
3. The pitchfork median line with aggressive bullish candle structure (fractal + outside bar) suggests institutional accumulation at a physics-based turning point
4. Both volume profile and dual AVWAP analyses confirm institutional positioning and mean reversion setup - smart money is buying while retail remains cautious
5. The 6:1 risk-reward ratio provides excellent trade mathematics - even with a 30% win rate, this trade structure would be profitable long-term
The confluence of support retest, momentum divergences, volume analysis, and mean reversion all occurring simultaneously at the same price level creates what is known as a "confluence zone" - where multiple independent technical factors agree. These zones historically produce high-probability trade opportunities. The machine analysis strongly supports trade execution with proper risk management via the defined stop loss at 1.61317.
Conclusion:
Trade Prediction: SUCCESS
Confidence: High
Risk/Reward Ratio: 6.06:1
This EURCAD long setup at 1.62865 presents a high-probability trade opportunity with exceptional risk-reward characteristics. The conclusion image above shows the complete trade structure with entry at proven support, stop below structure at 1.61317, and target at 1.72622 for a 6:1 reward-to-risk ratio.
Key Reasons for Success:
1. All Six Technical Confluences Align: Having narrative setup, triple divergence, pitchfork median, volume profile, and dual AVWAP analyses all agree is exceptionally rare. This level of technical confluence historically produces high win rates.
2. Proven Support Retest: Point 2 buyers demonstrated strength by breaking above point 1 resistance (at point 3). Returning to these proven participants at point 4 provides high-probability support.
3. Institutional Fingerprints: Both volume profile and AVWAP analysis reveal classic institutional behavior - stop hunts followed by aggressive buying, and positioning at optimal risk-reward zones. Smart money is accumulating here.
4. Mean Reversion from Statistical Extremes: Price reached the 2nd standard deviation on AVWAP and shows OBV at lower Bollinger Band - both statistical extremes that typically revert. We are entering as reversion begins but before full recovery.
5. Fundamental Backdrop Supports EUR Strength: BOC cutting more aggressively than ECB, Canadian economic weakness vs European stability, and EURCAD breaking multi-year range all support continued EUR strength against CAD.
6. Recent Analyst Support: Technical analysts published just 2 days ago specifically mentioned that support above 1.6250 could drive prices to 1.6400 highs or fresh 2025 highs - exactly the move this trade targets.
7. Exceptional Risk-Reward: 6:1 ratio means this trade can lose 83% of the time and still break even. With high-confidence technical setup, actual win probability is much higher, making expected value extremely favorable.
Key Risk to Monitor:
The primary risk is the Bank of Canada rate decision on October 29, 2025. If the BOC surprises markets with unexpected hawkish or dovish messaging, it could cause sharp volatility in CAD pairs. However, this risk is fully manageable by exiting before October 28, giving 17 trading days to capture the technical move while avoiding the binary event risk.
The 0.98% stop loss at 1.61317 sits below the key structural level at 1.61896 and below the proven support zone. This provides appropriate protection while allowing for normal market noise. The stop placement respects the technical structure rather than using an arbitrary percentage.
Final Recommendation: TAKE THE TRADE
The confluence of technical factors, fundamental support, recent analyst validation, and exceptional risk-reward ratio make this a high-quality trade setup. With proper risk management (0.98% risk per the setup) and a planned exit before the October 29 volatility event, this trade offers excellent expected value. The 6:1 ratio alone justifies execution, but combined with the technical confluence and fundamental backdrop, confidence is high for price to reach the 1.72622 target zone.
Execute the trade as planned: entry 1.62865, stop 1.61317, target 1.72622. Exit before October 28 end of day to avoid BOC meeting volatility. Position size according to your risk management rules based on the 1.5% stop distance.
**RECOMMENDED EXIT DATE TO AVOID VOLATILITY:** October 28, 2025 (End of Day) - Exit before BOC rate decision to avoid potential gap risk through stops.
Analysis Methodology:
This analysis uses multiple technical indicators and confluences including trend lines, volume analysis, momentum divergences (RSI, MFI, CVD), anchored VWAPs, volume profile analysis, Andrews Pitchfork, support/resistance identification, and candlestick pattern analysis to identify high-probability trade setups. The analysis combines technical, fundamental, and market sentiment factors to provide comprehensive trade evaluation.

EURCAD BULLISH BREAKOUT|LONG|
✅EURCAD shows a clean breakout above the key level, confirming a bullish shift in market structure. ICT concepts suggest a potential retest before continuation toward 1.63000 where buy-side liquidity rests. Time Frame 3H.
LONG🚀
✅Like and subscribe to never miss a new idea!✅

EURCAD +3% Trade Recap 10.10.25 In this recap I break down my EURCAD short position I took yesterday morning. I fully forecast this setup in the morning as per my forecast video, and then executed later that day. Manually closing for just under 3% profit at the intended target.
Full explanation as to why I executed on this position, using the 4H to my advantage but also understanding price was due a deeper pullback, but these pullbacks do not always happen.
Any questions you have just drop them below 👇

EURCAD Will Move Lower! Sell!
Take a look at our analysis for EURCAD.
Time Frame: 1D
Current Trend: Bearish
Sentiment: Overbought (based on 7-period RSI)
Forecast: Bearish
The price is testing a key resistance 1.627.
Taking into consideration the current market trend & overbought RSI, chances will be high to see a bearish movement to the downside at least to 1.608 level.
P.S
We determine oversold/overbought condition with RSI indicator.
When it drops below 30 - the market is considered to be oversold.
When it bounces above 70 - the market is considered to be overbought.
Like and subscribe and comment my ideas if you enjoy them!

EUR/CAD Breaks the Wedge – Bearish Momentum Unleashed
---
After consolidating within a clear wedge formation, EUR/CAD finally broke below the pattern during last week’s trading sessions, confirming a decisive shift in market sentiment. The pair has since retested the underside of the wedge, now acting as resistance.
Zooming into the daily timeframe, price action remains suppressed beneath a critical resistance zone, reinforcing the bearish outlook. With momentum building and technical barriers holding firm, we anticipate a continued drop toward the key support levels highlighted on the chart.
⚠️ Traders, stay alert—this setup could unfold into a textbook bearish continuation.
---

TRADE UNI EURCADEURCAD (1.61791) - We have taken a short trade upon failure of prices to hold at the 200-day ema. We have a new bearish parabolic switch which is a good level to sell.
Trade Parameters: Sell Entry 1.71791 Stop 1.62500 Target 1.61020

Bullish bounce off?EUR/CAD has bounced off the pivot, which is a pullback support, and could rise to the 1st resistance.
Pivot: 1.6186
1st Support: 1.6119
1st Resistance: 1.6306
Disclaimer:
The above opinions given constitute general market commentary, and do not constitute the opinion or advice of IC Markets or any form of personal or investment advice.
Any opinions, news, research, analyses, prices, other information, or links to third-party sites contained on this website are provided on an "as-is" basis, are intended only to be informative, is not an advice nor a recommendation, nor research, or a record of our trading prices, or an offer of, or solicitation for a transaction in any financial instrument and thus should not be treated as such. The information provided does not involve any specific investment objectives, financial situation and needs of any specific person who may receive it. Please be aware, that past performance is not a reliable indicator of future performance and/or results. Past Performance or Forward-looking scenarios based upon the reasonable beliefs of the third-party provider are not a guarantee of future performance. Actual results may differ materially from those anticipated in forward-looking or past performance statements. IC Markets makes no representation or warranty and assumes no liability as to the accuracy or completeness of the information provided, nor any loss arising from any investment based on a recommendation, forecast or any information supplied by any third-party.

EUR/CAD: Important BreakoutThe EURCAD pair has violated and closed below a significant support level.
A confirmed break of structure suggests a strong likelihood of a continued bearish trend.
The subsequent support level is situated at 1.6180, which could potentially serve as the next target for sellers.

EURCAD SELLHere the price shows a breakout of the resistance and a breakout of the price channel downwards.

Bearish reversal off pullback resistance?EUR/CAD is rising towards the resistance level, which is a pullback resistance that aligns with the 38.2% Fibonacci retracement and could reverse from this level to our take profit.
Entry: 1.62549
Why we like it:
There is a pullback resistance level that lines up with the 38.2% Fibonacci retracement.
Stop loss: 1.6398
Why we like it:
There is a swing high resistance level.
Take profit: 1.60909
Why we like it:
There is a pullback support level that is slightly below the 127.2% Fibonacci extension.
Enjoying your TradingView experience? Review us!
Please be advised that the information presented on TradingView is provided to Vantage (‘Vantage Global Limited’, ‘we’) by a third-party provider (‘Everest Fortune Group’). Please be reminded that you are solely responsible for the trading decisions on your account. There is a very high degree of risk involved in trading. Any information and/or content is intended entirely for research, educational and informational purposes only and does not constitute investment or consultation advice or investment strategy. The information is not tailored to the investment needs of any specific person and therefore does not involve a consideration of any of the investment objectives, financial situation or needs of any viewer that may receive it. Kindly also note that past performance is not a reliable indicator of future results. Actual results may differ materially from those anticipated in forward-looking or past performance statements. We assume no liability as to the accuracy or completeness of any of the information and/or content provided herein and the Company cannot be held responsible for any omission, mistake nor for any loss or damage including without limitation to any loss of profit which may arise from reliance on any information supplied by Everest Fortune Group.
