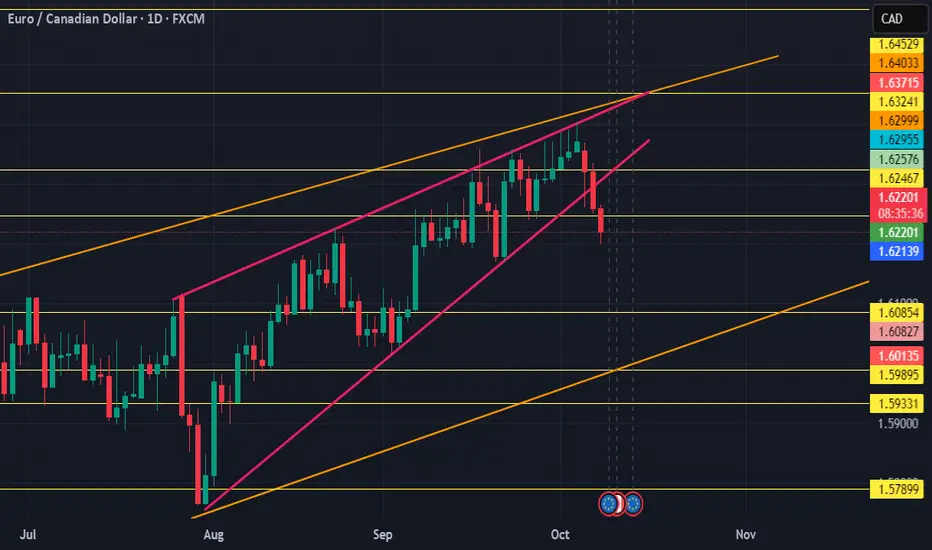
EURCAD – Waiting for the Perfect ConfluenceEURCAD remains overall bullish while trading inside a rising channel.
At the moment, price is approaching the intersection of the channel’s lower trendline and the horizontal structure zone.
That’s where I’ll be watching closely for trend-following long setups, ideally a rejection or reversal confirmation around that confluence area.
As long as this structure holds, the bulls remain in control, and we could see a continuation toward the upper bound of the channel.
⚠️ Disclaimer: This is not financial advice. Always do your own research and manage risk properly.
📚 Stick to your trading plan regarding entries, risk, and management.
Good luck! 🍀
All Strategies Are Good; If Managed Properly!
~Richard Nasr
Trade ideas

EUR/CAD LONG FROM SUPPORT
Hello, Friends!
EUR/CAD pair is trading in a local uptrend which know by looking at the previous 1W candle which is green. On the 9H timeframe the pair is going down. The pair is oversold because the price is close to the lower band of the BB indicator. So we are looking to buy the pair with the lower BB line acting as support. The next target is 1.629 area.
Disclosure: I am part of Trade Nation's Influencer program and receive a monthly fee for using their TradingView charts in my analysis.
✅LIKE AND COMMENT MY IDEAS✅

Going Down-EURCADNow I have my doubts about this trade but I will still present it.
This Forex pair appears to be setting up for a short position.
My supportive reasoning for going short on this trade is the Trend Channel is short on the 1week and the nearest SL is above the EMA 1week while the candles are below it.
The Canadian dollar didn’t have much to report besides a bank holiday to celebrate National day for Truth and Reconciliation
The Canadian dollar would appear to have plenty of open play dates, but due to the recent transpiring of the United States government SHUTTING DOWN they most likely will be affected and I don’t want to get caught in the middle of that situation.
Last week the Euro released data about CPI PMI Employment and Budgets while the European Central Bank President also spoke at two conferences.
All of the data was in line with expectations and the ECB president gave a very strong assessment of the European economy.
To summarize her speeches she said that the ECB is in a much more stable position with their expectations on inflation, growth, and employment. She also mentioned wanting to decrease the impact of non bank involvement in banking activities.
I wonder what would make her say that (cough) FOMC.
Either way this is another economy thats well positioned to entertain risk but unfortunately can’t due to… well you know
(US GOVT SHUTDOWN)
The Market sentiment recently went back up to risk on but it is still in a close enough position to turn risk off with the flip of a switch so I am being mindful of that.
All in All the market has appeared to want to enter into that greed phase for a while now.
For now we will just have to wait and see. Until Next Time.
Prosperous Trading and God Bless

EURCAD Bearish Breakout!
HI,Traders !
#EURCAD made a bearish
Breakout of the rising
Support line and now
I I expect he will return Made a retest of the new
Rising resistance and made
A pullback so we are
Bearish biased and we
Will be expecting a
Further bearish move down !
Comment and subscribe to help us grow !


EURCAD ShortHello everyone.
When I was making my Daily Market Breakdown for today I came across this possible short position on EURCAD.
On the chart we can see that price has showed a big bearish reaction from our 1.64000 level. We got 3 big
daily bearish candles indicating a lot of bearish momentum.
With al this bearish momentum we broke through the 1.62500 zone. This zone was previously used as support and resistance.
Now I am waiting for a pullback into this zone to take a possible short position.
Be carefull: as of now we are rejecting from the 1.62000 level. This is a strong level of support as well.

EUR/CAD: Testing Support with Potential for Bullish CorrectionEUR/CAD is currently testing the 1.6210 support zone following a sharp rejection from the 1.6400 resistance ceiling. Price action is completing an A-B-C corrective structure near the upward support line, suggesting a possible rebound.
As long as 1.6200 holds, a short-term recovery toward the 1.6280–1.6340 area remains likely. The broader structure points to a bullish correction developing within the context of a larger descending trend.

EURCAD REVERSAL BREAK BELLOWPattern Analysis:
The chart clearly forms a Rounded Top (Reversal Pattern) — a typical sign of a transition from bullish to bearish momentum.
The previous uptrend channel (green ascending box) was broken to the downside, confirming a loss of bullish strength.
Price has retested the broken channel and is now rejecting downward, indicating confirmation of a bearish continuation.
⚙️ Key Levels:
Current Price: 1.6203
Immediate Resistance: 1.6250 – 1.6280 (recent retest zone)
Target 1: 1.6110 – 1.6120
Final Target: 1.6050 – 1.6010 (major support zone and lower boundary of previous structure)
Trading Plan Suggestion (for informational purposes only):
> Bias: Bearish
Sell Zone: Around 1.6230 – 1.6260 (if price retests resistance)
Targets:
🎯 1st Target: 1.6110
🎯 Final Target: 1.6050
Stop Loss: Above 1.6300 (to protect from false breakouts)

EURCAD weekly CLS range manipulation shortEURCAD showed the weekly CLS candle range manipulation and likely to go down from key level.

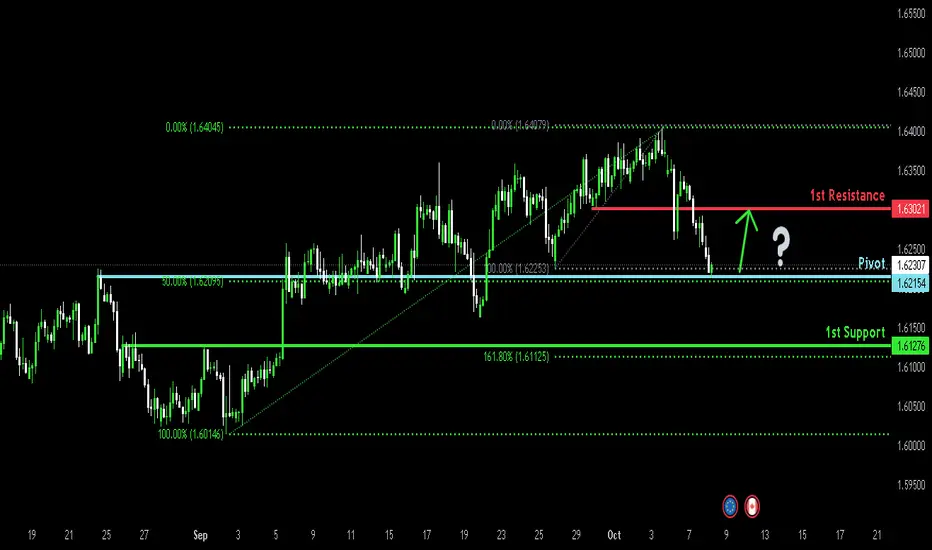
Bullish reversal?EUR/CAD is reacting off the pivot, which has been identified as an overlap support that aligns with the 50% Fibonacci retracement and could bounce to the 1st resistance.
Pivot: 1.62154
1st Support: 1.61276
1st Resistance: 1.63021
Disclaimer:
The above opinions given constitute general market commentary, and do not constitute the opinion or advice of IC Markets or any form of personal or investment advice.
Any opinions, news, research, analyses, prices, other information, or links to third-party sites contained on this website are provided on an "as-is" basis, are intended only to be informative, is not an advice nor a recommendation, nor research, or a record of our trading prices, or an offer of, or solicitation for a transaction in any financial instrument and thus should not be treated as such. The information provided does not involve any specific investment objectives, financial situation and needs of any specific person who may receive it. Please be aware, that past performance is not a reliable indicator of future performance and/or results. Past Performance or Forward-looking scenarios based upon the reasonable beliefs of the third-party provider are not a guarantee of future performance. Actual results may differ materially from those anticipated in forward-looking or past performance statements. IC Markets makes no representation or warranty and assumes no liability as to the accuracy or completeness of the information provided, nor any loss arising from any investment based on a recommendation, forecast or any information supplied by any third-party.
Lingrid | EURCAD False Breakdown Reversal Long SetupThe price perfectly fulfilled my previous idea . FX:EURCAD is testing the 1.6210 support after a sharp rejection from the 1.6400 resistance ceiling. Price action shows an A-B-C corrective structure completing near the upward support line, hinting at potential rebound strength. As long as 1.6200 holds, short-term recovery toward 1.6280–1.6340 remains on the table. The broader setup implies a potential bullish correction inside the larger descending structure.
⚠️ Risks:
A clear break below 1.6200 could extend losses toward 1.6100 support.
Weak euro fundamentals or stronger CAD sentiment could pressure upside recovery.
Volatility around oil prices or ECB commentary may cause intraday trend distortions.
If this idea resonates with you or you have your own opinion, traders, hit the comments. I’m excited to read your thoughts!

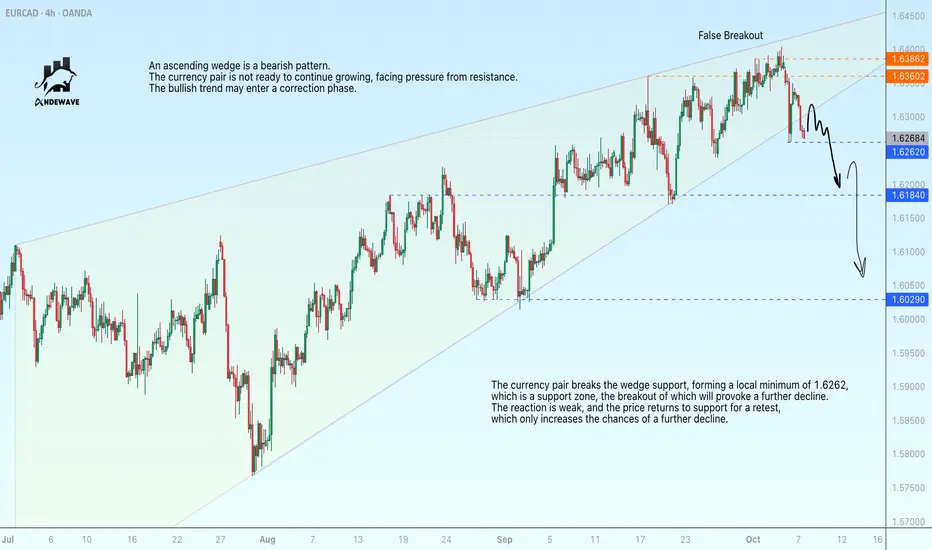
EURCAD is attempting to reverse the trend. Retest of support. The ascending wedge is a bearish pattern. The currency pair is not ready to continue its growth, facing pressure from resistance. The bullish trend may enter a correction phase.
The currency pair breaks the wedge support, forming a local minimum of 1.6262, which is a support zone, the breakout of which will provoke a further decline. The reaction is weak, and the price returns to support for a retest, which only increases the chances of a further decline.
A close below 1.6262 will confirm the trend reversal
eurcad getting ready for 250 pips bearish wave got rejected from long ascending channel range, formed rising wedge in lower time frame, expecting 250 bearish rally once wedge broke towards downside, keep in mind breakout is crucial, don,t enter without breakout

Eurcad sellKeep falling
H1 our last selling idea hited target
Daily support trend breaks
Monthly overbought
Bearish correction continues

EURCAD is in The Bullish TrendHello Traders
In This Chart EURCAD HOURLY Forex Forecast By FOREX PLANET
today EURCAD analysis 👆
🟢This Chart includes_ (EURCAD market update)
🟢What is The Next Opportunity on EURCAD Market
🟢how to Enter to the Valid Entry With Assurance Profit
This CHART is For Trader's that Want to Improve Their Technical Analysis Skills and Their Trading By Understanding How To Analyze The Market Using Multiple Timeframes and Understanding The Bigger Picture on the Charts

EURCAD: How to Trade Liquidity Grab 🇪🇺🇨🇦
EURCAD is testing a significant rising trend line on a daily.
We see a trap and a false violation of that on an hourly time frame.
To confirm that was a liquidity grab, I will look for a CHoCH and
an hourly candle close above 1.6288.
It will provide a strong bullish signal.
An up movement will be expected at least to 1.63175 then.
❤️Please, support my work with like, thank you!❤️
I am part of Trade Nation's Influencer program and receive a monthly fee for using their TradingView charts in my analysis.

EURCAD Will Go Up! Buy!
Please, check our technical outlook for EURCAD.
Time Frame: 9h
Current Trend: Bullish
Sentiment: Oversold (based on 7-period RSI)
Forecast: Bullish
The market is approaching a significant support area 1.628.
The underlined horizontal cluster clearly indicates a highly probable bullish movement with target 1.638 level.
P.S
We determine oversold/overbought condition with RSI indicator.
When it drops below 30 - the market is considered to be oversold.
When it bounces above 70 - the market is considered to be overbought.
Like and subscribe and comment my ideas if you enjoy them!

EURCAD: Will Keep Growing! Here is Why:
The price of EURCAD will most likely increase soon enough, due to the demand beginning to exceed supply which we can see by looking at the chart of the pair.
Disclosure: I am part of Trade Nation's Influencer program and receive a monthly fee for using their TradingView charts in my analysis.
❤️ Please, support our work with like & comment! ❤️
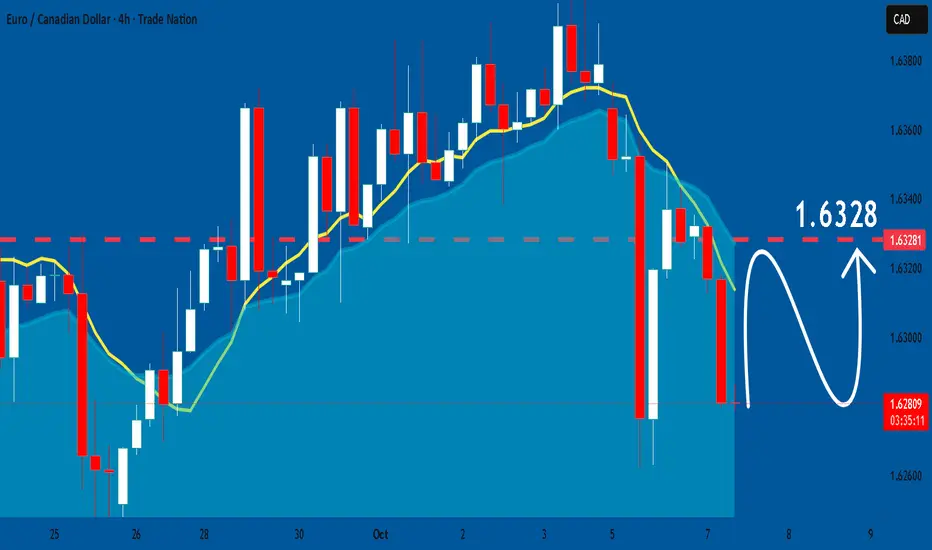
EURCAD Sellers In Panic! BUY!
My dear friends,
Please, find my technical outlook for EURCAD below:
The price is coiling around a solid key level - 1.6329
Bias - Bullish
Technical Indicators: Pivot Points High anticipates a potential price reversal.
Super trend shows a clear buy, giving a perfect indicators' convergence.
Goal - 1.6360
About Used Indicators:
The pivot point itself is simply the average of the high, low and closing prices from the previous trading day.
Disclosure: I am part of Trade Nation's Influencer program and receive a monthly fee for using their TradingView charts in my analysis.
———————————
WISH YOU ALL LUCK


EURCAD H1here is the EURCAD 1H chart,
its an idea. i hope 70% it will going bearish today,
lets see what happen.
thanks

EURCAD bearish wedge shortEURCAD has formed a bearish wedge and squeezing price in a narrow path soon price may go down . More detailed analysis in another graph down.
