Trade ideas

EUR/CAD BEARISH BIAS RIGHT NOW| SHORT
Hello, Friends!
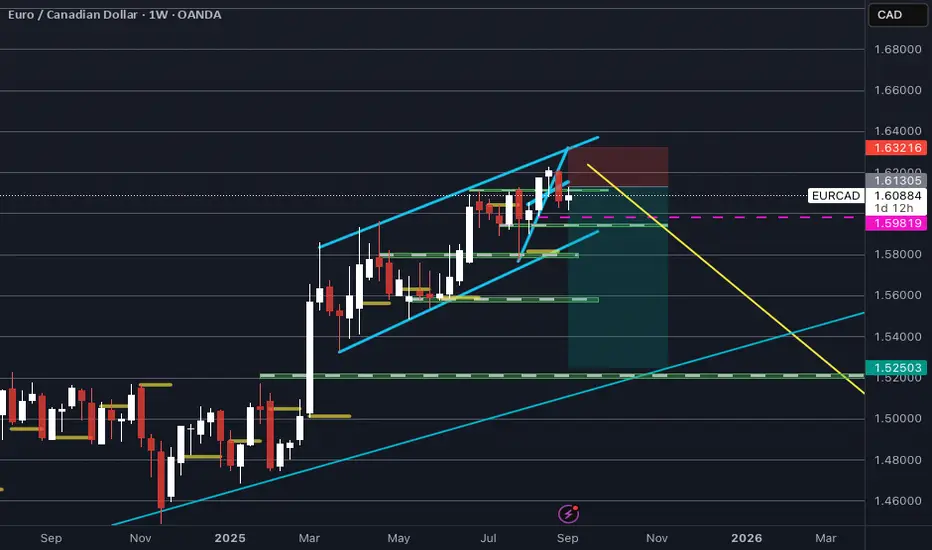
Bearish trend on EUR/CAD, defined by the red colour of the last week candle combined with the fact the pair is overbought based on the BB upper band proximity, makes me expect a bearish rebound from the resistance line above and a retest of the local target below at 1.620.
Disclosure: I am part of Trade Nation's Influencer program and receive a monthly fee for using their TradingView charts in my analysis.
✅LIKE AND COMMENT MY IDEAS✅

Missed a trading opportunity on EURCADHad a busy day and missed this trade entry. A setup that checks out on all my criteria. Previously I will have been bothered all day. But now I see it as one of those things that happen as part of life. Though this does not happen to me very often because I filter the trades I take and always follow the same rules.
Can you relate? And how often has this happened to you?

EURCAD: wedge at the top with bearish divergenceThe EUR/CAD pair has been trading within an ascending channel, but the 4H chart shows a rising wedge pattern, typically a reversal setup. Attempts to sustain above 1.64 have failed so far, while the CCI indicator shows a series of bearish divergences, highlighting weakening bullish momentum.
Technically, the likelihood of a decline after the wedge breakout is high. Initial targets lie at 1.6260, followed by 1.6080, and deeper at 1.5780. A retest of the broken level (re-entry) is possible before the downward move accelerates.
From a fundamental perspective, the euro remains pressured by weak macro data and a cautious ECB, while the Canadian dollar is supported by stable oil prices and a firm Bank of Canada stance. This divergence in fundamentals strengthens the bearish case.
It’s a classic situation where the market tempts traders into expecting a reversal, but confirmation is still required. As always, emotions aside — we wait for clear signals before acting.

Strong selling eurcadMonthly, weekly, daily overbought market
Strong bearish correction expected now
Selling confirmation by breaking the m30 inner support trend

EURCAD A Fall Expected! SELL!
My dear friends,
My technical analysis for EURCAD is below:
The market is trading on 1.6384 pivot level.
Bias - Bearish
Technical Indicators: Both Super Trend & Pivot HL indicate a highly probable Bearish continuation.
Target - 1.6339
About Used Indicators:
A pivot point is a technical analysis indicator, or calculations, used to determine the overall trend of the market over different time frames.
Disclosure: I am part of Trade Nation's Influencer program and receive a monthly fee for using their TradingView charts in my analysis.
———————————
WISH YOU ALL LUCK

EURCAD Short Trade SetupTrend: Bullish
Divergence: Bearish
Continuation Pattern: None
Reversal Pattern: Falling Wedge
Bias: Bearish
Scenario: Buy Stop at LH and Wedge Break out
Trade Plan
Stop Loss : 1.6396
Entry Level: 1.6321
TP1: 1.6246

Possible trend continuation on EURCADLooking at the swing direction, a higher high has been formed. It is possible for price to retrace to the indicated buy zone to form a higher low.

EURCAD Technical & Order Flow AnalysisOur analysis is based on a multi-timeframe top-down approach and fundamental analysis.
Based on our assessment, the price is expected to return to the monthly level.
DISCLAIMER: This analysis may change at any time without notice and is solely intended to assist traders in making independent investment decisions. Please note that this is a prediction, and I have no obligation to act on it, nor should you.
Please support our analysis with a boost or comment!

EURCAD Bearish SetupTrend: Bullish
Divergence: Bearish
Continuation Pattern: None
Reversal Pattern: Double Top
Bias: Bearish
Scenario: Sell Stop at neck line breakout
Trade Plan
Stop Loss : 1.638
Entry Level: 1.6295
TP1: 1.621

eurcad setting up for a sellaccording to my range theory, we should be expecting a downward move to 1.53. Stops should be above 163.400
EURCAD | Wave E CompletedResistance: 1.6350 – 1.6360 (wave e top)
Sell Target: 1.6322 (first liquidity level)
Further downside possible if breakdown continues.
🔎 Elliott Wave Perspective:
ABCDE correction looks complete.
Market preparing for next impulsive leg down.
⚡ Bias: Bearish below 1.6360
🎯 Targets: 1.6322 / 1.6270 / lower liquidity
📌 Invalidation: Break & close above 1.6370
---

Nice clean zone EURCAD currency pair recently reversed up from the key support level 1.6200 (former monthly high from August) intersecting with the 20-day moving average and the 50% Fibonacci correction of the upward impulse from the start of September.

EURCAD: Pullback Depth Depends on Euro Data📊 EURCAD has been trending strongly to the upside, and my overall bias remains bullish 📈.
📰 That said, we have a key data release scheduled within the next hour or two that could provide direction for the euro.
🔎 If the data is positive for the euro, I’d expect only a shallow pullback before continuation. If the data comes out negative, we could see a deeper retracement before buyers step back in.
📈 Despite this, the higher timeframe structure is firmly bullish. My plan is to wait for the news release, watch for the pullback, and on the 30-minute chart, look for a bullish break of market structure to time an entry 🚀.
⚠️ Disclaimer: This analysis is for educational purposes only and not financial advice. Always trade responsibly and manage risk appropriately.

EURCAD: Trend ContinuationA cautious trade for this week's open, expecting volatility to remain low on a Sunday night.
Daily Timeframe
Price is in an uptrend as EMA20 remains above EMA60, and price is also bouncing off of EMA20
Price recently broke above the HTL marked
H1 Timeframe
Price is accelerating away from the EMA20, and EMA20 is expanding away from EMA60
Price also crossed above the DTL

EURCAD is in The Bullish TrendHello Traders
In This Chart EURCAD HOURLY Forex Forecast By FOREX PLANET
today EURCAD analysis 👆
🟢This Chart includes_ (EURCAD market update)
🟢What is The Next Opportunity on EURCAD Market
🟢how to Enter to the Valid Entry With Assurance Profit
This CHART is For Trader's that Want to Improve Their Technical Analysis Skills and Their Trading By Understanding How To Analyze The Market Using Multiple Timeframes and Understanding The Bigger Picture on the Charts

Uptrend in eurcadCurrently, the EURCAD trend is bullish, but since it is involved in swap fl ranges, we should wait for better confirmation before entering trades.

Eur/Cad climbing up to the next week targetThe price is now trading below the previouse day higher high, with a promise retest at the seing of the previous wave and a target above the previous higher high price level
More Details on yhe chart
by #SMRAnalytics

EURCAD ENTRY CHARTOn this Pair, we are still BULLISH, as our Intra-day Trend is still BULLISH,in spite of the RETRACEMENT, we have price sitting on a DEMAND zone, but an engineer LIQUIDITY that was created near the ZONE, we had our confirmation intact, If this matches up with your idea, we advice you apply a proper risk management on th setup. and move BREAKEN after +1R. Thank You.

EURCAD Bearish OutlookEURCAD will fall to the support at 0.624. A bearish flag pattern is forming on the 1hr chart.

EURCAD: Strong Bearish PatternIt appears that there is a significant likelihood of a decline in the 📉EURCAD pair in the near future.
The formation of a head and shoulders pattern following a test of a crucial resistance level, along with a subsequent breakout of its neckline, suggests a robust bearish signal.
The target is 1.6226.

EUR/CAD BEARS WILL DOMINATE THE MARKET|SHORT
EUR/CAD SIGNAL
Trade Direction: short
Entry Level: 1.632
Target Level: 1.625
Stop Loss: 1.636
RISK PROFILE
Risk level: medium
Suggested risk: 1%
Timeframe: 9h
Disclosure: I am part of Trade Nation's Influencer program and receive a monthly fee for using their TradingView charts in my analysis.
✅LIKE AND COMMENT MY IDEAS✅

EurCad Trade IdeaWith EurCad flipping bearish on the higher time frame and respecting the previous high I personally wanted to see price shift on the smaller time frames to confirm our bearish move. I seen price made a HL on the 1hr time frame before tapping into the daily resistance (blue line above). Entry for me was the break and retest of the last low to confirm a bearish set up. Looking for a 1:3rr on this set up. If all goes well we could expect price to tap back into the new daily low.
