Eurcad: up we goThe uptrend is dominating. From my perspective, I’m thinking of taking a small risk on this long. Small capital, small RR.
Trade ideas
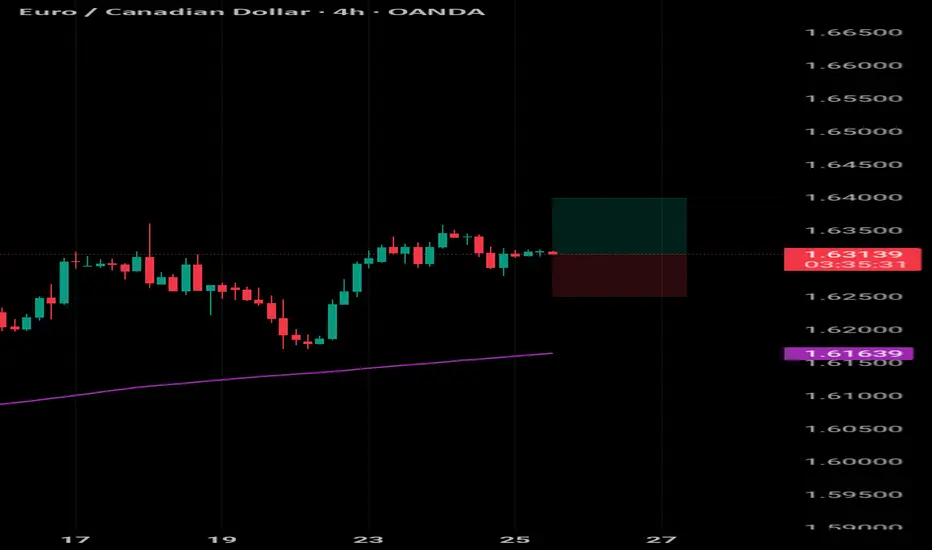
EUR/CAD – 15m Supply Zone SetupOn the EUR/CAD 15m, I’m currently watching the supply zone around 1.6330 – 1.6340. Price has not yet tested this area, but I’ll be monitoring closely for a possible reaction.
🔹 Key Notes:
The supply zone sits just above current price, and if tapped, could provide a shorting opportunity.
Structure has already shown signs of weakness, with a market breakdown (MB) marked below.
A rejection from supply would set up clean downside targets.
🔹 Bearish Targets:
TP1 – 1.62815
TP2 – 1.62520
TP3 – 1.61756

EURCAD | Bullish ContinuationEURCAD is in bullish continuation pattern.Although there is bearish divergence but it has diluted the divergence.


SELL EURCAD 24.9.2025Confluence order: SELL at M15
Type of entry: Limit order
Reason:
- The current BOTTOM is not touching anything, expected to decrease to the sub-key of H1
- Confluence of two timeframes is M15 and H1.
Note:
- Management of money carefully at the price of bottom of M15 (1,62978)
Set up entry:
- Entry sell at 1,63074
- SL at 1,63159
- TP1: 1,62978 (~>1R)
- TP2: 1,62812 (~3R)
Trading Method: Price action (No indicator, only trend and candles)


EURCAD SELL SCENARIOWe talked about this pair last week and the price played very well on our scenario. This week the price reached the recent supply zone. Possible to the price reject the zone and fall to the last week zones.

EURCAD short move
Price had broken the support level, a further drop, cloud result a retracement that will leads to more downward movement in price.

EURCAD Wave Analysis – 23 September 2025
- EURCAD reversed from key support level 1.6200
- Likely to rise to resistance level 1.6365
EURCAD currency pair recently reversed up from the key support level 1.6200 (former monthly high from August) intersecting with the 20-day moving average and the 50% Fibonacci correction of the upward impulse from the start of September.
The upward reversal from the support level 1.6200 continues the active impulse wave 3 which belongs to the extended upward impulse sequence (5) from May.
Given the clear daily uptrend, EURCAD currency pair can be expected to rise to the next resistance level 1.6365 (target price for the completion of the active impulse wave 3).

EURCADBias: Bullish.
Structure: Market has shown a strong impulsive move upward from support, breaking through resistance.
Current Price: Trading above the intended entry zone — setup is not yet triggered.
Plan: Place a Buy Limit order at the identified demand/FVG zone. Wait for price to retrace into that zone before activation.
Stop Loss: Positioned below the support/FVG zone to invalidate the setup if price breaks lower.
Target: Next resistance or liquidity pool above (progressive TP1, TP2).
Reasoning: Buying the dip, aligning with momentum and structure, capturing continuation of the bullish leg with a favorable risk-to-reward.

EURCAD: Swing Trading & Technical Analysis
The analysis of the EURCAD chart clearly shows us that the pair is finally about to tank due to the rising pressure from the sellers.
Disclosure: I am part of Trade Nation's Influencer program and receive a monthly fee for using their TradingView charts in my analysis.
❤️ Please, support our work with like & comment! ❤️

EURCAD Long Trade OANDA:EURCAD Long Trade
Entry: 1.61766 - 1.61890
TP-1: 1.62120
TP-2: 1.62266
This is good trade.
Don't overload your risk like Greedy gambler!!!
Be Disciplined Trader, risk what you can afford.
Use proper risk management.
Disclaimer: Trading is risky, only idea, not advice.

EURCAD!We are bearish on this.
This could be a reversal pattern.
we dont trade unless we see a better familiar pattern.

EURCAD Sell Reaction from FVG ZonePrice has made a strong push up and is now heading towards the FVG retracement zone.
This area is a potential supply zone where sellers may step in.
📉 My expectation → pullback move towards 1.62264.
If price rejects from the FVG, we could see a continuation to the downside.
I will be watching how candles react when price touches that retracement zone for confirmation.

EURCAD Breakout and Retest , All Eyes on SellingHello Traders
In This Chart EURCAD HOURLY Forex Forecast By FOREX PLANET
today EURCAD analysis 👆
🟢This Chart includes_ (EURCAD market update)
🟢What is The Next Opportunity on EURCAD Market
🟢how to Enter to the Valid Entry With Assurance Profit
This CHART is For Trader's that Want to Improve Their Technical Analysis Skills and Their Trading By Understanding How To Analyze The Market Using Multiple Timeframes and Understanding The Bigger Picture on the Charts

Idea on a chartGreat chart idea ICT set up next week.Attention now shifts to today’s inflation report. Headline CPI has slowed to 1.7% y/y, but core CPI remains at 2.6%, the upper end of the BoC’s target band. Meanwhile, trimmed mean inflation at 3.0% and median CPI at 3.1% remain uncomfortably high for doves.
Counterintuitively, the Canadian dollar could weaken if trimmed mean and median CPI linger deeper into the 3% range, as that would raise stagflation concerns and revive expectations for further BoC cuts. Conversely, even a modest cooling in these measures could give the BoC breathing space to be more cautious with its dovish messaging, potentially lifting the Canadian dollar.

EURCAD--SHORT--Bearish bias
--downward movement from the upper boundar of a channel.
--Also check the monthly chart I published and added below.
--tp and entry levels are as shown on chart


EURCAD – Wave Analysis OutlookEURCAD showing strong signs of reversal:
RSI divergence across all timeframes ✅
Pin bar rejection visible on multiple timeframes ✅
Can’t ask for a cleaner short setup than this. I’ll be watching closely for continuation lower with next downside targets lining up near 1.59 and below.
👉 What do you think — agree this is the best short setup we’ve seen recently?
⚠️ Disclaimer: This outlook is based on my personal wave analysis and is shared for educational purposes only. It is not financial advice.

The overall trend is bullish but in the short term it is bullishCurrently, the trend of this currency pair is completely bullish, but in the short term it is bearish. We can expect a bearish position by correcting the position to reach the demand limits.


EURCAD SELL SCENARIOEuro start to get weaker price is below the last demand zone and already rejected the zone few times. It is possible to see the price fall to the the next demand zone at 1.62018-1.61795

EURCAD: Long Signal Explained
EURCAD
- Classic bullish pattern
- Our team expects retracement
SUGGESTED TRADE:
Swing Trade
Buy EURCAD
Entry - 1.6217
Stop - 1.6201
Take - 1.6247
Our Risk - 1%
Start protection of your profits from lower levels
Disclosure: I am part of Trade Nation's Influencer program and receive a monthly fee for using their TradingView charts in my analysis.
❤️ Please, support our work with like & comment! ❤️
