SELL CHANCEENTRY TO SELL = IF THE BLUE ZONE IS BROKEN DOWN
TP IS SHOWN IN FIG
SL = ABOVE THE BLUE ZONE
EUXNOK trade ideas

EUR/NOK Price Action Study For study and educational purposes of price action. Price reached an all time high in late October, and pulled back/sold to the point noted within the ascending channel. Price action study for possible continuation back towards previous recent high and possibly higher. Studying Price action at noted zones for movement towards higher highs or either exhaustion of bullish momentum and subsequent drop, in accordance with ascending wedge structure. I am more inclined to think we will see a continuation up towards the most recent high before a drop further. However, study of price action will tell.

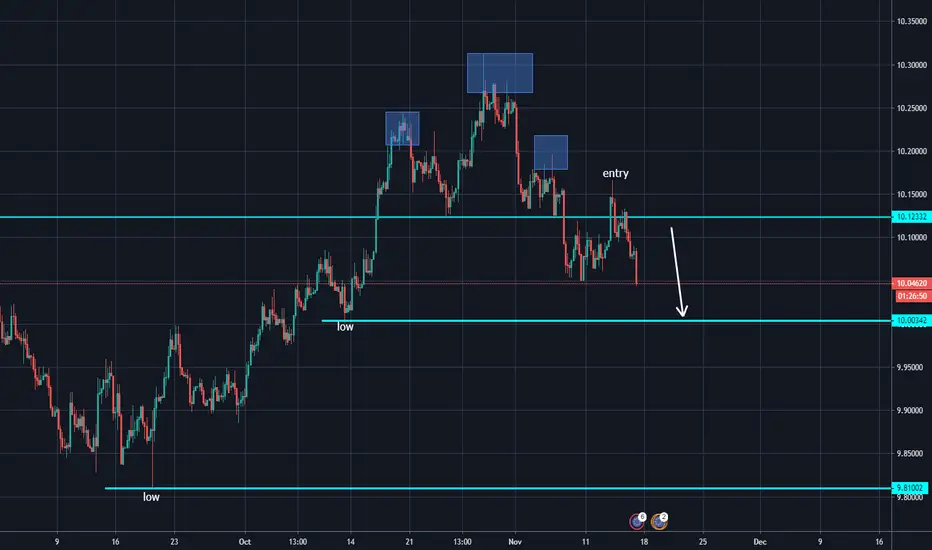
EURNOK - intraday updateYesterday I posted an idea to short this pair.
Here is the status of the structure.
Expecting a running flat before the move will happen.
Good luck!

EURNOK: Buy opportunity on the Rising Wedge.The pair is trading within a 1W Rising Wedge (RSI = 59.298, MACD = 0.080, Highs/Lows = 0.0000). Yesterday not only it made contact with the Higher Low trend line, but also touched the 1D MA50 (blue line). This indicates that the price has more probabilities to rebound towards a new Higher High. Our Target Zone is 10.400 - 10.500.
** If you like our free content follow our profile (www.tradingview.com) to get more daily ideas. **
Comments and likes are greatly appreciated.


EUR NOK D1 Worth putting on watch list for possible short EURNOK on D1 has broken down below and retested 21D EMA (shown on chart). It's also below (having retested) significant area of SR going back to early August. A break below 10.02 area could take us to 9.9 and 9.8. Resistance levels at 10.07. Daily RSI and MACD are pointing down.

EURNOKWaiting for an entry signal.
Aggressive trade - enter at the 50 fibo
Conservative - wait for a candle formation pattern, e.g. engulfing candle.
Extra conservative - wait for price action formation, e.g. double bottom.

EURNOK IS GOING TO FALLEURNOK has broken the trend line and we are waiting for the retest onto this strong zone so that we can short this trade

EURNOK HEAD AND SHOULDERS - BEARISHWaiting for price to break both the Head and Shoulders Pattern and more Importantly the Ascending Channel, this Advanced pattern is invalid if price doesn't continue to break below this Parallel Channel. There's a chance price can Respect its channel and the market will Reverse Bullish, that is why it is so important we let price work its course and we will enter when price is showing us a continuation (Candle Sticks).

38.2% & POSSIBLE 61.8% Retracement LONG GWAVE38.2% & POSSIBLE 61.8% Retracement LONG GWAVE.
FIB Retracement Percentage is calculated in a Higher Cartesian and or Euclidean Dimension.
PLEASE ALWAYS WAIT FOR STOCHASTIC CONFIRMATION!!! THANKS


EURNOK UpdateThis has been an awesome pair this week just closed off to end the week. Still looking at the lows for future movements and another entry in next weeks market.
All head and shoulders trader I hope saw the break and retest with a sell confirmation candle. The pair is slower than others but the moves are good. The gut said take and go so trade is close with the break of the low area before we see a reversal.
Nov12 s3.tradingview.com


BUY CHANCEENTRY TO BUY = IF YOU SEE A REVERSAL PATTERN NEAR THE RED ZONE
TP IS SHOWN IN FIG
SL = BELOW THE RED ZONE
DO U AGREE WITH ME??!


Euro finding support against Norwegian kroneThe EUR/NOK pair is a bit exotic, but it does give an insight as to how the Euro is doing in relative strength against crude oil. After all, the Norwegian krone is highly susceptible to pricing of crude oil, so this is an interesting and informative commodity pair. Looking at this chart, the EUR/NOK pair has tested the 10.05 level which was previous resistance, and now looks to be supportive.
The 50 day EMA is currently just below the trading over the last couple of days and hanging about the 10.05 NOK level. At this point, it looks as if the market is trying to form an inverted hammer, so a break above the highs from the trading session on Friday could send this market back towards the highs at the 10.28 level. Alternately, if the market was to break down below the 10 NOK level, then the market reaches down to the 9.88 level where the 200 day EMA sits. That being said though, the market is very likely to continue to grind higher based upon the overall trend, unless of course the Euro breaks down against currencies around the world in general. One of the greatest barometers will be the EUR/USD pair, which although bearish, isn’t necessarily breaking apart. At the same time, we would need to see serious strength in the crude oil market which has been basically range bound for the last several months although quite a bit of volatility has accompanied that. At this point, this is a market that can be used to trade directly, or to get an idea as to how to trade the Euro in general, and even crude oil as there are so many different inflections in this chart by the various bits and pieces that go in to pricing it.


EURNOK Head and Shoulder After the EURNOK broke the neckline of the head and shoulders It may go to 9.95 area.
