EUSTX50 Short Position AnalysisFX:EUSTX50
Long positions are officially caught in the market, with new structure forming below the recent high.
The current focus is now on internal liquidity and potencial absorption zones.
What traders are saying


stoxx is bearish temporarily index is reaching to resistance and if respect it will be heading south for its target

EuroStoxx 50: the market corrects, but still far from panicBy Ion Jauregui – Analyst at ActivTrades
European stock markets are going through a phase of contained correction in an increasingly tense geopolitical context, marked by the diplomatic clash between the United States and the European Union following Donald Trump’s threats regarding Greenland and the possible imposition of new tariffs. Even so, the market, for now, is clearly avoiding “panic mode.”
From the January highs, the EuroStoxx 50 is correcting by around 2.5%, a move that is starting to unsettle shorter-term investors, but which remains very moderate when analysed in historical perspective. It is enough to recall that in recent episodes, such as the so-called “Liberation Day” last year, the index fell by close to 13%, more than tripling the current correction.
Flows into safe-haven assets, especially gold, confirm that there is concern, but not capitulation. Capital is not leaving equities in a disorderly manner; instead, exposure is being adjusted and tactical risk reduced in response to rising political and trade uncertainty. The recent slump in sectors such as utilities, particularly sensitive to regulatory and geopolitical noise, is a clear example of this selective behaviour.
From a broader perspective, the major corrections of the past five years have averaged close to 9%, occurring in much more extreme contexts: the inflation crisis, aggressive interest-rate hikes, the war in Ukraine, tensions in the banking system, or disruptions in the currency market. Against that backdrop, the current adjustment in the EuroStoxx 50 still fits within a normal consolidation phase following a mature bullish run.
Technical Analysis EuroStoxx 50 (Ticker AT: EURO50)
From a technical standpoint, with a long-term bullish trend, the European index had broken through relevant resistance levels at the beginning of the year, reinforcing the idea that the current declines are more a digestion of gains than a structural change in trend. As long as the key supports built in November are not lost, the underlying bias remains bullish. These types of corrections, in the absence of severe macro deterioration or a fully unleashed trade war, tend to act as rebalancing zones rather than a prelude to a bear market. Risk exists and should not be ignored, but price behaviour remains consistent with a market that is adjusting expectations, not entering panic.
Looking at the chart, the 50-day moving average support was lost in yesterday’s session, and the market opened positive but still without the strength required to recover the highs area this week. The RSI stands in the mid-zone at 53.50%, and the MACD is in correction, still positive but with a red histogram, confirming the thesis of increased European risk volume, with the ActivTrades Europe Market Pulse indicator still trending higher after the pullback from highs. The point of control around 5,735 points, a previous consolidation area, could confirm the plausible scenario of a return to that prior consolidation zone if the 100-day moving average is lost. If this level holds, a new test of highs could follow.
European Countermeasures
The EuroStoxx 50 faces a complex environment, with geopolitics, tariff threats and sectoral volatility, but the magnitude of the correction does not yet justify extreme interpretations. As long as the market does not begin to lose key technical levels and uncertainty does not translate into concrete measures, the base scenario remains one of controlled corrections within a still constructive primary trend. Much will depend on the European response to tariff conflicts and the potential application of a “bazooka of European protection measures,” which could affect both economies very sharply. For now, attention turns to corporate earnings to see whether the data support a renewed upside test. Among these are ASML, SAP, Siemens, TotalEnergies, LVMH, Bayer and Allianz, among others, which could drive or consolidate a sideways phase in the index.
*******************************************************************************************
The information provided does not constitute investment research. The material has not been prepared in accordance with the legal requirements designed to promote the independence of investment research and such should be considered a marketing communication.
All information has been prepared by ActivTrades ("AT"). The information does not contain a record of AT's prices, or an offer of or solicitation for a transaction in any financial instrument. No representation or warranty is given as to the accuracy or completeness of this information.
Any material provided does not have regard to the specific investment objective and financial situation of any person who may receive it. Past performance and forecasting are not a synonym of a reliable indicator of future performance. AT provides an execution-only service. Consequently, any person acting on the information provided does so at their own risk. Political risk is unpredictable. Central bank actions can vary. Platform tools do not guarantee success.

EUR50 Index Wave Analysis – 19 January 2026
- EUR50 Index reversed from resistance area
- Likely to fall to support level 5900.00
EUR50 Index recently reversed from the resistance area between the resistance level 6040.00, upper daily Bollinger Band and the resistance trendline of the daily up channel from December.
The downward gap from this resistance area stopped the earlier impulse waves 5 and (3).
Given the strength of the resistance level 6040.00 and the overbought daily Stochastic, EUR50 Index can be expected to fall to the next support level 5900.00.

The Euro Stoxx 50 Index Reaches a Record HighThe Euro Stoxx 50 Index Reaches a Record High
As the charts show, the Euro Stoxx 50 price climbed above 6,055 points today, thereby setting a new all-time high.
Bullish sentiment is being supported by expectations of ECB interest rate cuts in 2026 and other fundamental factors, including:
→ News from China. Data released today have fuelled optimism about China’s economy, with Europe being one of its key trading partners.
→ Rising defence-sector stocks amid geopolitical tensions. For example, Rheinmetall shares have gained around 20% since the start of 2026.
An analysis of the Euro Stoxx 50 chart shows that:
→ price fluctuations are forming an ascending channel, with the price often remaining in its upper half (evidence of strong demand);
→ earlier this week, the price encountered resistance around the 6,040-point level. Today’s breakout above this level (marked by an arrow) may have attracted new buyers, pushing the price even higher.
It cannot be ruled out that today’s break to record highs may form another support zone (two similar zones are highlighted on the chart), helping bulls to maintain the trend.
On the other hand, some analysts point to significant market overbought conditions. As a result, a pullback towards the lower boundary of the channel remains a possible scenario.
How the Euro Stoxx 50 index moves next will largely depend on shifts in the unpredictable news backdrop. Note that today the US Supreme Court may rule Trump’s tariff policy — which also affects trade with Europe — unlawful.
This article represents the opinion of the Companies operating under the FXOpen brand only. It is not to be construed as an offer, solicitation, or recommendation with respect to products and services provided by the Companies operating under the FXOpen brand, nor is it to be considered financial advice.


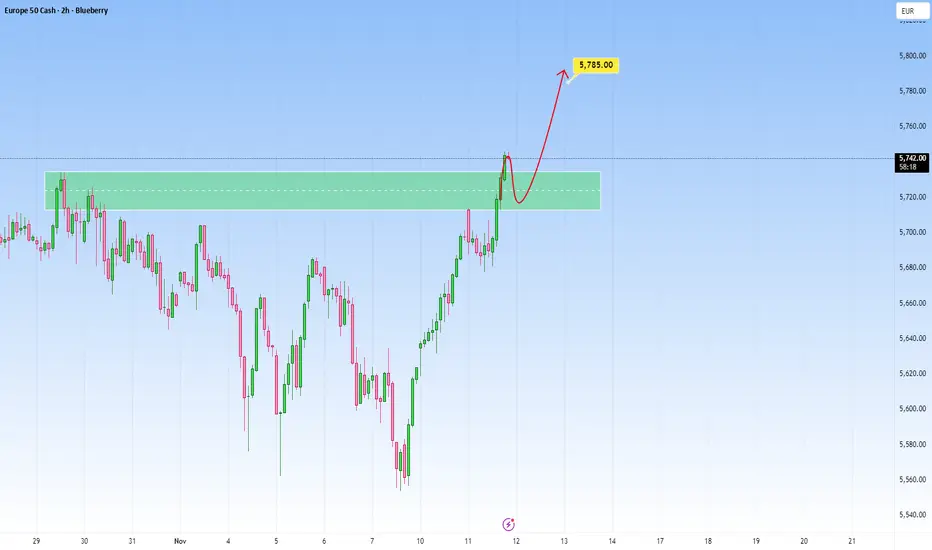
SPOXX50: Watching for the next impulse HigherPrice has been pushing higher with strong momentum, just recently breaking above the resistance zone.
By the looks of it, I’d expect a slightly deeper pullback into the zone before the next leg up, so I’d wait for that move first.
And as long as price holds above this area, the overall structure remains bullish and a continuation toward 5,785 has got high chances.
📈 Bias: Bullish, but expecting a deeper pullback
🎯 Target: 5,785
🛑 Invalidation: Below the zone
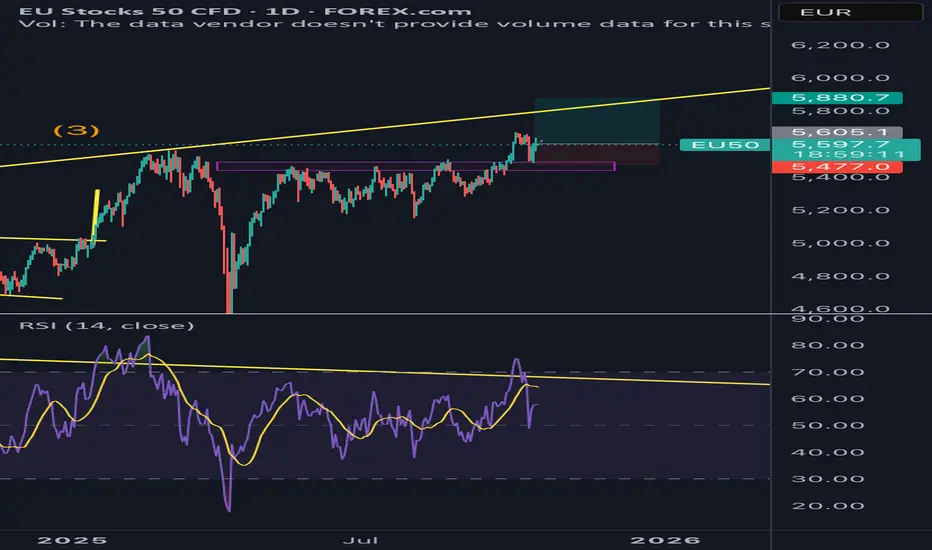
Euro Stoxx 50 – The “Beautiful Mountains” of buying oppsTake a look at this chart — if you squint, you can almost see two beautiful .... Anyways!
Price is sitting above both the 20MA and 200MA, and that breakout above the neckline points to a clear target at 6,112.
Stay patient, enjoy the view, and keep your stop tight just in case the “weather” turns. 😉
Here is something to think about - with your daily trading psych
~ The first drop traps early sellers.
~ The recovery and retest shake out weak hands.
~ The breakout confirms strength — it’s buyers reclaiming control.
~ In short: it’s the market saying, “Nice try bears, we’re going uphill from here.” 🐻➡️🐂
🌍 Fundamental Support
📉 Cooling Inflation:
Improving sentiment across Europe boosts stock performance.
🏦 Rate Relief Hopes:
ECB’s cautious stance encourages risk-on positioning.
📈 Strong Earnings Season:
Key European corporates are beating expectations.
💶 Capital Flows:
Investors rotating back into Eurozone blue chips.
Disclosure: I am part of Trade Nation's Influencer program and receive a monthly fee for using their TradingView charts in my analysis.

Continuation setup in Euro stock What’s good everyone ! , here I share a bullish continuation setup in Euro Stock .
LFG.
Falling channelThe price has broken out of a falling channel, followed by a pullback, now the price looks to make a higher high, to confirm the bullish sentiment.
WE ONLY TRADE PULLBACKS
Comment your thoughts
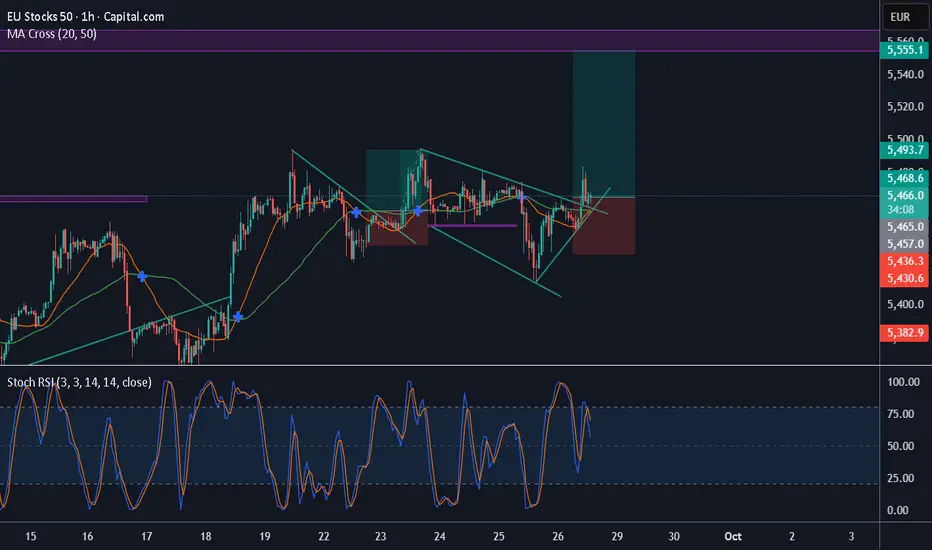
EU50 | H2 Head and shoulders | GTradingMethod👋 Hello Traders,
There is a potential head and shoulders continuation pattern at play.
All my variables have been met and I have opened a short on the EU50.
If the current H2 candle closes above the range, I will close my short position.
Also, stop loss is at 5432.9 in case the H2 candle just blows straight through my entry level and invalidates the head and shoulders pattern.
Bulls do look strong and I was hesitant to enter the trade but my system flagged it and I need to enter every trade, otherwise probability won't play out in my favour.
📊 Trade Plan:
Risk/reward = 5.4
Entry price = 5409
Stop loss price = 5432.9
Take profit level 1 (50%) = 5310
Take profit level 2 (50%) = 5265
💡 GTradingMethod Tip:
Consistency is key. If your system gives a signal, take it — one missed trade can be the difference between your probabilities playing out or missing your edge entirely.
🙏 Thanks for checking out my post!
Make sure to follow me to catch the next idea and share your thoughts — I’d love to hear them.
📌 Please note:
This is not financial advice. This content is to track my trading journey and for educational purposes only.

ESTX50 Bullish SetupESTX50 Bullish Setup
Risk Reward 1:1
Setup based on Moving Average and Bullish Daily bias.

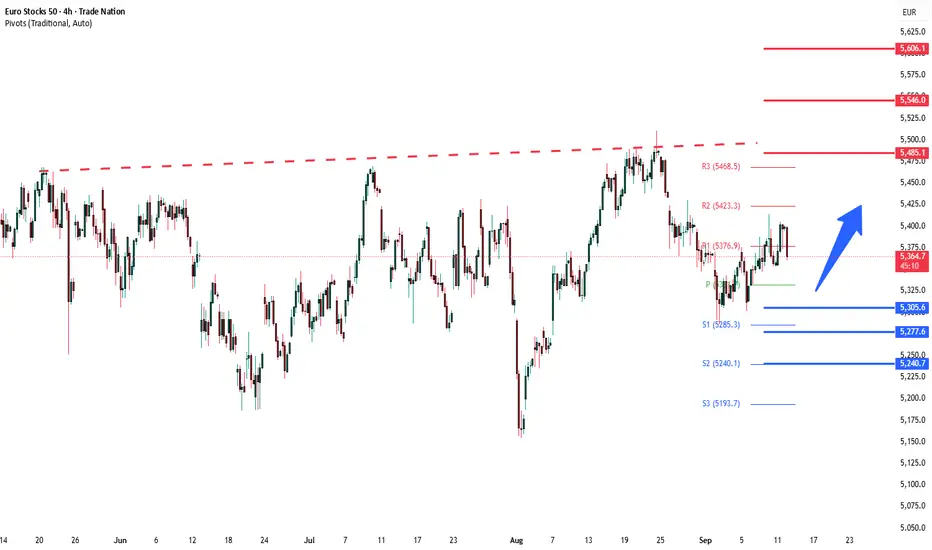
STOXX50 Key Trading LevelsKey Support and Resistance Levels
Resistance Level 1: 5488
Resistance Level 2: 5546
Resistance Level 3: 5605
Support Level 1: 5306
Support Level 2: 5277
Support Level 3: 5240
This communication is for informational purposes only and should not be viewed as any form of recommendation as to a particular course of action or as investment advice. It is not intended as an offer or solicitation for the purchase or sale of any financial instrument or as an official confirmation of any transaction. Opinions, estimates and assumptions expressed herein are made as of the date of this communication and are subject to change without notice. This communication has been prepared based upon information, including market prices, data and other information, believed to be reliable; however, Trade Nation does not warrant its completeness or accuracy. All market prices and market data contained in or attached to this communication are indicative and subject to change without notice.

Stoxx50 Key Trading LevelsKey Support and Resistance Levels
Resistance Level 1: 5488
Resistance Level 2: 5546
Resistance Level 3: 5605
Support Level 1: 5306
Support Level 2: 5277
Support Level 3: 5240
This communication is for informational purposes only and should not be viewed as any form of recommendation as to a particular course of action or as investment advice. It is not intended as an offer or solicitation for the purchase or sale of any financial instrument or as an official confirmation of any transaction. Opinions, estimates and assumptions expressed herein are made as of the date of this communication and are subject to change without notice. This communication has been prepared based upon information, including market prices, data and other information, believed to be reliable; however, Trade Nation does not warrant its completeness or accuracy. All market prices and market data contained in or attached to this communication are indicative and subject to change without notice.
Stoxx50 capped at 5488 resistance Key Support and Resistance Levels
Resistance Level 1: 5488
Resistance Level 2: 5546
Resistance Level 3: 5605
Support Level 1: 5306
Support Level 2: 5277
Support Level 3: 5240
This communication is for informational purposes only and should not be viewed as any form of recommendation as to a particular course of action or as investment advice. It is not intended as an offer or solicitation for the purchase or sale of any financial instrument or as an official confirmation of any transaction. Opinions, estimates and assumptions expressed herein are made as of the date of this communication and are subject to change without notice. This communication has been prepared based upon information, including market prices, data and other information, believed to be reliable; however, Trade Nation does not warrant its completeness or accuracy. All market prices and market data contained in or attached to this communication are indicative and subject to change without notice.


EU50 Wave Analysis – 25 August 2025
- EURNZD reversed from multi-month resistance level 5500.00
- Likely to fall to support level 5400.00
EU50 index recently reversed from the resistance area surrounding the key multi-month resistance level 5500.00, which has been repeatedly reversing the price from February.
This resistance area was further strengthened by the nearby upper daily Bollinger Band.
Given the strength of the resistance level 5500.00 and the overbought daily Stochastic, EU50 index can be expected to fall to the next support level 5400.00.
EShort

Stoxx50 resistance retest at 5488Key Support and Resistance Levels
Resistance Level 1: 5488
Resistance Level 2: 5546
Resistance Level 3: 5605
Support Level 1: 5370
Support Level 2: 5306
Support Level 3: 5240
This communication is for informational purposes only and should not be viewed as any form of recommendation as to a particular course of action or as investment advice. It is not intended as an offer or solicitation for the purchase or sale of any financial instrument or as an official confirmation of any transaction. Opinions, estimates and assumptions expressed herein are made as of the date of this communication and are subject to change without notice. This communication has been prepared based upon information, including market prices, data and other information, believed to be reliable; however, Trade Nation does not warrant its completeness or accuracy. All market prices and market data contained in or attached to this communication are indicative and subject to change without notice.

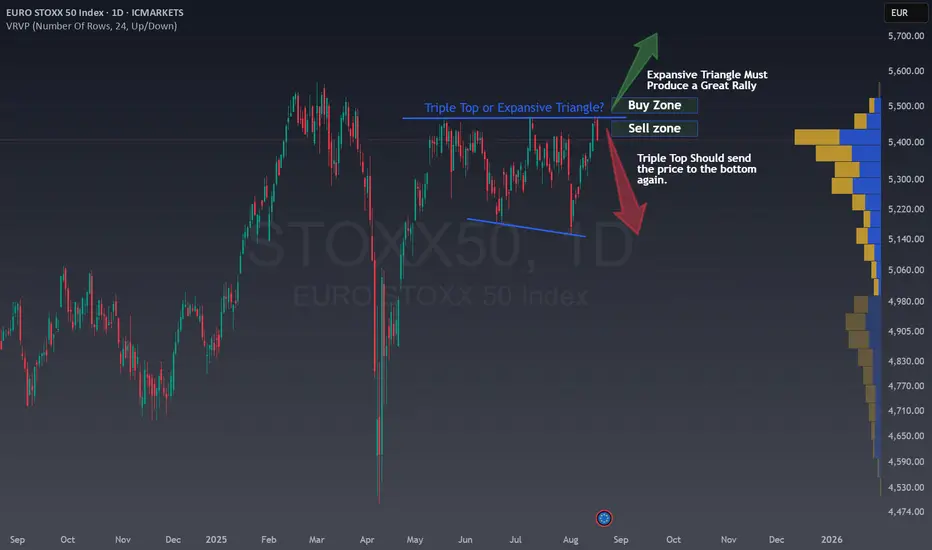
STOXX50 is full of uncertainty, but you can profit from it!STOXX50 is full of uncertainty, but you can profit from it!
Are we about to see a massive rally, or is a sharp drop lurking just around the corner?
Today’s EURO STOXX 50 chart puts us right in the middle of a classic trader’s dilemma, triple top versus expansive triangle.
Let’s break down what’s happening, why waiting for confirmation matters, and how uncertainty can create unique low-risk opportunities for smart traders.
The Chart Setup: Two Powerful Patterns, Two Opposite Outcomes
1. Triple Top: Bearish Turn Ahead?
A triple top forms when price hits the same resistance level three times but fails to break through. It’s usually a warning signal: sellers are stepping in hard, and a reversal may be brewing.
If we see this pattern confirmed, the price could head sharply lower, time to look for short setups!
If you sell right in the Top, you can use a very tight stop betting for a future triple top confirmation. this is not a good idea in my opinion, there is an important risk that after a small decline the price rallies and break the resistance.
2. Expansive Triangle: Ready to Rally?
An expansive triangle is more volatile. Price swings get bigger, lines diverge, and eventually, one side breaks. If bulls win and we break the upper resistance, a strong rally may follow. Buying the future pullback is an option less risky, but you can lose the rally.
If you buy a confirmed breakout, stop-losses can go just below the breakout,risk is controlled while reward can be substantial.
Why Confirmation Matters
Markets often fake out traders, so waiting for clear signals is smart. If you jump in too early, you’ll get caught in a false breakout, or miss the move entirely. Monitor price action around key levels (support/resistance) and look for added signals, such as rising volume or momentum shifts.
This kind of patterns appear when there is uncertainty, and Europe is the Home of uncertainty right now:
European stocks are facing trade uncertainties as recent U.S.–EU deals disappoint, and growth fears create volatility.
Tariff delays, U.S.–Iran friction, and shifting Eurozone economic data keep traders guessing.
Trump and Zelensky are meeting in Washington
How to Profit with Small Risk
In both scenarios, Selling in the top (triple top) or a breakout (expansive triangle), traders can use smart risk management:
Wait for confirmation before acting.
Use tight stop-losses just outside the pattern to stay protected.
Look for momentum, volume, and news catalysts that reinforce the move.
Uncertainty isn’t the enemy, it’s your friend. When the market is poised for a showdown between bullish and bearish patterns, the opportunities for savvy, low-risk trades are huge.
Let me share a recent example where a Triple Top and an Expansive Triangle appeared together. It’s more common than you might think:
Final Thought
The EURO STOXX 50 could surprise everyone, patience pays. Don’t rush. Let the market reveal its hand.
💬 Does this setup align with your view on ICMARKETS:STOXX50 ?
🚀 Hit the rocket if this helped you spot the opportunity and follow for more easy, educational trade ideas!
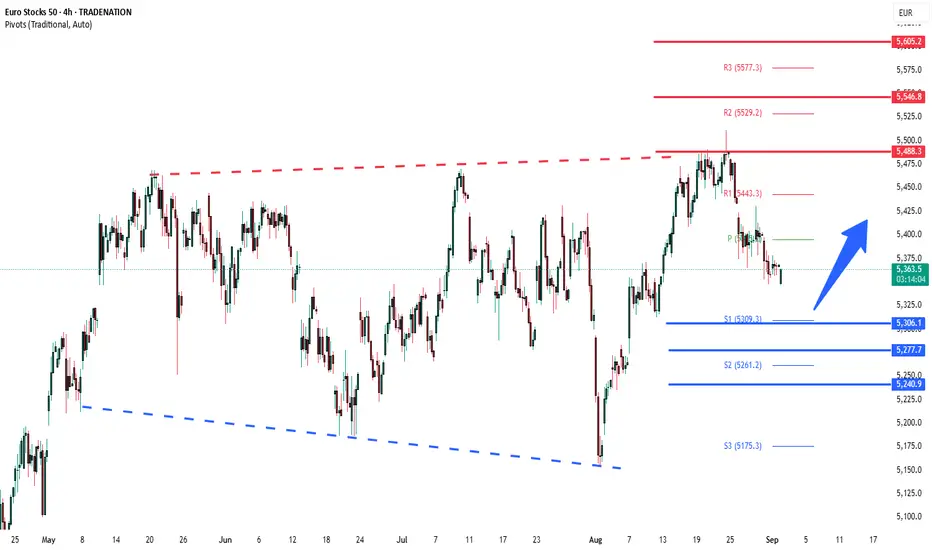
Stoxx50 bullish rally supported at 5370Key Support and Resistance Levels
Resistance Level 1: 5488
Resistance Level 2: 5546
Resistance Level 3: 5605
Support Level 1: 5370
Support Level 2: 5306
Support Level 3: 5240
This communication is for informational purposes only and should not be viewed as any form of recommendation as to a particular course of action or as investment advice. It is not intended as an offer or solicitation for the purchase or sale of any financial instrument or as an official confirmation of any transaction. Opinions, estimates and assumptions expressed herein are made as of the date of this communication and are subject to change without notice. This communication has been prepared based upon information, including market prices, data and other information, believed to be reliable; however, Trade Nation does not warrant its completeness or accuracy. All market prices and market data contained in or attached to this communication are indicative and subject to change without notice.
