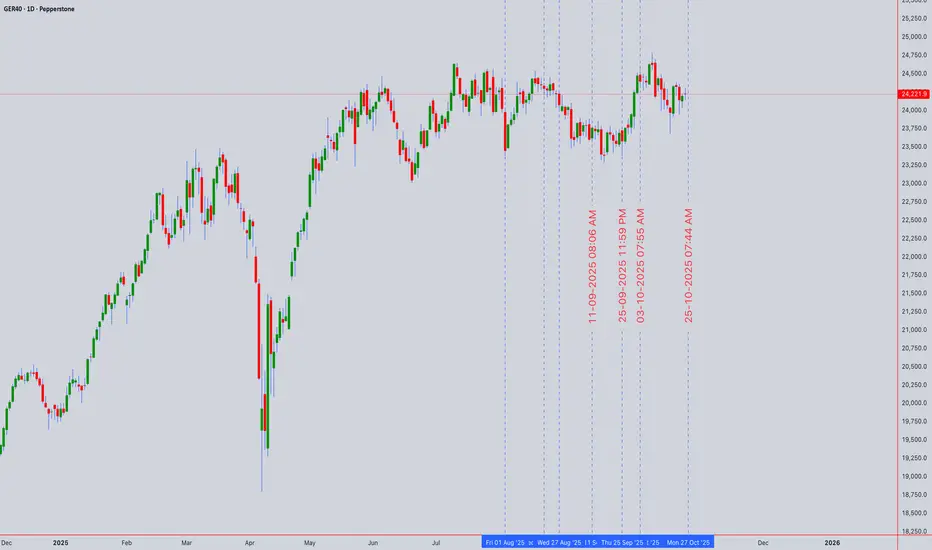
DAX, after tomorrow interest cuts we could open new long positiduring tomorrow we could see lots of volotility on the market and market manipulation,
-if the rates will be cutted than it should be a good long opportunity on DAX, and in generally on all the indices
-also US dollar dominance against other currencies, It's important to be very carefull that market will try to manipulate
Trade ideas
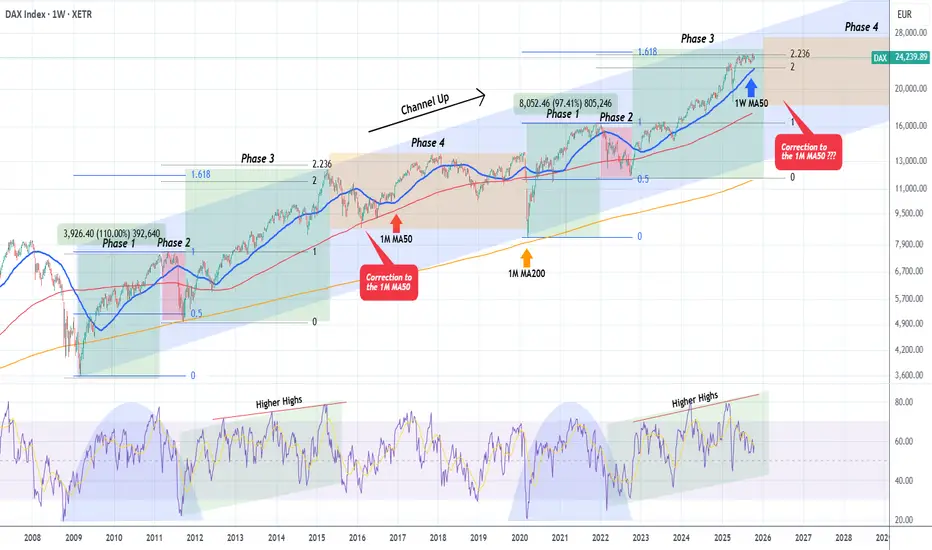
DAX may be at the end of a Bullish Super Cycle.DAX (DE40) has been trading within a historic 16-year Channel Up every since the March 2009 bottom of the U.S. Housing Crisis. This pattern has showcased very distinct technical patterns within it, characterized by an extremely high degree of symmetry.
As you can see, we have classified them into four Phases and right now DAX appears to be trading on a Phase 3. That is the phase where following a Phase 2 correction to the 0.5 Fibonacci retracement level (blue) of Phase 1, it enters a Bull Cycle, which supported by the 1W MA50 (blue trend-line), it peaks on the 1.618 (blue) and 2.236 (black) Fibonacci extensions (of Phase 1 and 2 respectively).
According to this, the index seems to be right at the end of this 'Super Cycle' of Phases 1,2 and 3 and entering Phase 4 of the Channel Up, which (the only data set we have on this pattern) is a period of directionless and volatile trend, loosely supported by the 1M MA50 (red trend-line), which only managed to find support and rebound just before touching the 1M MA200 (orange trend-line) during the March 2020 COVID crash. As a result, Phase 4 can be characterized as a true Bear Cycle, lasting 5 years before (April 2015 - March 2020).
The 1W RSI patterns of the two fractal phase groups are also identical and highly symmetrical and we are already on the 3rd Higher High, rejection and moving downwards. That is a Bearish Divergence and may explain DAX's mostly neutral price action since June 2025.
In any case, the index is possibly ending Phase 3 of this 'Super Cycle' and the next move according to the 2015 sequence is a correction to the 1M MA50. Long-term investors that don't get caught up in the daily volatility, avoid the noise and eventually enjoy the most steady returns on their investments, will most likely seek to wait patiently for this correction and buy low.
What would you be willing to do in that situation?
-------------------------------------------------------------------------------
** Please LIKE 👍, FOLLOW ✅, SHARE 🙌 and COMMENT ✍ if you enjoy this idea! Also share your ideas and charts in the comments section below! This is best way to keep it relevant, support us, keep the content here free and allow the idea to reach as many people as possible. **
-------------------------------------------------------------------------------
💸💸💸💸💸💸
👇 👇 👇 👇 👇 👇
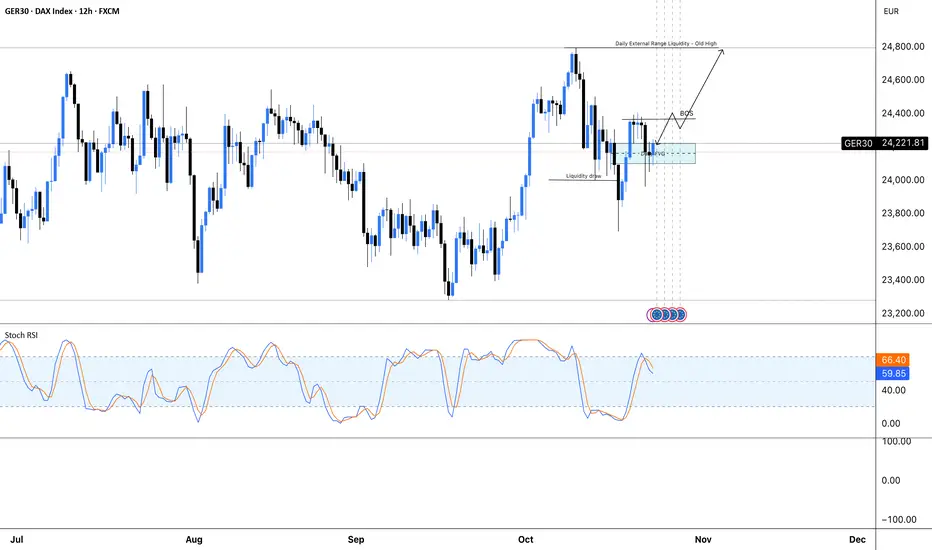
DAX: Positioning to move higherGerman DAX: Price currently inside a possible support zone within internal liquidity. I would like to see Friday (24th) push past 24.350 and a break of structure which would then see a reach for the external daily liquidity resting at 24.800.
I like:
- The current support level
- Recent sweep of liquidity
- Bullish divergence
I don't like:
- Current RSI level
- Fundamentals
Bull runWe are looking at taking out the Highs of the HTF this is a long term trade idea as we can see the US INDICES at their all-time highs this what is expected from this pair as well.

Buy the Dip, Ride the Wave — DAX40 Targeting ~38000"DAX40 | FIBCOS
Wave 2 seems done and dusted ✅ — bulls getting ready to fire up Wave 3! 🚀
As long as price holds above 23,250, the bullish structure stays strong 💪
Targets ahead around 36K–40K as momentum builds within the rising channel 📈
The German Index continues to show power and potential — buy and enjoy the ride 🇩🇪✨
Disclaimer: Educational purpose only, not financial advice.

Buy Dax at supportRisking 100 points in DAX for a 250 points swing up over the weekend.Buying at support in what looks like a range bound market.
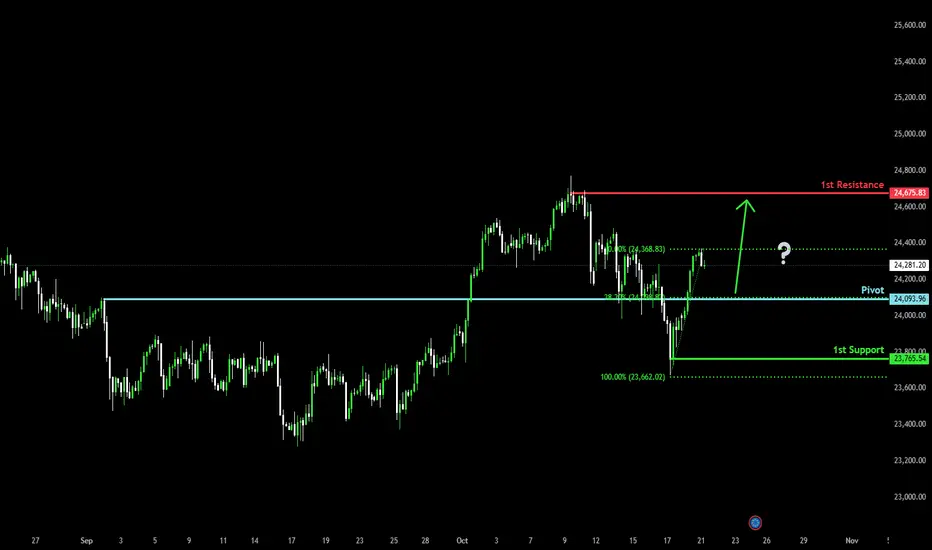
BUllish bounce off major support?DAX40 (DE40) has bounced off the pivot and could rise to the 1st resistance, which acts as a swing high resistance that aligns with the 100% Fibonacci projection.
Pivot: 24,093.96
1st Support: 23,765.54
1st Resistance: 24,675.83
Disclaimer:
The above opinions given constitute general market commentary, and do not constitute the opinion or advice of IC Markets or any form of personal or investment advice.
Any opinions, news, research, analyses, prices, other information, or links to third-party sites contained on this website are provided on an "as-is" basis, are intended only to be informative, is not an advice nor a recommendation, nor research, or a record of our trading prices, or an offer of, or solicitation for a transaction in any financial instrument and thus should not be treated as such. The information provided does not involve any specific investment objectives, financial situation and needs of any specific person who may receive it. Please be aware, that past performance is not a reliable indicator of future performance and/or results. Past Performance or Forward-looking scenarios based upon the reasonable beliefs of the third-party provider are not a guarantee of future performance. Actual results may differ materially from those anticipated in forward-looking or past performance statements. IC Markets makes no representation or warranty and assumes no liability as to the accuracy or completeness of the information provided, nor any loss arising from any investment based on a recommendation, forecast or any information supplied by any third-party.

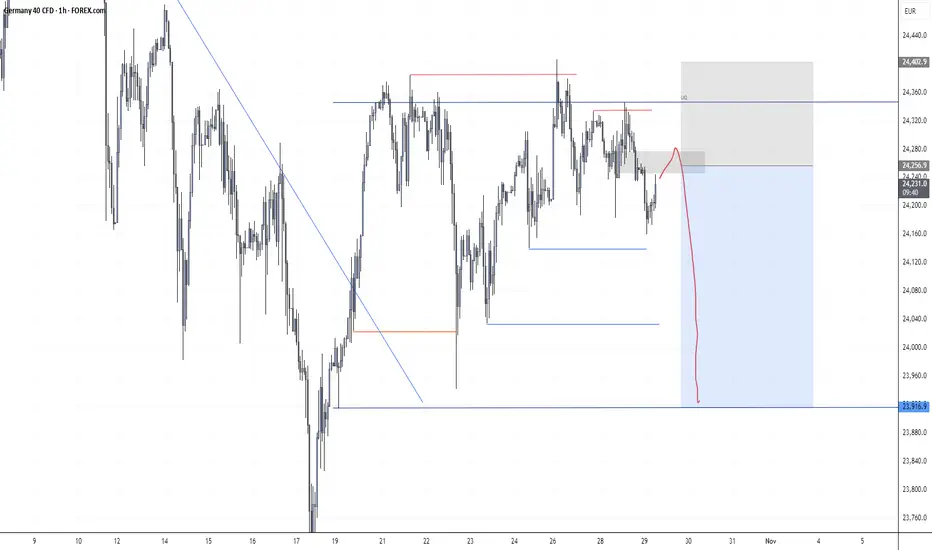
GER40(DAX)-1H SHORT Setup/RiskyChartLiquidity Grab: The recent sweep above internal liquidity failed to continue higher, indicating buy-side exhaustion.
Bearish Rejection Zone: The marked gray area aligns with a previous imbalance and premium zone, ideal for short entries.
Target Zones:
1. First Target: 24,000 – intraday demand zone.
1. Final Target: 23,920 – previous weekly low / external liquidity pool.
Invalidation: A clean 1H candle close above 24,360 (LQ) would invalidate this bearish setup.
GER40 Review October 28 2025Short-term price movement ideas.
The price has reached the daily zone of interest and performed a liquidity sweep there, which triggered a bearish move and created conditions for its further continuation.
At the moment, we have a 1H short order flow. If the price confirms the last 1H break-to-sell (BtS), we can then consider opening a position aiming for a continuation toward the 4H low.
Be flexible, adapt to the market, and the results will come quickly. Good luck to everyone.

DAX40 (GER40) INDEX TECHNICAL MASTERCLASS 💎 DAX40 (GER40) INDEX TECHNICAL MASTERCLASS | Oct 27-31, 2025 | ELITE Trading Roadmap 📊
Current Price: 24,221.9 | Strategy: Intraday Swing Trading | Timeframes: 5M → 1D Analysis ⏰
━━━━━━━━━━━━━━━━━━━━━━━━━━━━━━━━━━━━━━━━━━━━━━━━━━━━━━━━━━
💪 DAILY (1D) ANALYSIS - DAX Swing Trade Framework
DAX40 on the daily timeframe is displaying STRONG CONSOLIDATION AFTER BULLISH IMPULSE near 24,100-24,150 support offering CLEAN swing trade entries this week!
Gann theory angles from September lows converge at 24,400-24,500 resistance zone = MAJOR BREAKOUT TARGET identified! 🎯
━━━━━━━━━━━━━━━━━━━━━━━━━━━━━━━━━━━━━━━━━━━━━━━━━━━━━━━━━━
⚡ 4-HOUR (4H) SWING TRADE BLUEPRINT - PRIMARY ENTRY ZONE
The 4H timeframe is showing TEXTBOOK BREAKOUT FORMATION SETUP!
Fibonacci TradeThe price made a pullback to the 61 level on the fib follwed by a second pullback on the 50 level, now the price has made a higher high, and now looks to go long
WE ONLY TRADE PULLBACKS
Comment your thoughts

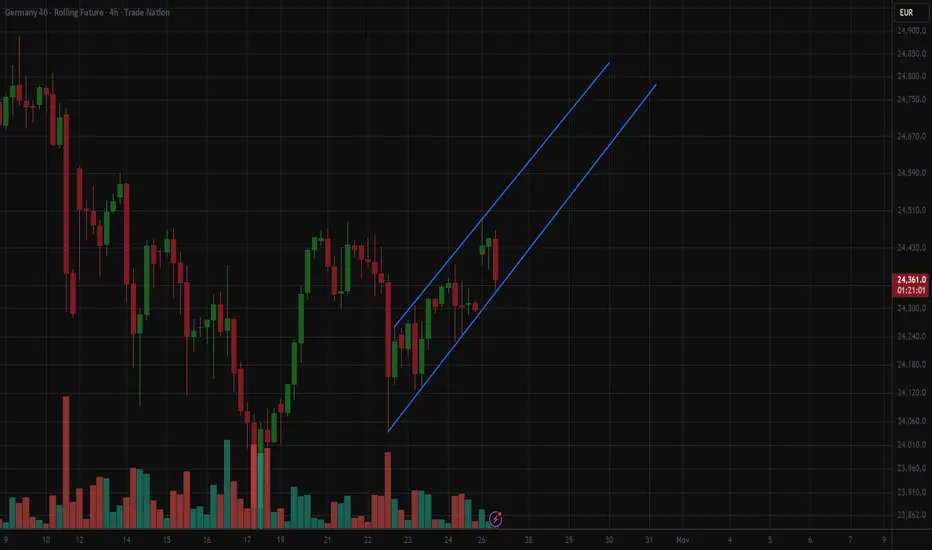
4H Bull channel DAX Buy signalDax futures are in a bull channel on 4H chart since 23 october.
Today the DAX can be bought at the bottom of that bull move with an entry around 24350, stop loss for 50 and an expected profit of 120 points.
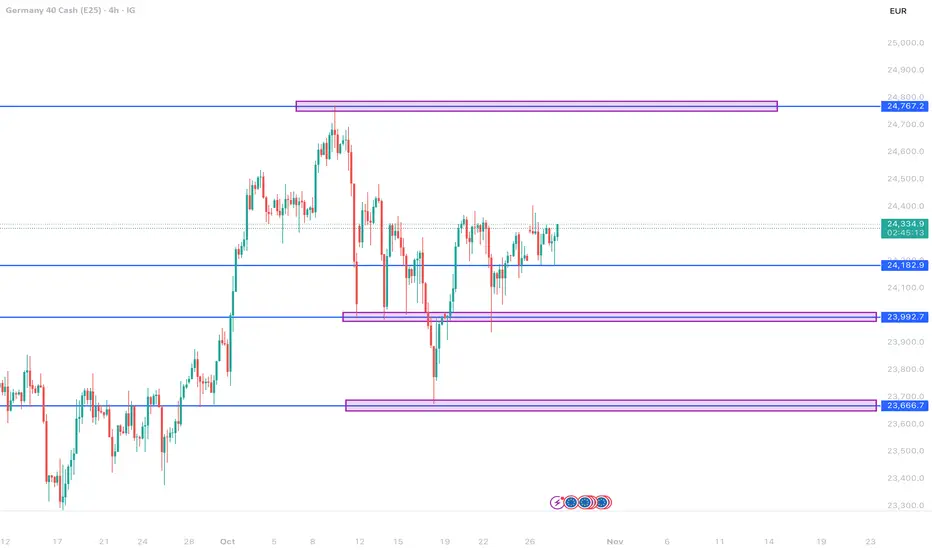
DAX sideways consolidation ahead of ECB rate decision. The DAX remains in a bullish trend, with recent price action indicating a potential overbought pullback within the broader uptrend.
Support Zone: 23970 – a key level from previous consolidation. Price is currently testing or approaching this level.
A bullish rebound from 23970 would confirm ongoing upside momentum, with potential targets at:
24490 – initial resistance
24580 – psychological and structural level
24770 – extended resistance on the longer-term chart
Bearish Scenario:
A confirmed break and daily close below 23970 would weaken the bullish outlook and suggest deeper downside risk toward:
23870 – minor support
23770 – stronger support and potential demand zone
Outlook:
Bullish bias remains intact while the Dax40 holds above 23970. A sustained break below this level could shift momentum to the downside in the short term.
This communication is for informational purposes only and should not be viewed as any form of recommendation as to a particular course of action or as investment advice. It is not intended as an offer or solicitation for the purchase or sale of any financial instrument or as an official confirmation of any transaction. Opinions, estimates and assumptions expressed herein are made as of the date of this communication and are subject to change without notice. This communication has been prepared based upon information, including market prices, data and other information, believed to be reliable; however, Trade Nation does not warrant its completeness or accuracy. All market prices and market data contained in or attached to this communication are indicative and subject to change without notice.

Is this the NEXT big leg up for DAX? It seems like there is stabilisation around in Europe with the markets.
While America is making a mess with its peace with many countries (including Canada).
We are seeing the EURO fly which means there is a safe haven among the CAC, DAX, IBEX and EURSTOXXX...
The charts are looking great for upside, and we might have some optimism around Europe in the next month.
Here are the technicals.
W Formation
Price>20 and 200
Target 25,113
Disclosure: I am part of Trade Nation's Influencer program and receive a monthly fee for using their TradingView charts in my analysis.

Pullback tradeThe price has bounced off last week's support area with an engulfing bullish candle, showing that the market is still bullish, this provides an entry opportunity after a sharp pullback
WE ONLY TRADE PULLBACKS
Comment your thoughts

GER30 | Multi-Timeframe Bullish Expansion SetupThe Market Flow | October 27, 2025
Technical Overview
Weekly:
• The weekly bullish trend remains intact, sustaining above prior structural pivots.
• Structure continues its expansion phase, with higher lows forming consistent with the broader bullish bias.
Daily:
• The daily trend has started its transitioned into bullish after reclaiming and closing above the previous breakdown level.
• Wave structure confirms alignment with the weekly expansion path.
• Bias continues long as momentum builds toward upper clean H4 structures.
H4:
• H4 bullish trend confirmed, supported by a sequence of higher pivots.
• Current structure originated from the H4 pivot zone, now acting as the foundation for the next expansion leg.
• Fibonacci extensions show progressive resistance targets
H1:
• Previous H1 countertrend was broken from the H4 pivot zone, confirming re-entry into the bullish structure.
• New pivot formed and validated by crossing the previous H1 pivot, establishing continuation bias in favor of the higher timeframe trend.
Trade Structure & Levels
• Bias: Long above 24,219.32 (H4 pivot zone)
• Trigger = Break above 24,325.60 (highest clean H1 breakdown - "EXP")
• Primary Invalidation = H4 pivot at 24,219.32
• Secondary Invalidation = Daily pivot near 23,990.21
• Path → 24,450.60 → 24,556.25 → 24,625.80
• Phase: Accumulation
Risk & Event Context
• Index behavior may remain sensitive to European earnings season and macro data releases (inflation, ECB commentary).
• Volatility spikes likely around key US macro events.
Conclusion
Multi-timeframe alignment confirms a resuming bullish expansion above the Expansion level. With both H4 and Daily trends synchronized above active pivots, the path remains upward toward 24,625.80 while 24,218.30 holds as the key structural invalidation.

DAX uptrend breakout continuation supported at 23970The DAX remains in a bullish trend, with recent price action indicating a potential overbought pullback within the broader uptrend.
Support Zone: 23970 – a key level from previous consolidation. Price is currently testing or approaching this level.
A bullish rebound from 23970 would confirm ongoing upside momentum, with potential targets at:
24490 – initial resistance
24580 – psychological and structural level
24770 – extended resistance on the longer-term chart
Bearish Scenario:
A confirmed break and daily close below 23970 would weaken the bullish outlook and suggest deeper downside risk toward:
23870 – minor support
23770 – stronger support and potential demand zone
Outlook:
Bullish bias remains intact while the Dax40 holds above 23970. A sustained break below this level could shift momentum to the downside in the short term.
This communication is for informational purposes only and should not be viewed as any form of recommendation as to a particular course of action or as investment advice. It is not intended as an offer or solicitation for the purchase or sale of any financial instrument or as an official confirmation of any transaction. Opinions, estimates and assumptions expressed herein are made as of the date of this communication and are subject to change without notice. This communication has been prepared based upon information, including market prices, data and other information, believed to be reliable; however, Trade Nation does not warrant its completeness or accuracy. All market prices and market data contained in or attached to this communication are indicative and subject to change without notice.

Technical Analysis WeeklyGermany 40 has re-entered its trading range after a failed bullish breakout. Price trades at 24,057, slightly below its VWAP of 24,206. RSI at 48.4 suggests subdued momentum. Support lies at 23,683, while resistance is 24,729.
UK 100 maintains a bullish trend but is undergoing a corrective phase. Price has pulled back to 9,394, below its VWAP of 9,403. The RSI at 51.4 indicates weak bullish momentum. Support is at 9,287, and resistance stands at 9,558.
Wall Street remains in a bullish trend but continues to correct lower, currently at 46,303, on top of its VWAP. RSI at 52.6 shows a neutral stance. Support lies at 45,630, and resistance is estimated at 46,911.
Brent Crude is turning bearish within its broader range. Price has fallen to 6,094, below the VWAP of 6,422. RSI at 30.9 indicates strongly bearish momentum. Support sits at 5,983, while resistance is at 6,860.
Gold extends its bullish run in a strong impulsive phase, trading at 4,259, significantly above the VWAP of 4,015 but down a bit from all time highs. The RSI at 75.5 signals less overbought conditions. Support is way down at 3,677, and resistance is at 4,353.
EUR/USD holds its trading range, now trading at 1.1666, right next to its VWAP. RSI at 49.0 signals neutral momentum. Support is at 1.1556, and resistance is at 1.1782.
GBP/USD stays in a bullish trend but is correcting sideways, trading at 1.3423, slightly above the VWAP of 1.3400. RSI at 49.8 shows consolidation. Support is at 1.3299, with resistance at 1.3514.
USD/JPY is in a pullback following its bullish range-breakout, currently at 150.67, just above its VWAP of 150.30. The RSI at 54.2 reflects moderate bullish momentum. Support lies at 146.60, and resistance is at 154.01.

GER30 H4 | Potential Bearish Reversal FormingGER30 is reacting off the sell entry at 24,390.79, which is a pullback resistance that aligns with the 61.8% Fibonacci retracement and could drop from this level to the downside.
Stop loss is at 24,760.34, which is a swing high resistance.
Take profit is at 23,846.69, which is an overlap support.
High Risk Investment Warning
Trading Forex/CFDs on margin carries a high level of risk and may not be suitable for all investors. Leverage can work against you.
Stratos Markets Limited (tradu.com ):
CFDs are complex instruments and come with a high risk of losing money rapidly due to leverage. 65% of retail investor accounts lose money when trading CFDs with this provider. You should consider whether you understand how CFDs work and whether you can afford to take the high risk of losing your money.
Stratos Europe Ltd (tradu.com ):
CFDs are complex instruments and come with a high risk of losing money rapidly due to leverage. 66% of retail investor accounts lose money when trading CFDs with this provider. You should consider whether you understand how CFDs work and whether you can afford to take the high risk of losing your money.
Stratos Global LLC (tradu.com ):
Losses can exceed deposits.
Please be advised that the information presented on TradingView is provided to Tradu (‘Company’, ‘we’) by a third-party provider (‘TFA Global Pte Ltd’). Please be reminded that you are solely responsible for the trading decisions on your account. There is a very high degree of risk involved in trading. Any information and/or content is intended entirely for research, educational and informational purposes only and does not constitute investment or consultation advice or investment strategy. The information is not tailored to the investment needs of any specific person and therefore does not involve a consideration of any of the investment objectives, financial situation or needs of any viewer that may receive it. Kindly also note that past performance is not a reliable indicator of future results. Actual results may differ materially from those anticipated in forward-looking or past performance statements. We assume no liability as to the accuracy or completeness of any of the information and/or content provided herein and the Company cannot be held responsible for any omission, mistake nor for any loss or damage including without limitation to any loss of profit which may arise from reliance on any information supplied by TFA Global Pte Ltd.
The speaker(s) is neither an employee, agent nor representative of Tradu and is therefore acting independently. The opinions given are their own, constitute general market commentary, and do not constitute the opinion or advice of Tradu or any form of personal or investment advice. Tradu neither endorses nor guarantees offerings of third-party speakers, nor is Tradu responsible for the content, veracity or opinions of third-party speakers, presenters or participants.

Falling towards 38.2% Fibonacci support?DAX40 (DE40) is falling towards the pivot which is an overlap support that aligns with the 38.2% Fibonacci retracement and could bounce to the swing high resistance.
Pivot: 24,093.96
1st Support: 23,765.54
1st Resistance: 24,675.83
Disclaimer:
The above opinions given constitute general market commentary, and do not constitute the opinion or advice of IC Markets or any form of personal or investment advice.
Any opinions, news, research, analyses, prices, other information, or links to third-party sites contained on this website are provided on an "as-is" basis, are intended only to be informative, is not an advice nor a recommendation, nor research, or a record of our trading prices, or an offer of, or solicitation for a transaction in any financial instrument and thus should not be treated as such. The information provided does not involve any specific investment objectives, financial situation and needs of any specific person who may receive it. Please be aware, that past performance is not a reliable indicator of future performance and/or results. Past Performance or Forward-looking scenarios based upon the reasonable beliefs of the third-party provider are not a guarantee of future performance. Actual results may differ materially from those anticipated in forward-looking or past performance statements. IC Markets makes no representation or warranty and assumes no liability as to the accuracy or completeness of the information provided, nor any loss arising from any investment based on a recommendation, forecast or any information supplied by any third-party.
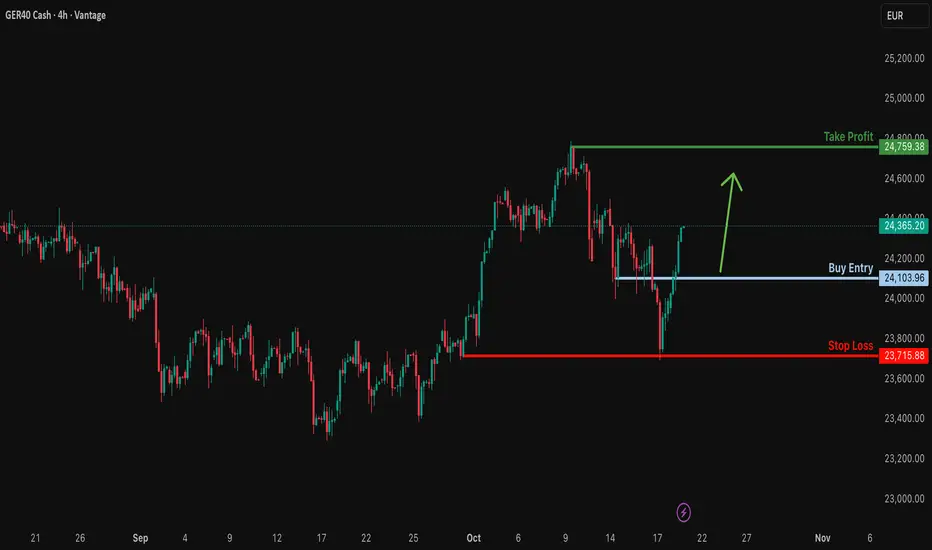
Bullish momentum to extend?GER40 could fall towards the support level which is pullback support and could bounce from this level to our take profit.
Entry: 24,103.96
Why we like it:
There is a pullback support level.
Stop loss: 23,715.88
Why we like it:
There is a pullback support level.
Take profit: 24,759.38
Why we like it:
There is a swing high resistance level
Enjoying your TradingView experience? Review us!
Please be advised that the information presented on TradingView is provided to Vantage (‘Vantage Global Limited’, ‘we’) by a third-party provider (‘Everest Fortune Group’). Please be reminded that you are solely responsible for the trading decisions on your account. There is a very high degree of risk involved in trading. Any information and/or content is intended entirely for research, educational and informational purposes only and does not constitute investment or consultation advice or investment strategy. The information is not tailored to the investment needs of any specific person and therefore does not involve a consideration of any of the investment objectives, financial situation or needs of any viewer that may receive it. Kindly also note that past performance is not a reliable indicator of future results. Actual results may differ materially from those anticipated in forward-looking or past performance statements. We assume no liability as to the accuracy or completeness of any of the information and/or content provided herein and the Company cannot be held responsible for any omission, mistake nor for any loss or damage including without limitation to any loss of profit which may arise from reliance on any information supplied by Everest Fortune Group.
The most audacious forecast DAX gapped up above the trendline on news on trade deals, but there is no follow through. Instead, price is coming down and re-testing the breakout trendline.
Price action is bearish, which indicates further downside, thus rendering the trendline support as useless. Will that be the case? No doubt, the overall market is bullish, especially the US markets. But will DAX be the clue that we see a profit taking/sell down for the coming days? And using a simple projection, 23000 will be a 'scary' yet healthy pullback, as good level to go long off.

German DAX 30 Rally Ahead? Strong Pullback Signals Momentum💎 DE30 (German DAX 30) — Thief Trader’s Market Profit Playbook! 💎
📈 Bias: Bullish Play Confirmed
⚙️ Strategy Type: Layered Limit Order Entries (Thief’s Signature Style)
🧠 Game Plan:
The German DAX 30 (DE30) shows strong bullish momentum after a clean moving average pullback — confirming a short-term continuation setup on the 4H and daily charts.
We’re loading our Thief-style layering entries to ride this momentum wave! 🏄♂️
Layered Entry Zone (Buy Limits):
💰 23,800 | 23,900 | 24,000 | 24,100
(Add more layers if you’re managing dynamic scaling — this is the Thief style of playing smart, not hard!)
🛑 Stop Loss (Protective Zone):
🚨 23,700 (Thief’s guard line!)
⚠️ Note: Dear Ladies & Gentlemen (Thief OGs), this SL is not a must-follow — manage your risk wisely. This is an educational plan — trade at your own discretion.
🎯 Take Profit Zone:
🎯 24,500 — realistic first exit zone.
💥 24,700 — Electric Shock Resistance Wall ⚡️ (strong resistance area + overbought + potential trap zone).
⚠️ Note: Again, dear Thief OGs — take your profits when you’re happy! Targets are reference points, not financial advice.
🔍 Key Technical Highlights:
Strong MA Confluence: 20EMA and 50EMA crossover support the bullish bias.
Volume Uptick: Smart money rotation visible on hourly accumulation bars.
Momentum Recovery: RSI rebounding from mid-zone (40–50), eyeing bullish breakout potential.
🌐 Correlated Assets to Watch:
Stay sharp — DAX often dances with global indices and major USD flows:
CAPITALCOM:US30 (Dow Jones) — correlated risk sentiment, bullish tone confirmation.
FX:FRA40 (CAC 40) — follows European equity momentum.
💵 FX:EURUSD — inverse correlation with DE30 strength during USD volatility.
Tracking these helps confirm whether the bull party 🎉 continues or the market bouncer 🚫 shows up early.
✨ “If you find value in my analysis, a 👍 and 🚀 boost is much appreciated — it helps me share more setups with the community!”
#DE30 #DAX30 #ThiefTrader #IndexTrading #GermanDAX #BullishSetup #LayeredEntry #PriceAction #SmartMoney #TradingStrategy #MarketAnalysis #ThiefStyle #ForexCommunity #RiskManagement
