HK50 Long Setup at 25,875Crab pattern completes on M30 and H1, marking a potential reversal zone near current price.
Triple bottom visible on M30 and H1, reinforcing a well defined support shelf.
RSI is rising as the triple bottom forms, which supports the idea of accumulation rather than a weak bounce.
Daily trend remains up, so a rebound aligns with the higher time frame bias.
Timeframes up to H4 are oversold, which suggests short term selling pressure is stretched and vulnerable to mean reversion.
Stay alert to a possible regime shift toward bearish conditions. If market tone deteriorates, prioritise defense and faster exit.
RSI divergence of about 18 points on M30, indicating buyers are stepping in while downside momentum fades.
Look for a momentum confirmation trigger, for example, an M30 higher low or an H1 close above the most recent swing high.
Entry: 25,875 at or just above the reversal zone.
Stop loss: 25,650 to avoid crowding structure while cleanly invalidating the setup if broken.
First target: 26,475, which aligns with nearby resistance and a conservative mean reversion objective.
Secondary decision point: monitor price behavior as M15 and M30 approach overbought. If thrust is weak, scale partials and tighten risk.
Trade ideas

HK50 | Breakout Re-Test in Focus — Will Bulls Defend the Trend? HONG KONG 50 (HK50) | Swing Trade Setup 🚀📈
🎯 BULLISH BREAKOUT CONFIRMED | Multi-Timeframe Confluence ✅
📊 TECHNICAL SETUP
✅ Weighted Moving Average (WMA) pullback completed
✅ LSMA Breakout confirmed on higher timeframes
✅ Bullish momentum building across all indicators
✅ Price action respecting key support zones
💰 TRADE PARAMETERS
🔵 ENTRY ZONE:
Flexible entry at current market price (CMP)
Multiple entry opportunities on pullbacks to support
🛑 STOP LOSS:
Suggested level: 26,500
⚠️ CRITICAL RISK DISCLAIMER: This is MY stop loss level based on MY risk tolerance. YOU MUST adjust according to YOUR:
Account size
Risk management rules (1-2% risk per trade recommended)
Trading strategy
Personal risk appetite
🎯 TARGET:
Primary target: 28,000 (approx. +5.6% from 26,500 level)
⚠️ Watch for strong resistance, overbought conditions, and potential bull traps
💡 Scale out profits as price approaches target
TAKE RESPONSIBILITY: Trail stops, lock profits, and exit at YOUR chosen levels
🌏 RELATED PAIRS TO WATCH (Correlation Analysis)
Asian Indices (High Correlation)
📈 HSI:HSI (Hang Seng Index) — Direct correlation, ~98% overlap
📈 CAPITALCOM:CN50 (China A50) — Mainland China exposure, ~85% correlation
📈 INDEX:NKY / FX:JPN225 (Nikkei 225) — Regional Asian sentiment, ~70% correlation
Global Risk-On Pairs (Moderate Correlation)
💵 OANDA:AUDUSD — China/Asia proxy, risk-on currency (~65% correlation)
💵 OANDA:NZDUSD — Asia-Pacific trade flows (~60% correlation)
💵 FX:USDCNH (USD/Chinese Yuan) — Inverse correlation, ~-75%
US Indices (Divergence Watch)
📊 FOREXCOM:SPX500 (S&P 500) — Global risk sentiment gauge
📊 PEPPERSTONE:NAS100 (Nasdaq) — Tech sector correlation with HK tech stocks
📊 CAPITALCOM:US30 (Dow Jones) — Global macro sentiment
🔑 KEY CORRELATION INSIGHTS
Why these pairs matter:
✅ HSI/CN50 → If Hong Kong rallies, mainland China indices typically follow
✅ AUDUSD/NZDUSD → Commodities + Asia trade = risk-on confirmation
✅ USDCNH → Weakening USD vs CNH = bullish for HK equities
✅ SPX/NAS → Global risk appetite confirmation (if US indices rally, HK50 follows)
📌 Watch for divergences — If HK50 breaks up but SPX/NAS lag, rally may be isolated (regional strength)
📢 FINAL REMINDER
🎓 This is a swing trade idea, not a guaranteed outcome
🎓 Markets are dynamic — adapt your plan as price evolves
🎓 Risk what you can afford to lose
🎓 Always use proper position sizing (1-3% risk per trade max)
🔥 TRADE SMART, NOT HARD 🔥
👍 Smash that LIKE if you're watching HK50!
💬 Drop your thoughts below — Are you bullish or waiting for confirmation?
🔔 Follow for more setups across indices, FX, and crypto!
#HK50 #HongKong50 #HangSeng #SwingTrading #TechnicalAnalysis #IndexTrading #AsianMarkets #BullishSetup #LSMA #WMA #RiskManagement #TradingIdeas #ForexTrading #StockMarket #TradingView

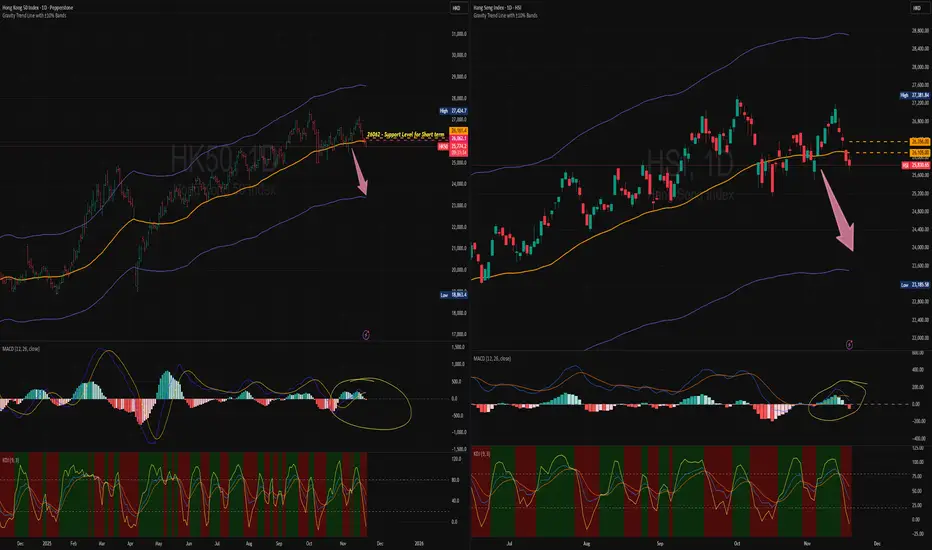
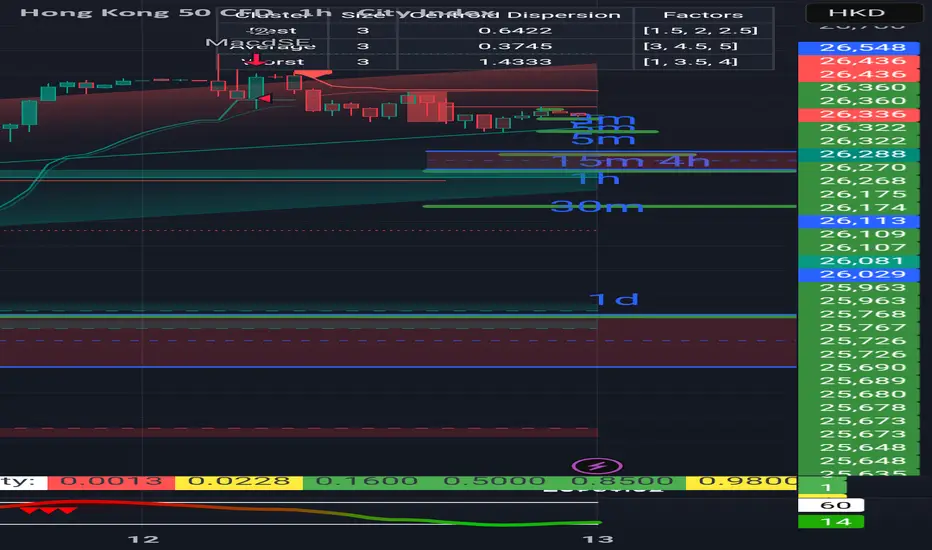
seems like Bear winds is blowing19Nov2025
Hello everyone!
HSI has been consecutively down for 4 days streaks.
For this week the HSI:-
🗝️🗝️ Important Support level : 26100 (which already broken down)
🗝️ Key Resistance level : 25850-25890
🗝️ Key Support level l : 25743 -25670
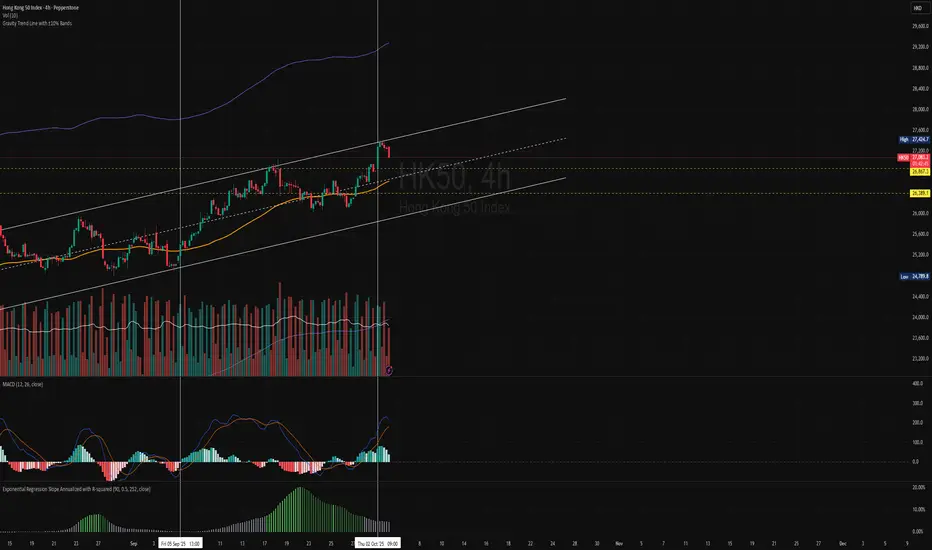
4h Chart:-
The cycle is repeating....history may not be the same but the pattern seems repeating.
Refer to D Chart , using 4h, 1h time frame to confirm the trend and you’ll notice the pattern is repeating.
1h Chart:-
GravityTrendLine for 1h - 26161/26356 at point of writing.
MACD for 1h chart showing the trend is continuously Bearish where the Signal and MACD is moving below the zero level and forming waves pattern beneath.
Don’t chase green in a red storm.
For long position, be cautious and check the smaller time frame 30m, 15m chart confirming the reversal.
Nonetheless, overall short-term trend is gonna be Bearish unless the resistance is being tested and cross above the level.
Sellers seems stronger. Ignore the news!
Ignore the noise, ride the flow. Bears walk in patterns too.
Stick to your plan, manage your risk. The trend rewards the patient.
Happy Trading!
** Please Boost 🚀, FOLLOW ✅, SHARE 🙌 and COMMENT ✍ if you enjoy this idea!
Price reverse from early loss but seems waiting for macro news? Hello everyone....
Price reverse from early loss but seems waiting for macro news? Should you wait for the news too?
For today,
🗝️ Resistance level : 26700, 26760
🗝️ Key support level : 26500 (this has been tested a few times during the noon session)
Remember to check with the underlying HKEX:HSI1!
4h Chart:--
GravityTrendLine (GravTrLine) for 4h - 26218
(Currently traded ranging 26730-267545 ~2.05% from GravityTrendLine)
The cycle is repeating....history may not be the same but the pattern seems repeating.
1h Chart:--
GravityTrendLine for 1h - 26476 so next support level 26218 if it pullback to 1h GravityTrendline
MACD for 1h chart has completed its cycle and break above zero level Monday.
For now, it has been confirmed the bullish trend. Buyer are slightly stronger; however trade with cautious as it’s on the halfway and probably sideways before it break the resistance.
Perhaps may monitor GravityTrendLine as a guide and using MACD as confirmation also using other indicators to confirm the trend.
Manage your risk.
Sit, Watch, Ride. 🧘
Happy Trading!

Pullback for Friday. what do you think?
Hello everyone....
MACD formed deadcross for 1h chart.
What's your trade plan?
For today and is Friday.
Resistance level : 26350
Key support level : 26130 if it break below this level then likely to continue to pull back to fill the gap and back to GravityTrendLine for 4h - 26100 (this level appear again and repeated).
The cycle is repeating....history may not be the same but the pattern seems repeating.
Suggest to watch out the MACD for 1h chart to coming back down and make a reversal for Long position.
For now, it has been confirmed the short position for short-term at least for today. Sellers are stronger.
To swing trade within the range between 150pts quite good to trade.
Long/Short : 26240-26250
TP/SL: 26200 - 26130
Manage your risk/reward.
Happy Trading!

Chinese stocks could hedge US tech crash Chinese stocks broke their loose correlation to US equities in 2021.
US tech stocks may or may not be in a bubble, but if they are Chinese stocks could be attractive.
The 2008 crash in the US was viewed as a major relative leap for China, because their citizens are generally savers (setting aside the reasons for those savings lol). They were able to weather the storm then and guess what, they're all padded with cash again because of the domestic deflationary storm right now.


Stay calm, stay alert! Revisit the macro prior to your trade. Hello everyone! tomorrow is the last day before the Q4 commences, let's see what's happening to HSI today. Wonder if you noticed, after lunch, it's quite amazed that how markets react to news - the meeting between the key leaders at Busan today. 😮😮😮
Well, I guess this is just another trick for the whale/smart money to flush retailers out sending 🍭🍬🍫 in the early session.
4h chart:-
Support : 26075 next 25887 and 25720 very strong support level.
Resistance : 26466, 26620
GravityTrendLine: 25887 (D chart)
1h chart:-
MACD formed deadcross for 4h and 1h chart.
🚨 Cautious for recent trades.
Look out for the support and resistance area.
Short-term is gonna be Bearish! until the MACD completed its cycle for 4h chart.
It's anticipated that is gonna be a huge pull back to 26000 level this week.
For swing-long/short - looking at range btwn 26070-26308 (at point of writing)
Or may wait for the opportunity, no trade/no action is also part of trading strategy.
Whales may play their games, but patience is our edge.
Also always refer to the underlying HKEX:HSI1!
Sticktoyourplan.
Happy Trading!
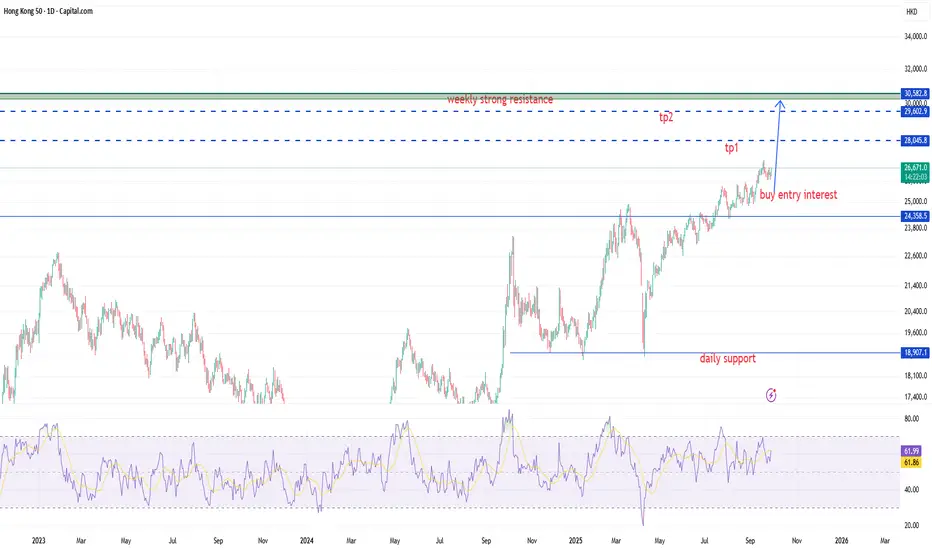
(UPDATE) Hong Kong rally is evident to 26,944Hong Kong is shaping up nicely for upside.
We did this analysis in June and now it has broken above the breakout point and is showing signs of a rally.
🧧 1. Mainland Money Flood
Chinese investors are pouring cash into Hong Kong stocks, hitting record levels.
🚀 2. Big IPOs
Huge listings like Shein and CATL are reviving market excitement.
🤖 3. AI & Tech Buzz
Hong Kong’s tech giants are flying thanks to the global AI hype.
And technically it's looking great.
Cup and Handle
Price>20 and 200
Target 26,944
Disclosure: I am part of Trade Nation's Influencer program and receive a monthly fee for using their TradingView charts in my analysis.

HK50 rebounded as the trade tension easedOptimism surrounding a potential US-China trade agreement fueled the HK50's recovery.
China's economy signals caution, with 3Q GDP Growth registering only 4.8% YoY. Although robust Exports to ASEAN and the Eurozone buoyed Industrial Production, the domestic market remains in turmoil. Falling Fixed Capital Investment raises concerns about the economy's long-term growth trajectory. Additionally, China's Housing Price decline accelerated in Sep, marking the year's steepest fall. This intensifies pessimism, dampening consumption and further dragging economic growth despite the recent easing in real estate regulations.
The government shifted its stance, supporting the real estate market to boost consumer sentiment via the wealth effect. Concurrently, the tech sector remains crucial for stimulating economic growth. This situation could provide further support for the market and the HK50.
Technically, the HK50 trades above both EMAs, indicating that bullish momentum remains strong despite risks surrounding the trade agreement. If the HK50 holds above the EMA21, the price could extend gains to test the last swing high at 27424.
By Van Ha Trinh, Financial Market Strategist at Exness

HK50 index still looking bearishi think from the the chart its creating another HL. it will still sell.the chart patterns on the higher tiime frame suggest there is a lot possibilites to sell. to the down side. so watch out for next week. from monday newyork session and the whole of tuesday. come back here n tell me . i said first. follow my trading view to get more updates.

Who’s Ready to Rob HK50? Bullish Pullback Strategy!🚨 HK50 "HongKong" Index Market Bullish Robbery 🚨
Dear Ladies & Gentlemen (Thief OG’s) 🕶️💼💰,
We got a big score lined up in the Hong Kong Index (HK50) – and this time, the vault doors are wide open! 🔓💸 Our crew is preparing a Bullish Swing Trade Heist – but remember, every robbery needs patience, timing, and a clean exit.
🎯 Heist Blueprint (Plan)
Entry Points (Pullback Entries) 🏦
Entry 1: 24,800.00 💎
Entry 2: 24,400.00 💎
Stop Loss (Escape Routes) 🏃♂️🚪
SL for Entry 1: 24,500.00
SL for Entry 2: 24,000.00
👉 Thieves adjust SLs based on your own risk tolerance & strategy – no one-size-fits-all in the game.
Target (Cashout Before Police Arrive) 🚔💰
26,000.00 – take the loot & disappear before the barricades shut us down! 🏆💸
📌 Thief Notes
This is a layered pullback entry plan (stacking orders like stashing cash 💵).
Don’t be greedy – the police (market makers) will chase late robbers. ⚠️
Manage your lot size like a pro thief – precision > panic.
💖 If this robbery plan gets you hyped, smash that Boost Button 🚀💥 – it strengthens our crew and spreads the Thief Trading Style across the TradingView underground!
Stay sharp, robbers 🕶️💼 – we steal, we escape, and we live to rob another day. 🐱👤

HSI staying uptrend. Heartbeat pattern is repeating,need a pausePEPPERSTONE:HK50
Uptrend channel on track.
The movement and pattern repeating as a cycle.
Spend time and effort to appreciate its movement.
With the helps of indicators confirming the trend to execute your trades.
Be patient, there is no need to rush or eagerly to take action.
With the tools, it helps on the probability of winning.
Continue to practice and train your skill.
HSI is in its 'bull run' since Apr2025 has been up for ~43%; is there going to be correction?
the answer is YES! definitely, but WHEN? I don't know but with historical data, the 29000-30000 is the key resistance level, so watch out!
Or simply the number 3,5,7,9 is kind of magic numbers, e.g like how Fibonacci sequence is being described; sometimes the WHY is futile.
For HK50 based on the chart:-
Next Resistance:29000
Shor-term (4h) : 27,514, 27,730, 27,795 (using Fibo, Fibo Extn)
Gravity Trendline : 26619.7 (D chart)if the movements follow its usual it will be attracted(sucked) at least closer or touch the line prior moving to next high.
For today: it will retrace back to 26965
MACD - is arching down, allow it to retrace and be patient.
You will notice the pattern, the heartbeat chart and its pattern is repeating...
Also always refer to the underlying HSI:HSI HKEX:HSI1!
No need to time the markets, unless you have crystal ball with supernatural power, so to trade our mindset is key: simply your trade plan (if you don't have one yet - please develop one that is unique for yourself, if you don't know how, please go to your local trading community that are reputable and learn or there are lots of free resources out there, take your first step.)
You dont have to be expert to trade (or expert in anything), one day you will be expert if and only you started to trade and practice it!
Set your risk reward, stop loss. risk management.
Zenful Trading! 🍃 🧘♂️ 🍵
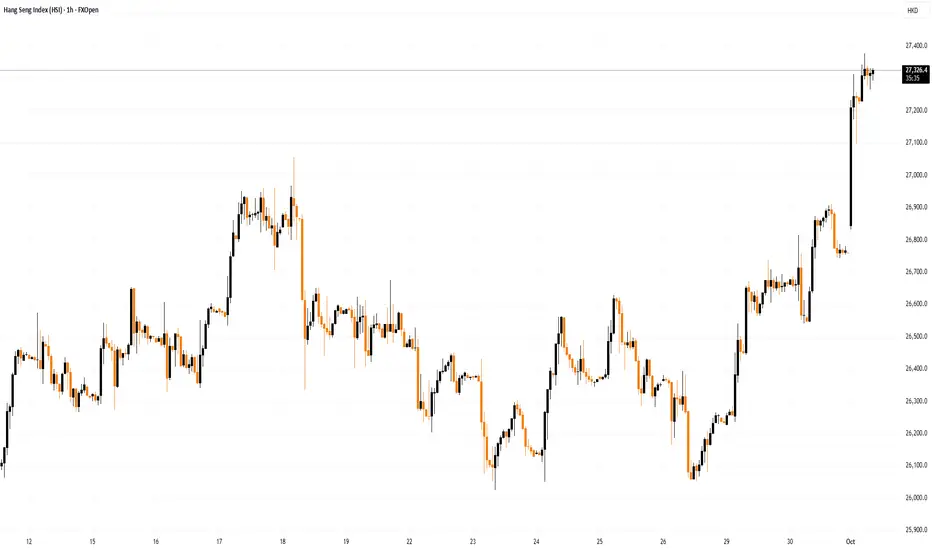
Hang Seng Index Hits 4-Year HighHang Seng Index Hits 4-Year High
As the chart shows, Hong Kong’s Hang Seng Index climbed above the 27,300 mark today – for the first time since summer 2021. The bullish momentum has been supported in part by corporate news. According to media reports:
→ Shares of Chinese EV maker NIO Inc. rose by around 5% following news that vehicle deliveries had increased by 64.1% year-on-year.
→ Shares of Ascletis Pharma Inc. jumped 12.8% after the company announced a share buyback programme.
→ Alibaba shares surged 4% after JPMorgan raised its price target by more than 40%, citing AI industry development and strong user engagement.
Since 1 September, the Hang Seng Index has gained over 7%.
Technical Analysis of the Hang Seng Index Chart
In our 23 September review of the index chart, we:
→ highlighted that the price had fallen to the lower boundary of the blue ascending channel;
→ noted signs of demand emerging around the psychological 26,000 level.
Since then (as shown by the arrow), price action has been supported by these levels. On 26 September, bears attempted once more to break below 26k, but failed – giving bulls the opportunity to seize control. This resulted in the formation of a steep upward trajectory, highlighted in orange.
From an optimistic perspective:
→ The market has resumed its uptrend, breaking above the corrective bull flag pattern (shown in red).
→ The September high near the psychological 27,000 level was broken decisively — the long candlestick points to a demand–supply imbalance favouring buyers, reinforcing the relevance of the bullish Fair Value Gap pattern highlighted in purple.
→ The price is now trading in the upper half of the blue channel (a sign of strong demand).
At the same time, the RSI indicator has entered the overbought zone. Once the first wave of positive sentiment fades, a bout of profit-taking could happen, which might trigger a correction — potentially involving a retest of the 27k level or the lower orange line.
This article represents the opinion of the Companies operating under the FXOpen brand only. It is not to be construed as an offer, solicitation, or recommendation with respect to products and services provided by the Companies operating under the FXOpen brand, nor is it to be considered financial advice.
Hk5o index analysis on the weekly and daily time frameso many indications is suggesting from the chart is a bullish set up after alittle pull back into a support zone likely tomorrow fundamental news will enable that intra support level to be met on the newyork seesion before a clear bullish upside.
Hang Seng Index Finds SupportHang Seng Index Finds Support
As the chart shows, Hong Kong’s Hang Seng Index (Hong Kong 50 on FXOpen) has fallen more than 3% from its 2025 high over the past week. In recent days, several factors may have driven bearish sentiment:
→ Domestic Chinese policy: Media reports indicate that on Monday the head of China’s central bank held a press conference, but market participants may have been disappointed by the proposed economic stimulus measures.
→ US influence: This includes both trade deal negotiations and the Federal Reserve’s recent decision to cut interest rates.
→ Other news: For example, the approach of Typhoon Ragas.
Additionally, reaching a peak near 27,000 points may have prompted long-position holders to take profits, creating a wave of selling.
Nevertheless, the chart shows several technical signs suggesting that the market is finding support, and the scope for further declines appears limited.
Technical Analysis of the Hang Seng Index Chart
Market movements in September have formed an ascending channel (shown in blue), with support provided by:
→ the lower boundary of this channel;
→ the psychological level of $26,000;
→ the 50% retracement level following the A→B impulse.
Bulls may take confidence from the fact that the RSI is in oversold territory.
In the short term, the initiative remains with the bears:
→ they are holding the Hang Seng stock price within a descending trajectory (shown in red);
→ the break below the 26,300 level occurred aggressively (marked with an arrow) — wide candles indicate a seller-dominated imbalance, making the consideration of a bearish Fair Value Gap pattern (highlighted in purple) relevant.
However, in the longer term, the odds favour the bulls:
→ the index has risen approximately 30% since the start of 2025;
→ in this context, we may be inside a Bullish Flag pattern, suggesting a potential resumption of the prevailing uptrend after an intermediate correction.
This article represents the opinion of the Companies operating under the FXOpen brand only. It is not to be construed as an offer, solicitation, or recommendation with respect to products and services provided by the Companies operating under the FXOpen brand, nor is it to be considered financial advice.

Follow the stories from chart-Be still enough 2hear them b4 moveHello everyone!
From previous update, HSI uptrend mode continue on track.
At point of writing ✍️:
The HSI hit and break 4-year peak 27058 (the next target to break 5-year peak at 31,181 at 2021; do you think is possible?)
PEPPERSTONE:HK50 This morning hit 27049
What's your take with the recent fed rate cut and the news?
** Following the overnight U.S. Federal Reserve's 25-basis-point interest rate cut, China's central bank left a key rate unchanged on Thursday, as authorities appear in no rush to ease monetary settings.
** Hong Kong's central bank lowered its base rate charged via the overnight discount window by 25 bps to 4.50%, tracking the Fed move.
** The benchmark Hang Seng index
HSI surpassed the 27,000 mark for the first time since July 2021, before edging down 0.18% by midday.
www.tradingview.com
Trade as usual. Manage your risk/reward. Be patient.
For 4H - it seems gonna to take a pause; to retrace back before to charge up again to next Hi.
🗝️ 26730, 26450
If so that's the golden zone to take a bold slightly aggressive position ride the trend to break 27320 (then 27660)
MACD Signal above zero level
KDJ is above 80 and curving down a retracement is inevitable.
currently on D Chart PEPPERSTONE:HK50
🗝️ Resistance Level : 27050
Support Level : 26585
Support level 26300 (EMA30)
If break below, huge retracement from current level to 25300.
🗝️ Strong Support Level : 25250 (from 24767 @28Aug25, Gravity TrendLine support lifting circa 484pts).
Uptrend is intact.
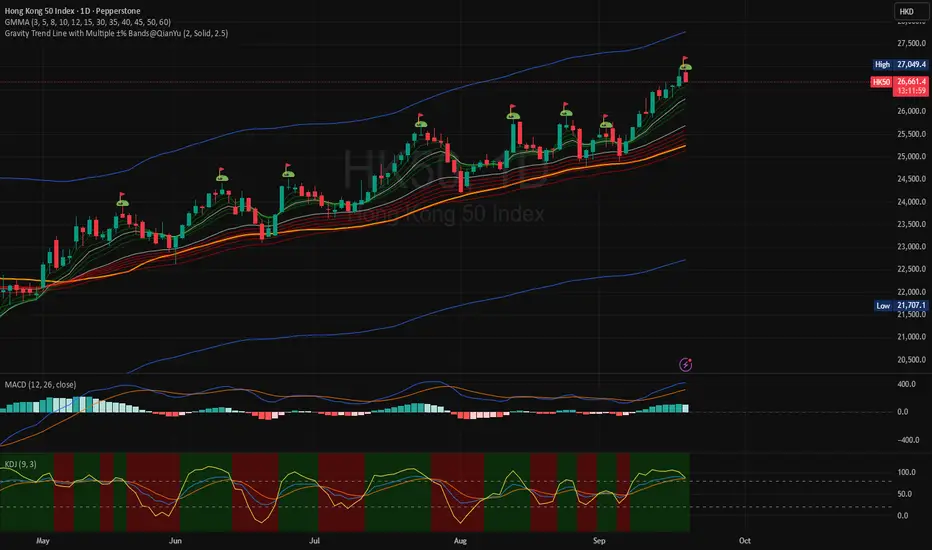
Notice the trend, after the ⛳ , it always retrace back to GravityTrend Line area,
GMMA squeezing again (around 4,5 Sep 25 from the previous squeeze 27,28Aug25) before it spreading out again to rise again.
Well it's quite predictable the movement of the Index like 🌊 it's completing its cycle for the next wave to form; it maybe a ripple and it maybe a huge wave.
This could apply on shorter timeframe for your position on swing or intraday trade.
It's not a rocket science just a little patient and contemplation is suffice.
Following your own tradeplan/SOP.
Take your position, setting stop loss and ride on the trend (up/down).
At point of writing ✍️
Be aware that Index is about to being attracted towards to D GravityTrendLine likely tomorrow and next week.
However, the uptrend is very much intact and steady (W chart - see above) - the rippling 🌊 last longer, this seems mirroring how the Index hovering above 10% GravityTrend Line back in 2017, guess the party🕺💃is still on.
🗝️ Next Resistance Level : 25300
🗝️ Next Support Level : 24970
🗝️ Strong Support Level : 24920 (EMA30)
When in doubt, sit. Not every candle needs a response.
— Sometimes, the wise action is non-action, you always have options with wise discernment.
**Analysis of the Hang Seng Index** The Hang Seng Index has r**Analysis of the Hang Seng Index**
The Hang Seng Index has recently exhibited a volatile trend, with mixed bullish and bearish factors at play. On one hand, continued strengthening of economic policies in mainland China—such as support measures for the real estate sector and consumption stimulus policies—has provided crucial support for the HSI, which is centered around finance, property, and consumption. At the same time, the Hong Kong stock market’s valuation remains at historically low levels, attracting long-term capital.
On the other hand, the index faces clear upward resistance. Major headwinds stem from uncertainty around the U.S. Federal Reserve’s interest rate cut expectations, as the prolonged high-rate environment continues to constrain liquidity in Hong Kong stocks. Additionally, concerns over geopolitical risks and a slowdown in global economic growth have also dampened risk appetite in the market.
From a technical perspective, the Hang Seng Index has been fluctuating within a range of 16,000 to 18,000 points in the short term. If it can break effectively above the upper bound of this range with increased trading volume, it may initiate a new round of rebound. Conversely, if key support levels are breached, it could decline further to seek a bottom.
Overall, the Hang Seng Index is likely to maintain range-bound volatility in the near term. A directional breakthrough would require more substantial macro-policy tailwinds or tangible improvements in external liquidity conditions. Investors should adopt a cautious strategy, focusing on defensive sectors with high dividends and low valuations, while closely monitoring changes in policy and the international macroeconomic landscape.
Minor corection and after that up Hi,
I saw good analisis here and that's why I will share too. We will have probably a minor corection down to 4h support at 26 100- 150 and after that we are going up. Going back to the daily support is also posible but we expect FED on Wednesday.
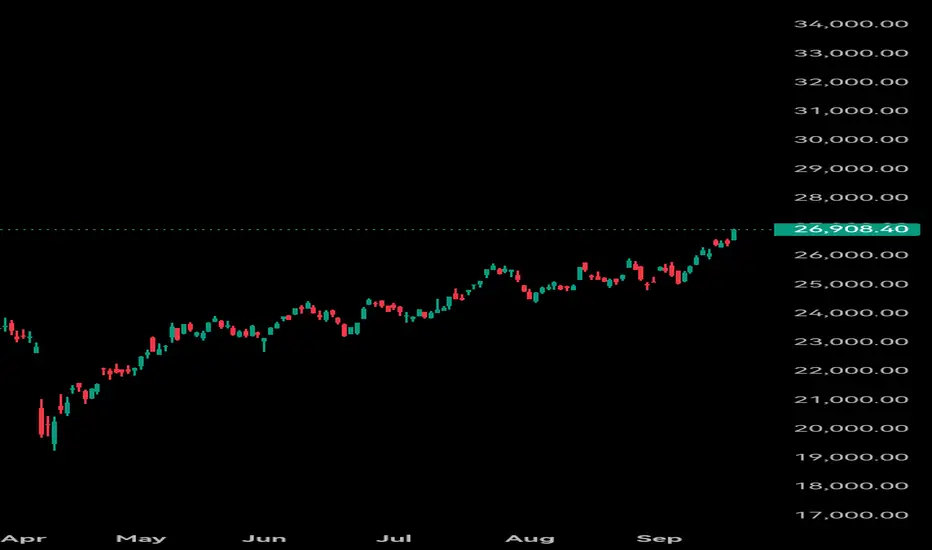
HSI and 2800 ETF updateThose who followed me knows that I am long term bull on China market . I initiated my bullish call sometime in May last year. (read here ) and added when there is pullback !
Of course, I could not catch the bottom on hindsight but longing after the breakout from bearish trend is OK for me. It is TIME in the market more important than TIMING the market for me!
I have reiterated that the media worldwide are fond of painting gloomy pictures, doom and gloom more than sunny days. These people behind it has vested interest so more readers means more eyeballs means more advertisement revenues. Now, with social media , the proliferation of negative/bad news are even more rampant, accelerating at a much faster pace.
The ECONOMY does not equal to The STOCK MARKET. There will be gurus who claim they know the "invisible hands" behind the stock market , the so called whales who are movers and shakers. Why would they share these information with you if they have no vested interest ? Either their own created proprietary technical charts indicators or some insider information packaged to sell you at a price. You have been warned.
You can see I use only trend lines, support and resistance in my charts unlike 10 years ago where I got mesmerised in the world of RSI, MACD, volume , what have you not. The longer your time frame of investment, the lesser important is your technical analysis , imo.
For now, the HSI chart shows price action has break above the resistance line at 24,877 for a while and yesterday marks the first time it crossed the 26,000 level. This upmove is promising and I believe this bulish rally will be slower and steady.
P/S : Vested in 2800 ETF and many Hong Kong/China stocks (views may be biased, please DYODD)

Indexes Pull Back – Is This the Entry You Missed? | SPX500 & HK5Most major indexes like SPX500 and HK50 have retraced about 50% of their recent gains, giving a second chance to those who missed the previous leg up. In this episode, I break down key support zones and share simple, high-probability triggers—range breakouts, engulfing candles, and fakeouts—to spot momentum shifts. 🔍
📍Remember: follow the trend, manage your risk, and no shorting here as it goes against HWC/MWC bias.
( Educational content only , not financial advice. Comment your favorite ticker for future analysis.)

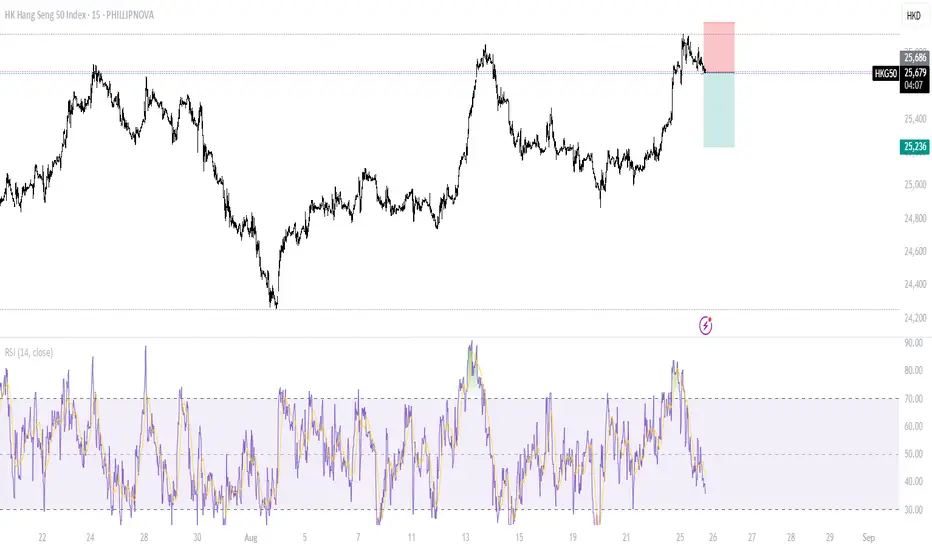
HKG50Price appears to be overbought, I'm expecting this pair to be in a downtrend really soon, going for 1:1.5 RR.