Hang Seng....A thrust off a triangle?Hello Traders,
Hang Seng has risen to 25373 this week and it`s up ~ 4k points from it`s low @ 21139 on the week of March 9. Since the low HS has just retrace 0.35 of the decline from the ATH @ 33484. This is weak! So far, the move since that low is just a „three-up“ and it is countertrend. If waves C equals A @ 26478, what is the retracement of 0.43 of the countertrend, it could be a good reversal area to assume the downtrend since January 2018!
The structure from the ATH to 21139 shows overlapping waves and indicates a correction to a high degree. It could be waves (A)- triangle (B)-(C) or just a flat (W)-(X)-(Y) or a variation thereof.
Very interesting is a quick view of the Hang Seng Short index (Tick: HSISI) below the HS graph.
This index topped in September 2011 and is in a downtrend since.
Every low or high this index made, coincides with a low or a high for HS, but in an inverted view!
So, if this observation is right, HS has room to advance in the coming days and weeks ahead, because the structure of the Short index looks not to be done to the downside! A break of the level @ 4748 for HS short index would imply an ongoing advance for HS! As before. a mentioned area is around the 26478 zones (waves C=A)!
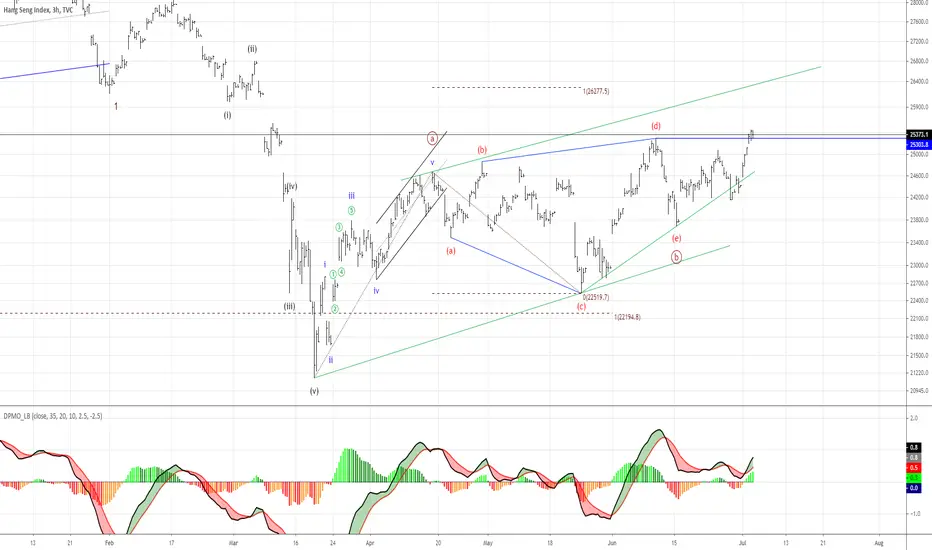
At the 3h chart for HS you can observe one alt count. I have counted a rare „expanding triangle“ for the index and if this count works out, the break above the wave (d) high @ 25303 implies a „thrust“ in a wave ((c)) underway. A target range for this scenario is @ 26277, where it would close an open gap, left by the trading on March 6-9 (c=26146-o=25134)! This would be shy below the 26478 area I have mentioned before!
For the very short term view, I expect HS to rise to still higher levels in the coming 1-2 days.
Stay tuned for the next update for Hang Seng.
Have a great Sunday and a great week...
ruebennase
Feel free to ask or comment!
Trading this analysis is at your own risk!
HK50 trade ideas


Hong Kong Index (Wheresoever you go, go with all your heart)View On Hong Kong Stock Index (4 JUNE 2020)
Geopolitical tension is flaring in Hong Kong city-state and it can bring a negative impact on its Stock Market.
Today is the holiday and HSI will open from tomorrow.
For the past 2 weeks, it was hovering at the support region of 24,250, it shall get broken sooner or later.
23,130 region will be the next support level.
So, buckle up Dorothy.
Legal Risk Disclosure:
Trading foreign exchange or CFD on margin carries a high level of risk, and may not be suitable for all investors.
The high degree of leverage can work against you as well as for you. Before deciding to trade foreign exchange you should carefully consider your investment objectives, level of experience and risk appetite.
The possibility exists that you could sustain a loss of some or all of your initial investment and therefore you should not invest money that you cannot afford to lose.
You should be aware of all the risks associated with foreign exchange trading, and seek advice from an independent financial advisor.
DISCLAIMER:
Any opinions, news, research, analyses, prices or other information discussed in this presentation or linked to from this presentation are provided as general market commentary and do not constitute investment advice.
Sonicr Mastery Team does not accept liability for any loss or damage, including without limitation to, any loss of profit, which may arise directly or indirectly from use of or reliance on such information.


Nothing gonna stop us nowRead this article here
Once the 25,000 resistance level is break out , it will head up higher.
adding more now

Hang Seng....End of wave "2"?Hello Traders,
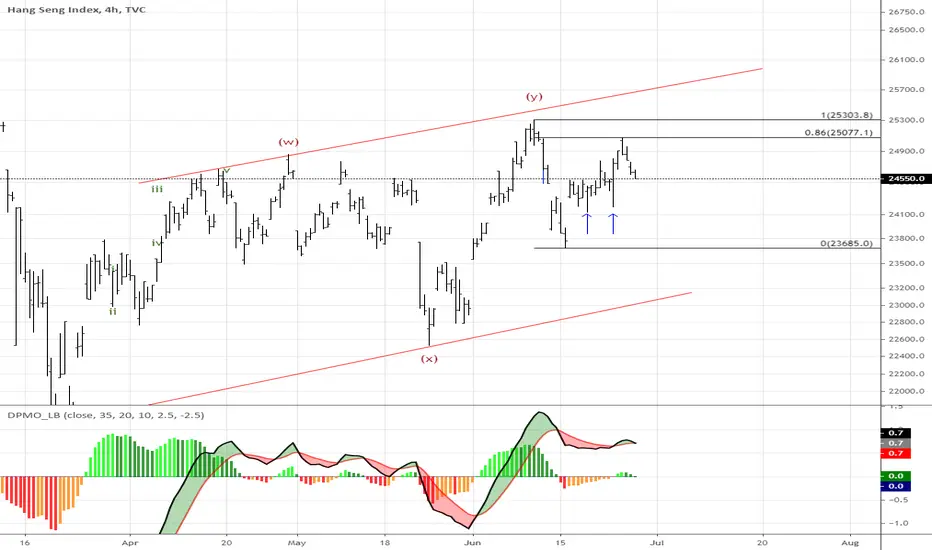
Hang Seng advanced to 25071 on June 24. This move shows overlapping waves, indicating a corrective pattern. It could be a wave „2“ which was done at 25071 and the index is ready to decline.
If so to come, HS will decline in the coming hours and a cross of 23685 would strengthen the odds for this view. A first hint is a break of 24184 and 24121 (denoted with the blue arrows) on an hourly closing basis.
If HS breaks below 23685 the target zone is the lower boundary of the channel (red) which crosses ~23100 area on Monday. A break of this channel line would indicate more bearish potential ahead!
On the other hand, would make a move above 25303, the wave (y) high this count invalid, and an alternate view come into play, including higher highs to come in the days ahead.
Have a great weekend
ruebennase
Feel free to ask or comment.
Trading this analysis is at your own risk!

Hang Seng....End of wave "2"?Hello Traders,
Hang Seng advanced to 25071 on June 24. This move shows overlapping waves, indicating a corrective pattern. It could be a wave „2“ which was done at 25071 and the index is ready to decline.
If so to come, HS will decline in the coming hours and a cross of 23685 would strengthen the odds for this view. A first hint is a break of 24184 and 24121 (denoted with the blue arrows) on an hourly closing basis.
If HS breaks below 23685 the target zone is the lower boundary of the channel (red) which crosses ~23100 area on Monday. A break of this channel line would indicate more bearish potential ahead!
On the other hand would make a move above 25303, the wave (y) high this count invalid, and an alternate view comes into play, including higher high`s to come in the days ahead.
Have a great weekend
ruebennase
Feel free to ask or comment.
Trading this analysis is at your own risk!


Hang Seng Index Large Comple Correction TO CompleteIt looks like that the index has finished the correction around 61.8% Fibonacci retracement.
Now it could drop to the bottom of the range within a large complex correction

Hang Seng Index (HSI). Correction Could Be Over. Target 51300The correction that I expected earlier (see related) could be over already with shorter wave Y.
The final confirmation trigger set at 29200. The target is 51300.

HONG KONG UNDER RESISTANCE AND LOOKS BEARISHHello Traders,
Hong Kong is going through some troubling times right now. To summarize very briefly, Hong Kong has been its own entity for some time with its own legal systems, boarders and rights but due to legal agreements China wants to take back Hong Kong as part of China. This is a crude summary of events.
This is causing friction between Hong Kong and China and there have been violent protests for several months over the current situation. Hong Kong property market is also one of the most expensive in the world.
Due to the current climate of uncertainty and looking at the chart of the Hong Kong top 50, it looks very bearish to me.
Price has dropped out of a large descending triangle, that H+S dumping price to below the major support/resistance level. Price looks like its trying to break resistance but I think with whats going on right now it wont.
Quite simply if the price breaks resistance, holds resistance and moves up then that will make my bearish stance invalid.
But because I am bearish I am looking for weakness here. Repeated failures at resistance means the price will be going lower.


Hang Seng...Short term down?Hello Traders,
on May 22 Hang Seng made it`s low @ 22519 within a wave „X“ and advanced to 25303.8, a wave „Y“! The correction since that day is not a clear impulse down, nor is it a clear corrective pattern.
While the advance from 22528 (wave „X“) is a countable „five-up“ let`s check the targets to both sides.
If this move from 22528 is a fresh new impulse, the retracement for a wave „2“achieved the 0.618 Fibonacci, found support at the rising green trendline, what could be all of the correction.
If so, a push to new highs is next to occur and may have started @ 23588 yesterday. To establish this view, Hang Seng needs to advance above the area of 24685-24957 on an hourly closing price.
On the larger timeframe, it could be possible, that this move is part of the very first patterns of the resumed downtrend. The decline from 25303- 23685 retraced the 0.5 Fibonacci and is either wave „2“ or wave „a“ of wave „2“ which could develop as a „expanding-flat“!
So a break below the 23685 would strengthen the odds, that a wave „3“ is underway. This must be done with massive volume and a bear-candle1
So I guess, the next hours will be pretty important for the coming week and will bring more clarity to the developing wave patterns!
Have a great week...
ruebennase
Feel free to ask or comment!
Trading this analysis si at your own risk!
