DXY DOLLAR INDEX What is the DXY?
The DXY (U.S. Dollar Index) is a weighted index that measures the value of the United States dollar (USD) relative to a basket of six major foreign currencies: the euro (EUR), Japanese yen (JPY), British pound (GBP), Canadian dollar (CAD), Swedish krona (SEK), and Swiss franc (CHF). The euro has the largest weight in the index, around 57.6%, making it the most influential currency in the DXY.
The DXY provides a broad gauge of the USD’s international value and is frequently used by traders and analysts to assess dollar strength.
Correlation of DXY with US10Y (U.S. 10-Year Treasury Yield)
The U.S. 10-year Treasury yield (US10Y) and the DXY often have a positive correlation.
Higher US10Y usually signals stronger U.S. economic growth and/or expectations of higher Federal Reserve interest rates, making U.S. Treasury securities more attractive to investors. This leads to increased demand for USD, causing the DXY to strengthen.
Rising yields increase the return on dollar-denominated assets, attracting capital inflows and boosting the dollar’s value relative to other currencies.
Conversely, when US10Y falls, it often indicates weaker economic sentiment or looser monetary policy, which tends to weaken the dollar and lower the DXY.
Strength of the U.S. Dollar and DXY Relationship
The DXY directly reflects the strength or weakness of the U.S. dollar in the global forex market.
A rising DXY means the USD is strengthening against other major currencies, indicating increased purchasing power and greater global dollar demand.
A falling DXY implies the USD is weakening, reducing its relative value versus other currencies.
The DXY is impacted by the interest rate differentials, economic growth expectations, geopolitical events, and risk sentiment affecting capital flows in and out of the U.S.
The DXY is a key barometer for the dollar’s relative strength, and its movement often aligns with changes in US10Y due to the economic and yield attractiveness
IF THE INDEX CORRECTS IN THIS WEEKLY CANDLE EXPECT A LONG POSITION .
WATCH EURUSD,AUDUSD,GBPUSD,USDJPY.
#DXY #US10Y
USDX trade ideas

DXY 8HPrice just hit the top of the channel, so a pullback looks likely. We’re currently in wave C, and I’m looking for a correction down into the Fibonacci zone. After confirmations, I’ll be watching for entries on USD pairs.

DXY--General outlook details--This daily chart is for the current position.
--Check for the big picture chart I add below.

Dxy Clear Trade - Patience is a keyEverything is on the chart
Head and shoulder when we flip the chart
Goodluck

DXYThe U.S. Dollar Index (DXY) maintains a bearish bias after breaking key support levels. Markets are pricing in a less aggressive Fed, mixed economic data, and rising risk appetite, all of which limit demand for the USD as a safe haven.
🔑 Key Factors
Monetary policy: The Fed no longer shows the hawkish tone of 2022–2023; rate cuts are expected in the coming quarters, reducing the dollar’s appeal.
Macro data: Inflation is more under control and signs of economic cooling → fewer arguments to keep rates high.
Market sentiment: Flows into stocks and crypto reflect greater risk appetite, reducing USD demand.
External factors: The ECB and BoJ are showing signs of tightening → the interest rate differential with the U.S. narrows, cutting the dollar’s advantage.

DXY We looking for the dollar to be bullish as its still in a bullish momentum resulting in buying opportunities|1H TIMEFRAME

DXYThe Dollar Index (DXY) is currently rising within a flat corrective structure. Wave C may complete around the 100 zone, which serves as a key resistance level. Once this area is reached, a strong bearish reversal could follow. Traders should be cautious of potential exhaustion in the upward move and prepare for selling opportunities once confirmation appears.

dxy xau opportunity dxy looking like a long and xau will short itself to the shitter fyi thats about it cuh look at the bearish fvg and break of trend neckline that is showed with my painting skills

possibility of uptrend The corrective pattern is expected to end and we will see the start of an uptrend. A break of the resistance trend line will be a confirmation of the uptrend.
If the index breaks through the support area, a downtrend scenario will be likely.

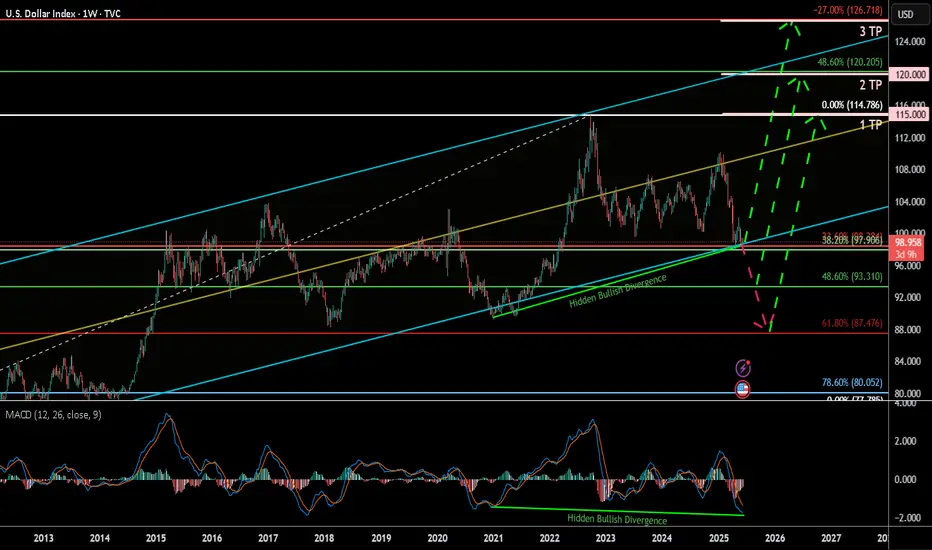
U.S. Dollar Index (DXY) Weekly 2025Summary:
The U.S. Dollar Index (DXY) has corrected down to the key 38.60% Fibonacci retracement zone and is currently showing signs of a potential bullish reversal, bolstered by a clear hidden bullish divergence on the MACD. This may signal a renewed rally toward key upside targets, especially if the 93.3–99.9 support Zone holds.
Chart Context:
Current Price: 98.864
Key Fib Support: 38.60% @ 99.906, 48.60% @ 93.310, 61.80% @ 87.476
Support Zone: 93.3–99.9 USD
Hidden Bullish Divergence: Observed both in 2021 and now again in 2025 on the MACD
Trendline Support: Long-term ascending trendline holding since 2011
Fib Extension Targets (Trend-Based):
TP1: 115.000
TP2: 120.000
TP3: 126.666
Key Technical Observations:
Fibonacci Confluence: DXY is bouncing from a strong Fib cluster between 93.310 and 99.906, historically acting as a reversal zone.
Hidden Bullish Divergence: Suggests potential upside despite price weakness.
Downtrend Retest: Price may revisit 93.3–87.4 before confirming full reversal.
Breakout Pathway: Green dashed arrows outline the likely recovery trajectory toward 114–126 range.
Indicators:
MACD: Showing hidden bullish divergence and potential signal crossover.
Trendline Support: Holding intact from 2021 low.
Fib Levels: Used for retracement and trend-based extension.
Fundamental Context:
Interest Rate Outlook: If U.S. inflation remains controlled and Fed signals future hikes or sustained high rates, DXY strength may persist.
Global Liquidity & Recession Risk: If risk aversion returns, the dollar may rise as a safe haven.
Geopolitical Risks: Conflicts, trade tensions, or BRICS dedollarization efforts may create volatility.
Our Recent research suggests the Fed may maintain higher-for-longer rates due to resilient labor markets and sticky core inflation. This supports bullish USD bias unless macro shifts rapidly.
Why DXY Could Continue Strengthening:
Robust U.S. economic performance & monetary policy divergence
U.S. GDP growth (~2.7% in 2024) outpaces developed peers (~1.7%), supporting stronger USD
The Fed maintains restrictive rates (4.25–4.50%), while the ECB pivots to easing, widening the policy and yield gap .
Inflation resilience and Fed hawkishness
Labor markets remain tight, keeping inflation “sticky” and delaying expected rate cuts; market-implied cuts for 2025 have been pushed into 2026
Fed officials (e.g. Kugler) emphasize ongoing tariff-driven inflation, suggesting rates will stay elevated.
Safe-haven and yield-seeking capital flows
With global risks, capital favors USD-denominated assets for yield and stability
Why the Dollar Might Face Headwinds
Fiscal expansion & trade uncertainty
Ballooning U.S. deficits (~$3.3 trn new debt) and erratic tariff policy undermine confidence in USD
Wall Street’s consensus bearish position.
Major banks largely expect a weaker dollar through 2025–26. However, this crowded bearish sentiment poses a risk of a sharp rebound if data surprises occur
barons
Tariff policy risks
Trump's new tariffs could dampen dollar demand—yet if perceived as fiscal stimulus, they could unexpectedly buoy the USD .
Synthesis for Our Biases
A bullish DXY thesis is well-supported by:
Economic and policy divergence (U.S. growth + Fed vs. peers).
Hawkish Fed commentary and sticky inflation.
Safe-haven capital inflows.
Conversely, risks include:
Deteriorating fiscal/trade dynamics.
Potential Fed pivot once inflation shows clear decline.
A consensus that could trigger a short squeeze or reversal if overstretched.
Philosophical / Narrative View:
The dollar remains the world’s dominant reserve currency. Periodic dips often act as strategic re-accumulation phases for institutional capital—especially during global macro uncertainty. A return toward 120+ reflects this persistent demand for USD liquidity and safety.
Bias & Strategy Implication:
1. Primary Bias: Bullish, contingent on support at 93.3–99.9 holding.
2. Risk Scenario: Breakdown below 93.3 invalidates bullish thesis and targets 87.4–80 zones.
Impact on Crypto & Gold and its Correlation and Scenarios:
Historically, DXY has had an inverse correlation to both gold and crypto markets. When DXY strengthens, liquidity tends to rotate into dollar-denominated assets and away from risk-on trades like crypto and gold. When DXY weakens, it typically acts as a tailwind for both Bitcoin and gold.
Correlation Coefficients:
DXY vs. Gold: ≈ -0.85 (strong inverse correlation)
DXY vs. TOTAL (crypto market cap): ≈ -0.72 (moderate to strong inverse correlation)
Scenario 1: DXY Rallies toward 115–126 then, Expect gold to correct or stagnate, especially if yields rise. Crypto likely to pull back or remain suppressed unless specific bullish catalysts emerge (e.g., ETF flows or tech adoption).
Scenario 2: DXY ranges between 93–105 then Gold may consolidate or form bullish continuation patterns. Then Crypto may see selective strength, particularly altcoins, if BTC.D declines.
Scenario 3: DXY falls below 93 and toward 87 Then Gold likely to rally, possibly challenging all-time highs. Crypto could enter a major bull run, led by Bitcoin and followed by altcoins, fueled by increased liquidity and lower opportunity cost of holding non-USD assets.
Understanding DXY’s direction provides valuable insight for portfolio positioning in macro-sensitive assets.
Notes & Disclaimers:
This analysis reflects a technical interpretation of the DXY index and is not financial advice. Market conditions may change based on unexpected macroeconomic events, Fed policy, or geopolitical developments.
USD Rate Cut Rally - X Marks the SpotThe Fed cut rates while warning of another 50 bps of softening for this year and another 25 for next year. Yet the USD has rallied since just after the release of the rate cut announcement with strength holding into the end of the week.
This is quite similar to last year's rate cut cycle starting from the FOMC. At that meeting, the USD initially pushed down to a fresh low - and that's when sellers started to stall. It took another week and a half or so but soon bulls took over with aggression and ran a strong rally through Q4 trade.
This also led to higher US yields, with both the 10 and 30-year setting a low yield watermark just a day ahead of the rate cut. But, as the cut and continued to cut in Q4, US yields just went higher and higher, with the 10-year eventually tagging 4.8% in the first few weeks of 2025 (after a pre-cut low of 3.6%) and the 30-year hitting 5% (after a pre-cut low of 3.9%).
This may seem counter-intuitive, as the Fed softening rates led to higher long-term rates, but if the Fed is cutting rates with inflation already high, this is something that can happen. Long-term inflation expectations moving higher makes the prospect of sitting long in long bonds as a less attractive prospect. And there's also the opportunity cost element, why settle for a 3.9% year-over-year return if inflation is expected at 3% or maybe even more; meanwhile stock prices are rallying on the back of a softer Fed even with a backdrop of high inflation.
While last year's rate cut marked a significant low for DXY, there's potential for a repeat occurrence. We're still in the early stages of the move and the Fed sounded just a little less dovish than what markets were hoping for, by reining in expectations for 50-75 bps in cuts next year. But given just how stretched USD bears have been, any further motive towards fewer FOMC cuts could lead to a stronger USD.
For next week, the big focus is on EUR/USD supports which remain in-play, and those keep bulls in the conversation until they're traded through. And with the Euro as 57.6% of the DXY quote, that's an extremely important factor for USD trends as we near the Q4 open. - js

Dollar short-term BULLISH until proven otherwiseCAPITALCOM:DXY
After a deep liquidity sweep down to ~95.80 followed by a sharp buying response, a string of higher lows, and a higher high into the 97.39–97.78 area. Price is currently pausing just above the shaded Daily BPR.
That sequence (sweep → big rejection → higher low → higher high) is the technical basis for a bullish bias while price stays above the recent higher-low area.
Watching development for now...

US Dollar: Bearish! Buyside LQ Sweep Before Rate Cut?Welcome back to the Weekly Forex Forecast for the week of Sept 15 - 19th.
In this video, we will analyze the following FX market: USD Dollar
The USD has a .25 basis point rate cut coming Wednesday. Will there be a manipulation of the buy side liquidity before prices turn downward? I am looking out for this fake out maneuver by MMs, being mindful the rate cut will weaken the USD against its counterparts. A short term move higher before the market turns bearish with the news announcements is more then possible.
Wait and react. Do not predict.
React and do not predict.
Enjoy!
May profits be upon you.
Leave any questions or comments in the comment section.
I appreciate any feedback from my viewers!
Disclaimer:
I do not provide personal investment advice and I am not a qualified licensed investment advisor.
All information found here, including any ideas, opinions, views, predictions, forecasts, commentaries, suggestions, expressed or implied herein, are for informational, entertainment or educational purposes only and should not be construed as personal investment advice. While the information provided is believed to be accurate, it may include errors or inaccuracies.
I will not and cannot be held liable for any actions you take as a result of anything you read here.
Conduct your own due diligence, or consult a licensed financial advisor or broker before making any and all investment decisions. Any investments, trades, speculations, or decisions made on the basis of any information found on this channel, expressed or implied herein, are committed at your own risk, financial or otherwise.

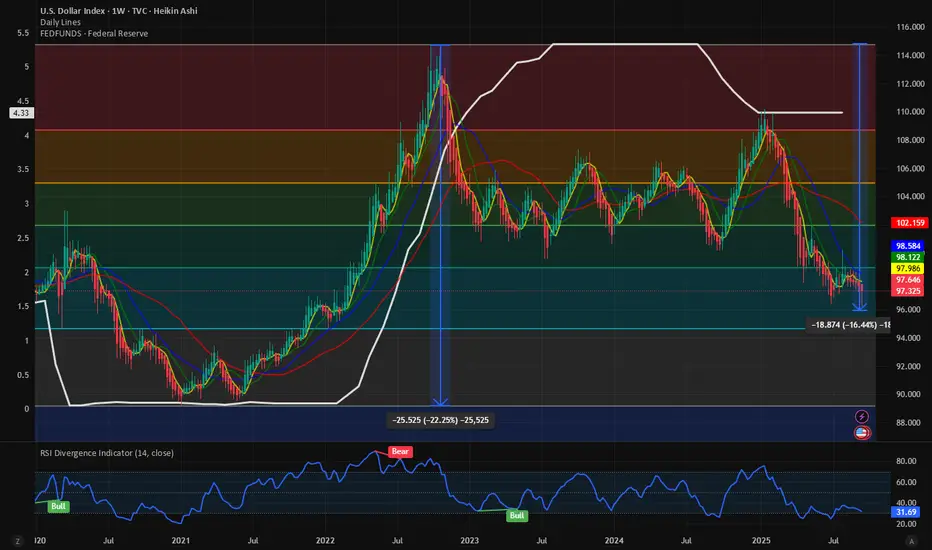
$DXY breaking down. Next level to watch 95. Year-end lows @ 90.Even if the Fed cutting cycle has just started, we are seeing major weakness in the TVC:DXY index prior to the easing cycle. It is quiet peculiar the bottom to top of the Fed hiking cycle matches exactly to the DXY index Cycle bottom in 2021 to cycle top to September 2022. With a drop in the Fed fund rate from 5.34% to 4.34%, which is close to 18%, and the DXY has also lost almost 17%. If the expectation is that there will be another 0.25% rate cut over the next few months which will takt the Fed fund rates to 4.09%, which is 23% from the recent highs of 5.34%. And surprisingly if we plot 23% lower from the ATH on the TVC:DXY Index then the index should reach 90 by the end of the year.
Verdict: With Fed rate lowering cycle ongoing the TVC:DXY index will lose more strength. 95 remains our short-term target and TVC:DXY to reach 90 by year end.
DXYDXY Bullish Bias
Buyers have stepped in, absorbing all selling pressure, pushing price higher. Watch for continuation as momentum favors bulls.
Key Notes:
Price cleared previous resistance levels.
Bullish momentum confirmed by strong candle closes.
Look for pullbacks to support for potential entries.

MIXED SIGNALS ON THE DOLLAR INDEXThe dollar index has beautifully retraced 100% of a bearish Butterfly pattern that was identified between July 1st and August 13th 2025, hitting the monthly support target of 95.911. There has been a strong bounce from this support zone into the weekly closing range.
What we currently have now is also a bullish Butterfly pattern on the daily chart and the bounce from the support zone has retraced to exactly the 0.382 fib level (97.336). The weekly hammer candle suggests that bulls will attempt to reach the 0.5 fib level, however lower time frames shows that the bulls are losing their strength. As such, I am not expecting DXY to continue grinding up next week without a major pullback to retest the weekly candle wicks. Basically expecting a lot of volatility in both directions.
I thank you for checking out my publication and I wish you a successful trading week. Cheers!!

US Dollar Index (DXY) – Institutional Structural OutlookMacro Context
The Dollar Index is currently holding within a weekly demand zone after a prolonged distributive phase. The market is evaluating whether this region will act as a structural accumulation base or if deeper liquidity levels will be tested. Confirmation from COT reports will be crucial to validate institutional positioning.
Technical Structure
Breakout & Acceptance: The last major breakout is still respected, with price now consolidating above demand.
Demand Layers: Three clear demand zones are mapped:
Current Demand – where the market is attempting to accumulate.
Deep Discount Demand – a deeper structural level where liquidity could be absorbed if the first zone fails.
Extreme Deep Discount Demand – ultimate defensive layer, aligned with long-term rebalancing.
Accumulation: Price is building a smaller accumulation range, signaling potential preparation for an institutional move.
Projected Scenarios
Primary Bias (Accumulation/Long): If confirmed by COT, current accumulation may trigger a structural recovery of the Dollar, strengthening against weaker counterparts (AUD, NZD).
Invalidation: A clean break below the current demand would open the path towards deeper demand zones, reframing the context as continuation of distribution.
Confirmation & Monitoring
COT Reports: Weekly positioning will confirm whether institutional players are indeed accumulating or still unwinding Dollar exposure.
Volatility Index (VIX + EVZ): As timing filters for breakout confirmation.
Macro Drivers: Next Fed communications and global liquidity flows remain critical catalysts.
⚖️ Institutional Note: The DXY is at a decision point – smaller accumulation is visible, but validation from institutional flows (COT) is essential before considering a structural recovery.

Dollar Index Holding Up But GBPUSD Might Change That...Dollar = Relative Game, Not Absolute
Dollar Index isn’t just the USD — it’s USD vs a basket (mainly EUR, JPY, GBP).
If the Fed cuts but ECB, BOE, and BOJ are also leaning dovish, the relative advantage doesn’t change; USD stays steady.
The dollar has been consolidating because macro signals are mixed (Fed easing vs US resilience, inflation uncertainty, global growth divergence), and the euro/yen/GBP balance out.
The market is waiting for a clear catalyst — usually a Fed decision, inflation report, or geopolitical shock to break the range.

MY VIEW ON THE DXY - 22 / 26 SEPTEMBER 2025Last week we saw the Index testing a new low, continuing its downward trend, cause by the Feds cutting interest rates.
On the major frames the Index is in fact bearish unless we have a clear move above 101.400.
This week I expect a pullback to the 98.300 - 98.750 critical area of resistance by Tuesday, Powell speech could push the index up to 101.050 - 101.350 or down to new lows in the 96.000 - 95.220 area of support.


DXY (US Dollar Index) AnalysisPrice is currently trading near 97.60 – 97.90, which is a strong resistance zone.
I’ll be waiting for bearish confirmation here before expecting downside momentum.
🔻 If sellers hold this level, we could see DXY drop further, aligning with bearish pressure on USD across correlated pairs (EURUSD bullish, GBPUSD bullish, Gold bullish).
Key Levels:
🔴 Resistance: 97.60 / 97.90
🟢 Target Zone: 95.00
📌 Trading Plan:
Wait for rejection at 97.60 – 97.90 before entering.
Look for sell setups targeting 95.00.
Correlation: Bearish DXY supports bullish momentum in major USD pairs.
⚠️ Risk management is key. Always wait for confirmation before taking positions.

DXYU.S Dollar Index
- Falling Wedge as an corrective pattern in Short Time Frame
- RSI - Divergence
- Completed " 1234 " Impulsive Waves
- Fibonacci Level - 38.20% - 50.00%
- S / R Level

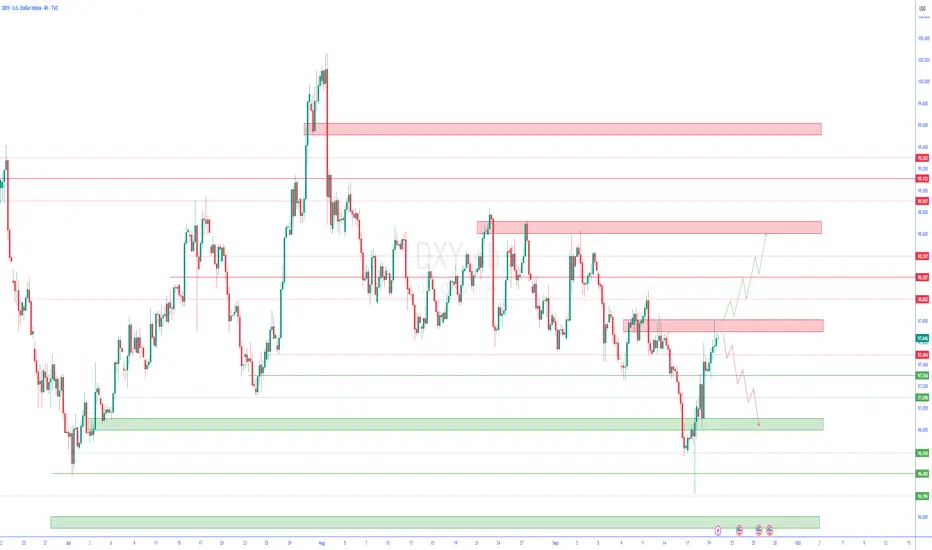
dxy 4hTrading Perspectives for the Upcoming Week
In this series of analyses, we have reviewed short-term trading perspectives and outlooks.
As can be seen, in each analysis there is a significant support/resistance zone near the current asset price. The market’s reaction to or break of this level will determine the future price trend up to the next specified levels.
Important Note: The purpose of these trading perspectives is to examine key price levels and the market’s potential reactions to them. The analyses provided are by no means trading signals!