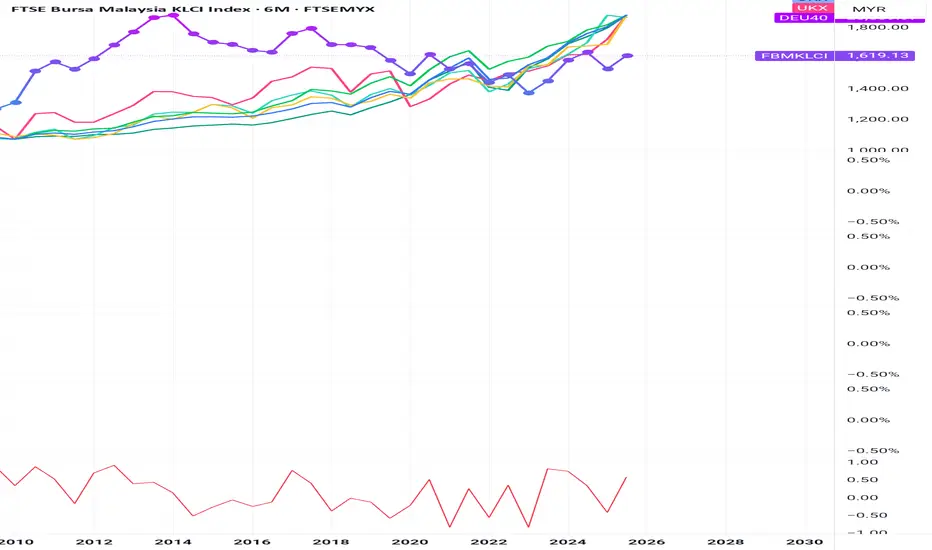
KLCI CONTINUE TO SELLThis is an update from my previous post
-Kindly refer to the link attached
Persistent weakening, Dominating tape of Weakness from Leaders.
I view all rallies as nothing more than a 'counter-trend' rally, in which ,
spots for the institutions to sell their positions
Bar @ 28/11/25 (red arrow), fo
Related indices

Khaleda Zia Safe Exit
Channel: Daily Ittefaq
Tittle: সংকটাপন্ন খালেদা জিয়ার খবর শুনে কান্নায় ভেঙে পড়লেন বিএনপি নেতা | Khaleda Zia | BNP | Ittefaq
May Peace & Blessings be Upon You ,
Soon, Khaleda Zia ( Bangladesh Nationalist Party) will ttake Safe Exit Strategy. This is Guaranteed. Very soon it will be in media.

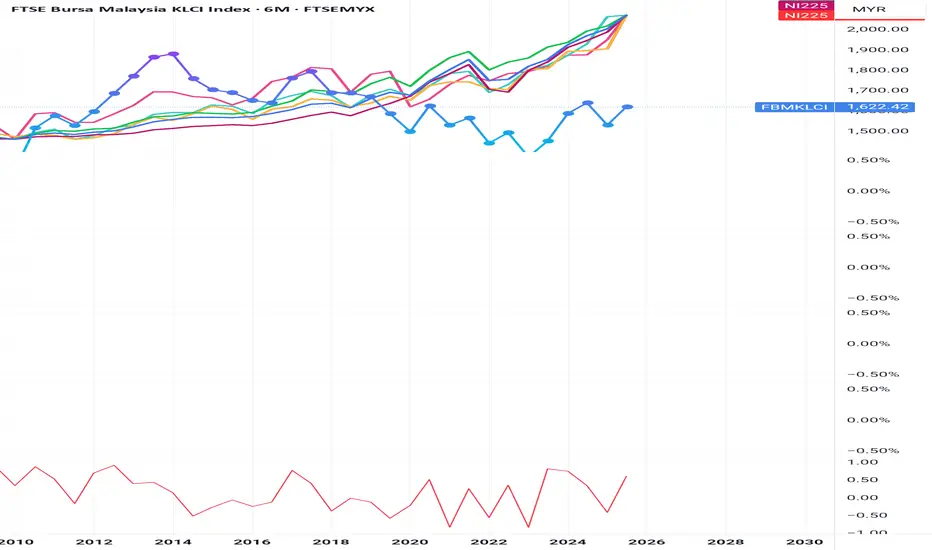
KLCI CONTINUE SELLThis is continuation from my previous thesis :
-Kindly refer to the link attached
As been mentioned, i look the level of 1640-1676 as probably be the end for 2025
Given the pathological and continuous soaring 'sepsis' of market leaders, i dont see any reason to get in :
-volatily around springboar

HUASHANG FINANCE BANK HOLDING GROUP SDN BERHAD World Bank Group Legal Policy List Bursa Malaysia, Huashan Finance Bank Holding Group SDN Berhad will be listed on Bursa Malaysia as the top banking company. It ranks first in banking rankings as Global International World Bank, with a share price of $90 per quarter. The company is also listed under

WORLD BANK GROUP World Bank Group has sued Mahathir Mohamad, alleging he deliberately brought down the Pakatan Harapan government in 2020. He is ordered to pay the World Bank $5,000 billion USD and could face 30 years in prison. NASDAQ:MSFT

Sabah election PRN 17LEE CHEE KEONG SABAH ELECTION PRN17 shares: Buy all the votes and the opposition will get 0.

FINANCIAL SERVICE ACT 2013Ask ACT in for the regulation and supervision of financial institutions, payment system and other relevant entitles.and the oversight of the money' market and for related consequential or incidental matters
(30.6.2013 ) (;except section 129 and schedute 9)
---PU(B) 276/2013 1:1:2013 (SECTION 129&
Singapore release 2020Singapore model AI governance framework focused on
internal governance structure and measure
human involvement in AI augmented decision making
operation management
shareholders interaction and communication
JAPAN FROM 2019
Japan social principle of human centric AI Include

Principle for AI adoption a cross the world (Europe union, adoptThe EU ethics guidelines for trustworthy AI outline the following key principle's
HUMAN angecy and safety
Technical robustness and safety
Privacy and data governance
Transparency
Diversity non- discrimination and fairness
Societal and eviromental well being
Accountability
UNITED
Case study: copilot coding and productive gain in software devel[/ A Microsoft study on GitHub copilot in 2024 ,an Ai pair programmer demonstrated significant time saving for software development,in a controlled experiment software development tasked with implementing an HTTP server in JavaScript completed the project 55.8% faster when using GitHub copilot compa

See all ideas
Summarizing what the indicators are suggesting.
Oscillators
Neutral
SellBuy
Strong sellStrong buy
Strong sellSellNeutralBuyStrong buy
Oscillators
Neutral
SellBuy
Strong sellStrong buy
Strong sellSellNeutralBuyStrong buy
Summary
Neutral
SellBuy
Strong sellStrong buy
Strong sellSellNeutralBuyStrong buy
Summary
Neutral
SellBuy
Strong sellStrong buy
Strong sellSellNeutralBuyStrong buy
Summary
Neutral
SellBuy
Strong sellStrong buy
Strong sellSellNeutralBuyStrong buy
Moving Averages
Neutral
SellBuy
Strong sellStrong buy
Strong sellSellNeutralBuyStrong buy
Moving Averages
Neutral
SellBuy
Strong sellStrong buy
Strong sellSellNeutralBuyStrong buy
Displays a symbol's price movements over previous years to identify recurring trends.
Frequently Asked Questions
The current value of FTSE Bursa Malaysia KLCI Index is 1,614.17 MYR — it has risen by 0.09% in the past 24 hours. Track the index more closely on the FTSE Bursa Malaysia KLCI Index chart.
FTSE Bursa Malaysia KLCI Index reached its highest quote on Jul 8, 2014 — 1,896.23 MYR. See more data on the FTSE Bursa Malaysia KLCI Index chart.
The lowest ever quote of FTSE Bursa Malaysia KLCI Index is 169.83 MYR. It was reached on May 2, 1986. See more data on the FTSE Bursa Malaysia KLCI Index chart.
FTSE Bursa Malaysia KLCI Index value has decreased by −0.79% in the past week, since last month it has shown a −0.21% decrease, and over the year it's increased by 0.22%. Keep track of all changes on the FTSE Bursa Malaysia KLCI Index chart.
The top companies of FTSE Bursa Malaysia KLCI Index are MYX:MAYBANK, MYX:CIMB, and MYX:PBBANK — they can boast market cap of 29.67 B MYR, 20.67 B MYR, and 20.59 B MYR accordingly.
The highest-priced instruments on FTSE Bursa Malaysia KLCI Index are MYX:NESTLE, MYX:HLBANK, and MYX:PETDAG — they'll cost you 111.70 MYR, 21.28 MYR, and 19.22 MYR accordingly.
The champion of FTSE Bursa Malaysia KLCI Index is MYX:PMETAL — it's gained 37.35% over the year.
The weakest component of FTSE Bursa Malaysia KLCI Index is MYX:PCHEM — it's lost −34.09% over the year.
FTSE Bursa Malaysia KLCI Index is just a number that lets you track performance of the instruments comprising the index, so you can't invest in it directly. But you can buy FTSE Bursa Malaysia KLCI Index futures or funds or invest in its components.
The FTSE Bursa Malaysia KLCI Index is comprised of 30 instruments including MYX:MAYBANK, MYX:CIMB, MYX:PBBANK and others. See the full list of FTSE Bursa Malaysia KLCI Index components to find more opportunities.