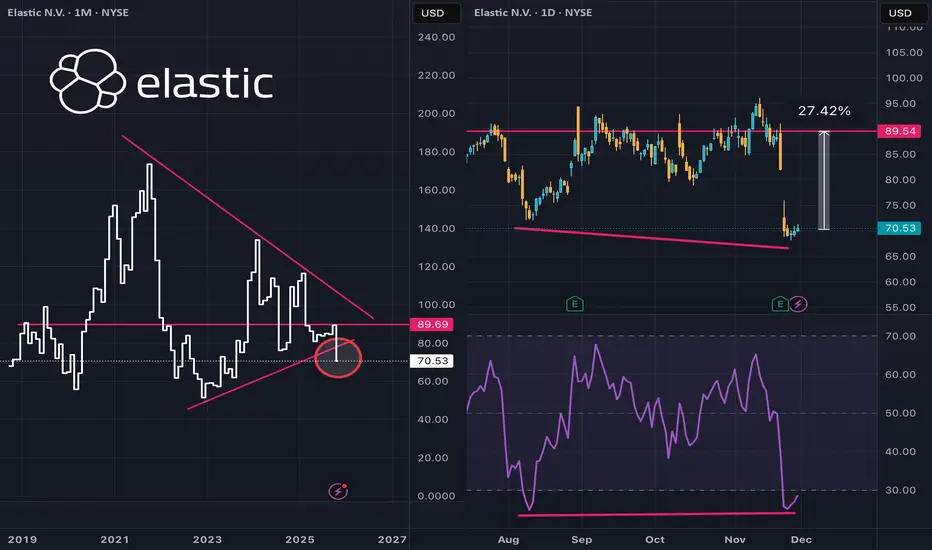
$ESTC creeping towards buy territoryEven after a couple earnings beats in a row NYSE:ESTC has slipped below the bottom edge of a large symmetrical triangle.
Drilling into a daily chart and squinting a bit, there's a mild bullish momentum divergence. Hard to say if the bottom is in just yet, but it does look like one to put on the w
Next report date
—
Report period
—
EPS estimate
—
Revenue estimate
—
−0.90 EUR
−95.46 M EUR
1.31 B EUR
91.80 M
About Elastic N.V.
Sector
Industry
CEO
Ashutosh Kulkarni
Website
Headquarters
San Francisco
Founded
2012
ISIN
NL0013056914
FIGI
BBG00M648748
Elastic NV is a data analytics company, which engages in the provision of open-source search and analytics engine services. It operates through the United States, the Netherlands, United Kingdom, India, and Rest of World geographical segments. The company was founded by Shay Banon, Uri Boness, Steven Schuurman, and Simon Willnauer on February 9, 2012 and is headquartered in San Francisco, CA.
Related stocks
ESTC Trade Analysis & Plan📊 ESTC Trade Analysis & Plan
Symbol: NYSE:ESTC (Elastic N.V.)
Current Price: $89.18
Bias: 🔥 Bullish (Short-to-Mid Term)
🔎 Technical Observations
Double Bottom Formation around the $74.60 level confirms a strong base with buyers defending the zone.
Fibonacci Levels: Price currently consolidatin

ESTC - JULY 24 MATrend Sustainable MomentumMATrend Sustainable Momentum (Systematic) 🚀
This is a variant of the Unsustainable strategy. System identifies stocks (Tech sector) that follows the larger market regime's momentum of the day.

5/30/24 - $estc - difficult setup for longs-caution. out of pool5/30/24 - vrockstar - NYSE:ESTC - careful here. burning a post to warn that this 10x sales valuation but ~20% pa growth and no opex flex + a ton of stock comp obscuring true FCF generation are the factors that are getting murdered in this tape. the stock has been an unlikley winner since strugglin

ESTC - Corrective movement in the downtrendAlignment and partial compression of multitimeframe fibo clouds signal an increase in the probability of reaching the first target. The final target is a possible bonus with a risk-return ratio of 3. Risk management with realization of the first target and moving the stop loss is an indispensable pa

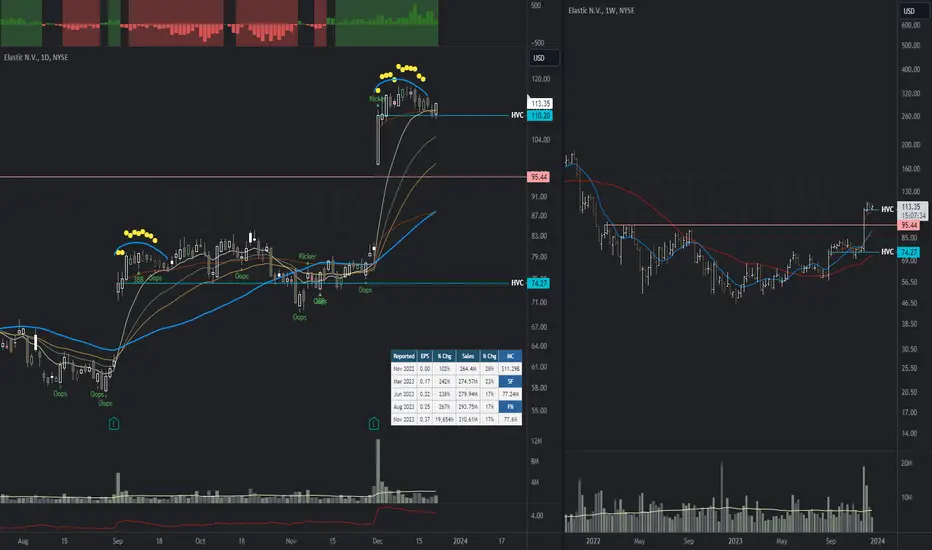
ESTC Pushing Resistance after PEGESTC making a nice run at the downward resistance on the daily. Printed a beautiful PEG after earnings in early December. Nice looking hammer candle during a weak tape suggests this should be a leader when markets bounce.

ESTC 12/21/23Acting very similarly to its previous earnings gap. Three day surge that stays overextended (4x+ ATR from the 10-day avg) for about two weeks, rolls over into 10ema & erVWAP. Expecting similar results or more serious follow-through?
Low volume holiday trading ahead.


See all ideas
Summarizing what the indicators are suggesting.
Neutral
SellBuy
Strong sellStrong buy
Strong sellSellNeutralBuyStrong buy
Neutral
SellBuy
Strong sellStrong buy
Strong sellSellNeutralBuyStrong buy
Neutral
SellBuy
Strong sellStrong buy
Strong sellSellNeutralBuyStrong buy
An aggregate view of professional's ratings.
Neutral
SellBuy
Strong sellStrong buy
Strong sellSellNeutralBuyStrong buy
Neutral
SellBuy
Strong sellStrong buy
Strong sellSellNeutralBuyStrong buy
Neutral
SellBuy
Strong sellStrong buy
Strong sellSellNeutralBuyStrong buy
Displays a symbol's price movements over previous years to identify recurring trends.
Frequently Asked Questions
The current price of 3E1 is 61.56 EUR — it has decreased by −9.07% in the past 24 hours. Watch Elastic NV stock price performance more closely on the chart.
Depending on the exchange, the stock ticker may vary. For instance, on FWB exchange Elastic NV stocks are traded under the ticker 3E1.
3E1 stock has risen by 4.33% compared to the previous week, the month change is a −18.62% fall, over the last year Elastic NV has showed a −41.34% decrease.
We've gathered analysts' opinions on Elastic NV future price: according to them, 3E1 price has a max estimate of 112.89 EUR and a min estimate of 65.13 EUR. Watch 3E1 chart and read a more detailed Elastic NV stock forecast: see what analysts think of Elastic NV and suggest that you do with its stocks.
3E1 stock is 1.30% volatile and has beta coefficient of 1.46. Track Elastic NV stock price on the chart and check out the list of the most volatile stocks — is Elastic NV there?
Today Elastic NV has the market capitalization of 6.76 B, it has increased by 1.42% over the last week.
Yes, you can track Elastic NV financials in yearly and quarterly reports right on TradingView.
Elastic NV is going to release the next earnings report on Feb 26, 2026. Keep track of upcoming events with our Earnings Calendar.
3E1 earnings for the last quarter are 0.55 EUR per share, whereas the estimation was 0.50 EUR resulting in a 11.07% surprise. The estimated earnings for the next quarter are 0.55 EUR per share. See more details about Elastic NV earnings.
Elastic NV revenue for the last quarter amounts to 367.06 M EUR, despite the estimated figure of 362.68 M EUR. In the next quarter, revenue is expected to reach 376.58 M EUR.
3E1 net income for the last quarter is −44.45 M EUR, while the quarter before that showed −21.55 M EUR of net income which accounts for −106.26% change. Track more Elastic NV financial stats to get the full picture.
No, 3E1 doesn't pay any dividends to its shareholders. But don't worry, we've prepared a list of high-dividend stocks for you.
As of Dec 8, 2025, the company has 3.54 K employees. See our rating of the largest employees — is Elastic NV on this list?
EBITDA measures a company's operating performance, its growth signifies an improvement in the efficiency of a company. Elastic NV EBITDA is −20.16 M EUR, and current EBITDA margin is −2.81%. See more stats in Elastic NV financial statements.
Like other stocks, 3E1 shares are traded on stock exchanges, e.g. Nasdaq, Nyse, Euronext, and the easiest way to buy them is through an online stock broker. To do this, you need to open an account and follow a broker's procedures, then start trading. You can trade Elastic NV stock right from TradingView charts — choose your broker and connect to your account.
Investing in stocks requires a comprehensive research: you should carefully study all the available data, e.g. company's financials, related news, and its technical analysis. So Elastic NV technincal analysis shows the sell today, and its 1 week rating is sell. Since market conditions are prone to changes, it's worth looking a bit further into the future — according to the 1 month rating Elastic NV stock shows the sell signal. See more of Elastic NV technicals for a more comprehensive analysis.
If you're still not sure, try looking for inspiration in our curated watchlists.
If you're still not sure, try looking for inspiration in our curated watchlists.