AMAZONAMZN is almost ready to push up further to take ATH.
Disclosure: We are part of Trade Nation's Influencer program and receive a monthly fee for using their TradingView charts in our analysis.
AMZ trade ideas

AWS REVENUE CONCERNS EASED! AMZN EARNINGS MULLIGAN! FULL PORT + NEXT 2 WEEKS OF AMAZON DRIVER WAGES INTO CALLS
26 x 285c 12/19, 5x 280c 11/21
Speculation: We melt up to 235 then pop north for ~10% on the earnings beat + rate cut with SPY 700 EOY projections (In line with GOLDMAN SACHS and WELLS FARGO )
6 of the last 8 earnings reports for AMZN have resulted in 8-12% moves within 7 days. I say, we go up this time. Last time was a perfect earning beat as expected but retail got surprised when big money reacted to AWS revenue concerns.
We broke sideways instead of recovering from the tariff drop like everything else...because of AWS. We know, NOW, it has been taken care of with the WF and GS projections of 275-280 BECAUSE of reported AWS demand....and no, that's not a coincidence. These price targets are exactly where AMZN would be if we stayed in the upward channel from 2023, IMO, and the tariff drop never happened. Essentially, right back on track with other tech companies that have completed the gap fill. (Tariff Drop and Pop) (Depicted on chart)
AMZN is also not one of the companies that have been uselessly name-dropping AI to look pretty on the QRs causing bubble concerns. Logistics speeds were reported to increase by 30% incorporating AI as most of the warehouses are ran substantially by robots in sorting and moving millions of packages daily. I suspect AMZN should weather the looming AI drop for having some tangible impact that can be measured.
At time of writing AMZN is having a 2% day, 24hrs after the new price projections sitting at 226.45 and climbing.
With this good news, + rate cuts
and market rebounding, IM ALL IN!
(Uncle Voice) One moreeee thing, were oversold on the daily chart....
AMZN 20-25%+ in 2 MONTHS

Amazon end of accumulation and expansion will beginAmazon has likely completed its accumulation phase and is showing signs of renewed bullish momentum. A breakout above recent resistance could confirm the start of a new upward trend.
Levels to watch: 232 - 252
⚠️ Not financial advice.

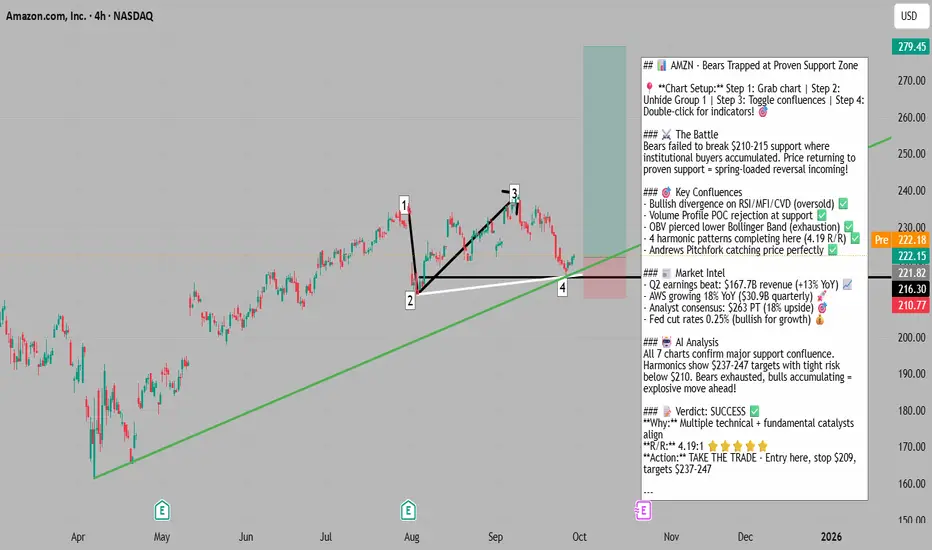
Bears Exhausted at Support - Spring-Loaded Reversal📍 To see my confluences and/or linework: Step 1: Grab chart 📊 Step 2: Unhide Group 1 in object tree 🌳 Step 3: Hide and unhide specific confluences one by one 🔍 Step 4: Double-click the screen to reveal RSI, MFI, CVD, and OBV indicators with divergence markings! 📈
🎯 AMZN: Bears Exhausted at Support - Spring-Loaded Reversal
The Market Participant Battle:
At point 2, bears attempted a major breakdown below the rising channel support, trying to trigger a cascade of stop losses and establish a new downtrend. However, bulls defended aggressively, creating a proven support zone. The move from point 2 to point 3 confirmed bulls' dominance, establishing this level as "proven buyers territory." Now at point 4, we're returning to this same proven support where institutional buyers previously showed their hand. Bears have exhausted their ammunition with multiple failed attempts to break lower, setting up a powerful reversal as price returns to where the smart money accumulated.
Confluences:
Confluence 1: Bullish Divergence Convergence 🔥
At point 4, we have a spectacular bullish divergence setup across multiple indicators. While price made a higher low, RSI, MFI, and CVD candles all printed lower lows - a classic sign of bearish exhaustion. This divergence indicates selling pressure is weakening despite price holding higher, suggesting accumulation is occurring beneath the surface. Both RSI and MFI are in oversold territory, providing the fuel for an explosive move higher.
Confluence 2: Volume Profile POC Rejection 📊
The volume profile from points 1 to 2 shows the Point of Control (highest volume node) sitting exactly at point 2. Price has now returned to test the Value Area High and was immediately rejected upward. This demonstrates that the majority of trading volume occurred at these levels, creating a massive support zone where institutional buyers are defending their positions.
Confluence 3: OBV Bollinger Band Pierce 💪
At point 4, On-Balance Volume pierced below its lower Bollinger Band - a rare occurrence that historically precedes sharp reversals. This suggests that despite the price decline, actual selling volume is reaching exhaustion levels. The OBV divergence confirms accumulation is happening while weak hands are being shaken out.
Confluence 4: VWAP Deviation Trap 🎯
At point 2, price dipped below the first VWAP standard deviation, failed to reach the second deviation (showing limited selling momentum), then aggressively closed back above the first deviation. This trapped bears who were betting on continued downside and created a liquidity vacuum above as shorts scrambled to cover.
Confluence 5: Andrews Pitchfork Precision 📐
The Andrews Pitchfork catches point 4 with surgical precision at its lower median line. This technical tool, favored by institutional traders, provides a mathematical framework showing we're at the extreme lower boundary of the current trend channel. The bounce from this level confirms its significance.
Confluence 6: Harmonic Pattern Convergence 🦋
We have four harmonic patterns all completing at the current level: a Butterfly, Cypher, Bat, and Anti-Cypher. This rare convergence creates a powerful confluence zone. The Butterfly pattern shows a 20.88% profit potential with a 4.19 risk/reward ratio. Multiple harmonic completions at one price level indicate a high-probability reversal zone.
Web Research Findings:
- Technical Analysis: Current RSI at 39.13 indicates neutral conditions with MACD at -0.50 suggesting a buy signal. Multiple moving averages are converging near current levels creating a support cluster.
- Recent News/Earnings: Q2 2025 earnings exceeded expectations with $167.7B revenue (vs $162.09B expected) and $1.68 EPS (vs $1.33 expected). AWS revenue grew 18% YoY to $30.87B.
- Analyst Sentiment: 45 analysts maintain "Strong Buy" consensus with average price target of $262.98, representing 18.37% upside. Recent upgrades from major firms with targets ranging from $230 to $305.
- Data Releases & Economic Calendar: Next earnings expected October 27-31, 2025. Company has beaten EPS estimates 100% of the time in past 12 months.
- Interest Rate Impact: Fed cut rates by 0.25% in September to 4.00%-4.25% range, with two more cuts expected in 2025. Lower rates support growth stock valuations and reduce AWS customers' financing costs.
Layman's Summary:
Think of this trade like a compressed spring. Bears pushed the stock down hard multiple times but couldn't break the floor at $210-215. Each failed attempt made them weaker while bulls quietly accumulated shares. The technical indicators are screaming "oversold" while big institutions are raising their price targets. With the Fed cutting rates (making money cheaper to borrow) and Amazon's cloud business growing strongly, the stock is coiled for a bounce. It's like watching a basketball being pushed underwater - the harder you push, the more violent the bounce when you let go.
Machine Derived Information:
- Image 1 (4H Chart): Rising channel with numbered pivot points - Significance: Shows clear support at point 2 with successful retest at point 4 - AGREES ✔
- Image 2 (4H Duplicate): Confirms first image setup - Significance: Reinforces support zone validity - AGREES ✔
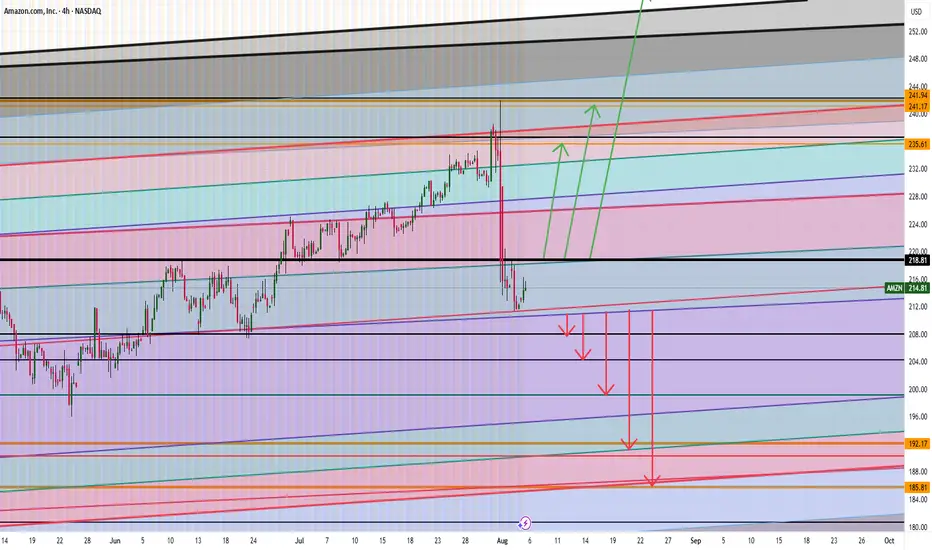
- Image 3 (4H Pitch Fork): Multiple overlapping trendlines converging at current price - Significance: Creates strong magnetic price level - AGREES ✔
- Image 4 (4H Zone): Green and red zones marking supply/demand areas - Significance: Currently at demand zone bottom - AGREES ✔
- Image 5 (4H Channel): Ascending channel with clear boundaries - Significance: Price at lower channel support - AGREES ✔
- Image 6 (4H Horizontal): Key horizontal support at point 2 - Significance: Major support successfully defended - AGREES ✔
- Image 7 (4H Harmonics): Four harmonic patterns completing - Significance: High-probability reversal zone with 4.19 R/R - AGREES ✔
Actionable Machine Summary:
All seven chart images unanimously confirm we're at a critical support level with multiple technical factors aligning for a reversal. The combination of horizontal support, channel support, harmonic pattern completions, and oversold indicators with bullish divergences creates an extremely high-probability long setup. Risk is clearly defined below $210 with targets at $237-$247 based on harmonic projections and analyst consensus.
Conclusion:
Trade Prediction: SUCCESS ✅
Confidence: High
This setup presents a textbook accumulation pattern where smart money has established a floor and retail bears are exhausted. The confluence of bullish divergences, volume profile support, harmonic completions, and fundamental tailwinds from AWS growth and Fed rate cuts creates an asymmetric risk/reward opportunity. Entry at current levels with stops below $210 offers 4:1 reward potential to initial targets.
Breaking: AMZN Bullish Trend Near Key Breakout Levels Current Price: $219.51
Direction: LONG
Targets:
- T1 = $230.00
- T2 = $245.00
Stop Levels:
- S1 = $215.00
- S2 = $210.00
**Wisdom of Professional Traders:**
This analysis synthesizes insights from thousands of professional traders who closely monitor the unique dynamics surrounding AMZN. The stock, a bellwether in the e-commerce and cloud computing sectors, frequently acts as a sentiment indicator for broader tech-related equities. Leveraging collective intelligence from professional trading circles reduces bias and helps confirm breakout trading setups, creating actionable insights that align with high-probability patterns. Traders are increasingly focusing on AMZN’s momentum potential following its critical consolidation phase and key technical signals in recent sessions.
**Key Insights:**
Amazon's recent strategic advancements, including accelerating its AI integration within AWS, have significantly bolstered investor sentiment. The company's expanded cloud partnerships, coupled with new product launches in September 2025, create added optimism for year-end growth forecasts. The stock also enjoys strong underlying support from operational outperformance in key regions while benefiting from a steady increase in Prime user memberships.
On the technical side, AMZN has maintained its bullish trajectory above the 200-day moving average, indicating long-term strength. The stock found robust support at the psychological $210 mark earlier in Q3 and has since formed higher lows, signaling upward momentum. RSI levels are hovering near 60, leaving room for extended bullish movement without oversold conditions.
**Recent Performance:**
AMZN’s price performance in Q3 has been subtly constructive, gaining approximately 12% since July due to robust earnings reporting and resulting analyst upgrades in late September 2025. Following a short consolidation near $215 last week, the stock has resumed an upward breakout, supported by increasing trading volume. Year-to-date performance remains resilient at over 18% gains, reflecting strong investor conviction and growth expectations heading into Q4.
**Expert Analysis:**
Market professionals have identified Amazon as an ideal candidate for rotation in October. Several fund managers expect AWS revenue growth improvements from improving enterprise demand, offering potential upside surprise in Q3’s earnings call slated for November. Technical strategists are also keeping an eye on the $230 resistance level, which marks the next bullish test before a breakout window to $245. Furthermore, the recent increase in institutional buying during September signals accumulating interest among large players, bolstering near-term price confidence.
From a valuation perspective, AMZN continues to trade attractively against future growth metrics. The P/E multiple remains above average but reasonable, considering its leadership role in two dominant sectors. Improvement in margin growth could fortify its case for significant upside, particularly as operational costs stabilize into Q4 2025.
**News Impact:**
Amazon’s September announcement of enhanced AI tools and strategic partnerships within AWS has added positive momentum to the stock. This development highlights management’s focus on high-margin initiatives, which traders believe could increasingly drive earnings acceleration into 2026. Additionally, its entry into the AI-powered advertising market has raised expectations for an expanded ancillary revenue stream. Meanwhile, broader strength in consumer discretionary sectors amid Q4 holiday forecasts suggests short-term tailwinds for primary e-commerce segments.
**Trading Recommendation:**
With AMZN exhibiting bullish technical signals, strong institutional interest, and fundamental catalysts like AI integration, taking a long position with defined risk is warranted. The $215-$210 levels act as dependable support, while the broader market and sector alignment point to upward continuation. Traders should focus on the $230 level as an initial price test, where volume confirmation may justify extended upward targets toward $245. This setup offers an attractive risk-reward scenario moving into Q4 2025.
Do you want to save hours every week? Register for the free weekly update in your language!

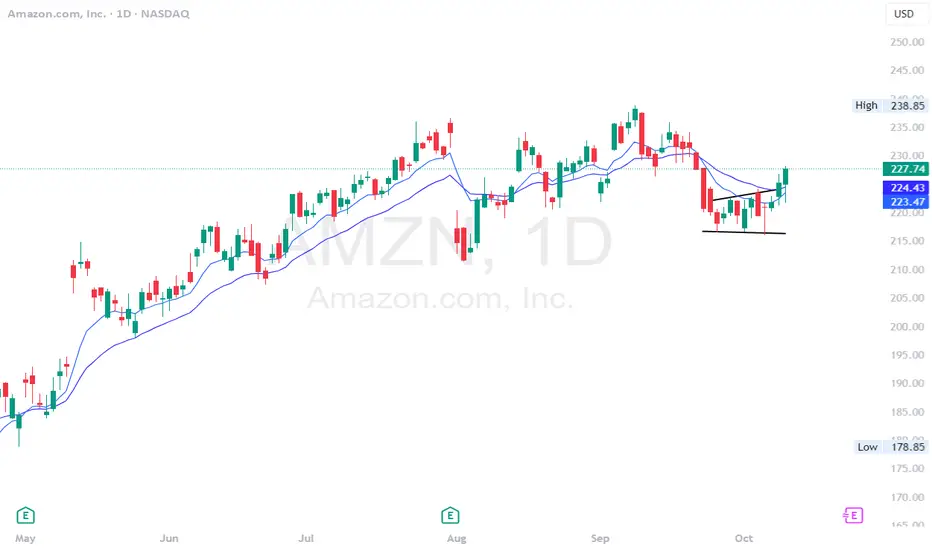
$AMZN massive cup and handle formingIf we look at the chart of AMZN, we can see that $236 has become an important resistance level.
So far, it's been tested multiple times which means that resistance has weakened. I do think that next time we get up to that level, it'll likely break and we can see higher prices.
On top of the resistance being weakened, there's a massive cup and handle forming on the chart. If we end up breaking resistance, the measured target would be the $313 resistance.
I've marked off other important levels on the chart should price break that key resistance level.
Let's see how it plays out over the coming month. Will likely start accumulating calls on any dips.

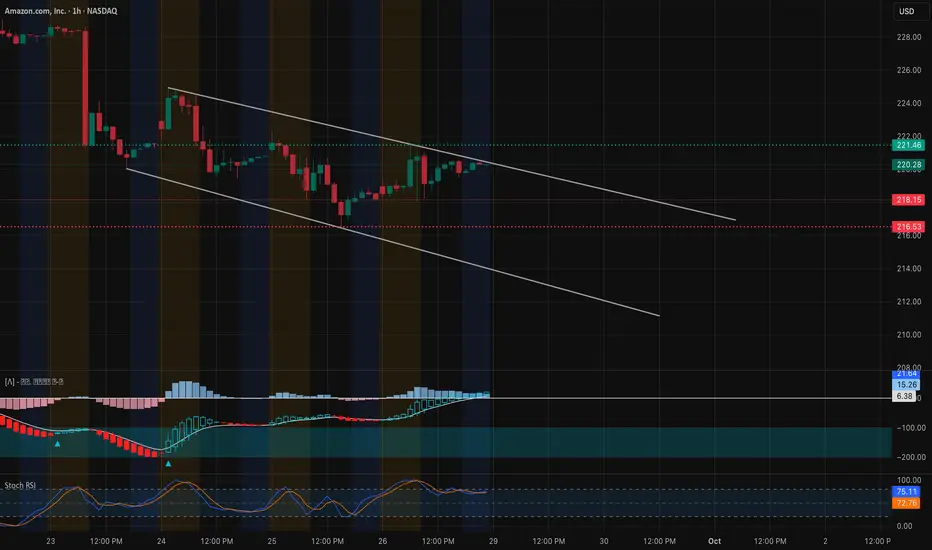
AMZN Break Out -- Bullish1HR time frame paints a good picture of what's to come in the short term...at least from my perspective.
AMZN finally broke through the sideways chop today with momentum and pushed to the 1.618 fib (from the closed peak of the last wave on 10/3 to the closed low on 10/6).
RSI showing momentum and in an upward trend despite the recent choppiness since 9/25.
RSI peaked at about 77, and looking to cooldown after the breakout. I suspect we'll see price revisit mid $223 before continuing upwards. Will most likely see stair stepping up to the $230's.

AMZN OCT 2025AMZN (4H) — Clear rejection from RES 235–244, where heavy sell-side distribution capped every bounce (25B sold marked). Price is compressing under the descending trendline while buyers keep absorbing near 210; 200 remains the next key demand, with a downside gap lurking below.
Targets:
Upside: Break/close above the trendline and 225 → 235, then 240.
Downside: Lose 210 → 205/200; continued weakness opens a gap fill toward 198–195.
#AMZN #globaltrade #investment #investing #stockmarket #wealth #realestate #markets #economy #finance #money #forex #trading #price #business #currency #blockchain #crypto #cryptocurrency #airdrop #btc #ethereum #ico #altcoin #cryptonews #Bitcoin #ipo

AMAZON ARE WE HEADING TO $258 ? HERE IS THE FULL ANALYSIS Hi Trading fam
So we have Amazon and based on what we are seeing we see two scenarios playing out:
Bullish:
If we can break and hold above 219 then we can see levels of : 235,241,and 258 being hit
Bearish:
If break the low of 210 then we hit 207,204, 199, 190 and then 185
Trade Smarter Live Better
Kris
AMZN SHORTAMZN Sitting on a Cliff…
Amazon’s hanging out right on a key trendline around $220. If it holds, cool maybe we bounce. But if it breaks… could get ugly.
Price is testing support from the March uptrend.
Not much volume below = could drop fast if it slips.
Big support zone around $187–$184 (Fib levels).
aggressive selling Volume’s been picking up lately — people are watching.
What I’m Watching:
Lose 220, we get $190 → $185

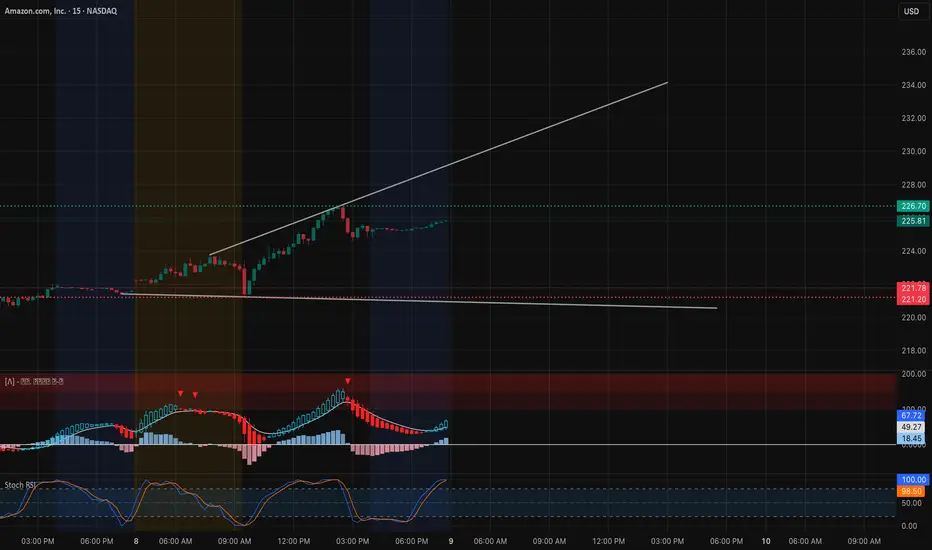
AMZN Oct. 9 — Bulls Defending Key Level, Break Toward $230Amazon (AMZN) has maintained its bullish bias, consolidating around the $225–$226 zone after a strong impulse move from $218 support. The structure remains intact with higher highs and higher lows, supported by Smart Money Concepts (SMC) signals showing BOS (Break of Structure) and CHoCH (Change of Character) confirmations along the way.
On the 15-minute chart, AMZN recently showed a minor CHoCH near $226, suggesting a short-term pullback or liquidity grab before another possible move higher. MACD shows a bullish cross forming again after a brief cooldown, and Stoch RSI is resetting from overbought territory — both pointing toward renewed upside momentum if buyers reclaim $226.7.
On the 1-hour chart, the price is holding above the key HVL ($217.5) and consolidating under a major gamma resistance zone between $227.5–$230. The volume profile supports an ascending structure with healthy accumulation near the current levels.
Support and Resistance Levels:
* Immediate Resistance: $226.70 → $227.5
* Major Resistance (Gamma Wall): $230 → $232.5
* Immediate Support: $221.78 → $220
* Key Support Zone: $217.5 → $215
GEX & Options Sentiment (1H GEX Chart):
* Highest positive Call Gamma resides around $227.5–$230, aligning with visible resistance on the chart.
* Strong Put Support zones form near $215–$217.5, creating a gamma cushion below.
* IVR is elevated at 38.7, with Calls dominating at 38.5%, reflecting a bullish bias among traders.
* The GEX curve remains strongly positive, implying dealer hedging still supports upward pressure if AMZN holds above $222.
Trade Scenarios:
Bullish Setup:
* Entry: Above $226.7 breakout
* Target 1: $230
* Target 2: $232.5
* Stop-Loss: Below $221.5
* Rationale: Maintaining higher lows with bullish GEX and MACD momentum confirms strength for a continuation run toward gamma resistance.
Bearish Setup:
* Entry: Below $221.5 breakdown
* Target 1: $217.5
* Target 2: $215
* Stop-Loss: Above $224
* Rationale: A clear CHoCH with MACD divergence could trigger a retracement into the gamma neutral zone before buyers step back in.
AMZN remains bullish-biased as long as it holds above $222, with $230–$232.5 as the next magnet zone for liquidity and potential option-driven momentum. Watch SPY correlation closely — a breakout in indices could accelerate AMZN’s next leg higher.
Disclaimer:
This analysis is for educational purposes only and does not constitute financial advice. Always do your own research and manage your risk before trading.
AMZN Oct. 1 – Testing $220 Pivot, Which Side Breaks First?Intraday View (15-Min Chart)
AMZN sold off sharply and is now consolidating under a descending trendline near $219. Momentum remains bearish, but support around $218–$219 is trying to hold.
* Support Levels: $218.95, $217.93, $216.48
* Resistance Levels: $220.20, $222.54, $224.81
* Indicators: MACD still red, showing sellers in control. Stoch RSI sitting mid-low, giving room for a possible bounce.
📌 Intraday Thought (Oct. 1): If $219 holds, AMZN could rebound toward $222–$224. A breakdown under $218 risks a slide toward $216. Scalpers can lean long near $219 support with tight stops, or fade into $222.5 resistance if tested and rejected.
Options & Swing View (1H + GEX)
Gamma exposure sets clear levels:
* Upside: Call walls stacked at $222.5–$227.5, with gamma extensions toward $230–$235.
* Downside: Heavy put support at $217.5–$215, with deeper walls at $212.5.
This leaves AMZN boxed between $217.5–$222.5 short term. A breakout over $222.5 could target $227–$230, while losing $217.5 risks continuation into $215 or lower.
* Bullish Play (Oct. 1): Calls or spreads targeting $227–$230 if $222.5 breaks.
* Bearish Hedge: Puts targeting $217.5 → $215 if $218 fails.
* Neutral Play: Iron condor between $217.5–$222.5 while AMZN remains pinned.
My Thoughts (Oct. 1)
AMZN is in a tight coil around $219, with $222 overhead and $217.5 below as key decision levels. A confirmed break of either side should dictate the next swing move. I’d stay cautious intraday until one of those levels clears, then align options with the breakout direction.
Disclaimer: This analysis is for educational purposes only and does not constitute financial advice. Always do your own research and manage risk before trading.

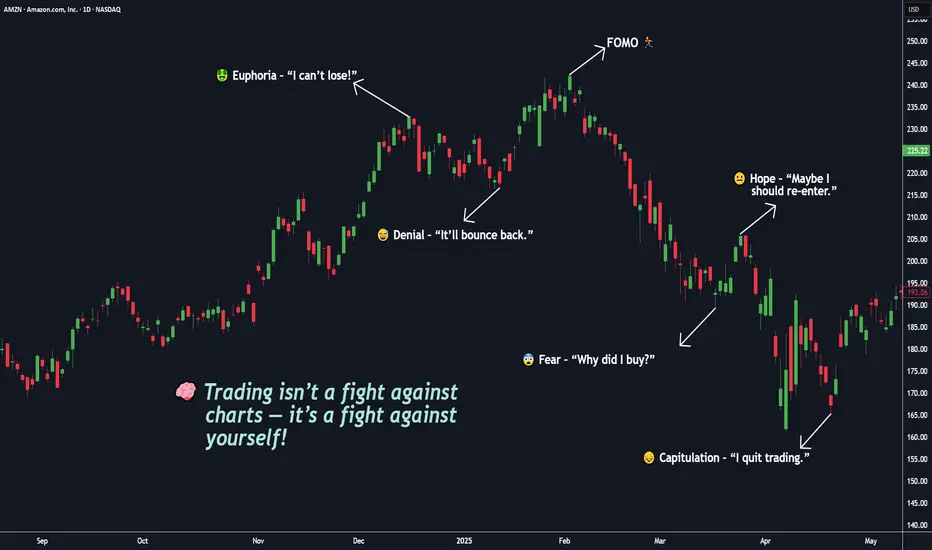
You’re Not Competing With the Market, You’re Competing With Self🧠 Trading isn’t a fight against charts — it’s a fight against yourself.
If you’ve ever told yourself “I’ll just take one more trade”, you already know this battle.
But in truth — the real battle happens inside your mind.
You start your day with discipline: BITSTAMP:BTCUSD , NASDAQ:AMZN , OANDA:XAUUSD , NASDAQ:META
📋 “ Two setups max. 1% risk. No emotions. ”
But then the market shows you something that looks perfect.
Price moves fast. Your pulse jumps. You click “BUY BUY BUY.”
Seconds later , the candle reverses — and suddenly, you chase a candle, break a rule, or move your stop just to “ give it a little more space ,” you’re not losing to the market my friend, You’re losing to your own impulses. ⚔️
You’re not trading the chart anymore — you’re trading your hope. And that’s what makes trading beautiful — it’s not a test of intelligence, it’s a mirror of your self-awareness.
That’s when the market does what it always does: it punishes emotional decisions and rewards patient ones.
💭 Emotionally! You start bargaining with yourself:
“It’ll come back.” ( When you’re greedy → it exposes it. )
“I’ll just move my stop a little.” ( When you’re fearful → it magnifies it. )
“Let me add to average out.” ( When you’re calm → it rewards it. )
The market doesn’t care if you win or lose. It simply amplifies your inner state.
You Digest it or not!, the truth most don’t want to accept:
You can’t control the market.
You can’t control news, indicators, or price spikes.
But you can control your reactions.
The moment you stop reacting and start observing — your trading transforms.
Clarity comes only when emotion leaves. 💎
⚡ Trading isn’t about predicting moves — it’s about managing yourself during those moves.
🎯 Real-Life Example:
Think back to the last time you made money on a random FOMO entry. It felt good, right?
That “instant win” wired your brain to believe impulsiveness works.
But the next time, that same instinct cost you twice as much.
That’s recency bias — one of trading’s silent killers.
Your brain craves the last emotion it felt, not the right decision.
💎 True mastery begins when you stop asking:
“Why did the market do that?”
and start asking:
“Why did I react like that?” ( 👉 “ Am I reacting, or am I responding ?” )
The market has no emotions . It’s just reflecting yours back at you — amplified, delayed, and multiplied by leverage. ⚔️
🧩 Here’s the mindset shift, that changes everything:
You don’t need to win every trade. You need to trade as if you already know yourself.
You don’t need a better indicator. You need a clearer mirror.
The edge isn’t on the screen — it’s inside your head.
When you realize that, trading becomes peaceful and You stop chasing, You start choosing.
Master that single question, and you’ll outperform 90% of traders who never will.
💬 What’s one emotion you think costs you the most trades —
👉 Fear 😨
👉 Greed 🤑
👉 Impatience ⚡
🧩 Drop it below 👇 and let’s talk about how to overcome it — build awareness together as traders, not competitors.
If this Idea gave you a value information then please, Boost it, share your thoughts in comments, and follow for more practical trading!
Happy Trading & Investing!
Team @TradeWithKeshhav
$AMZN - breakout move incomingAMZN - Stock breaking out of consolidation channel on the daily. seeing multiple call flow come in. calls above $230 look good for a breakout move towards all time highs and $250. Stock is strong on indicators.
Startups Reshaping the Global Market1. The Rise of Startups: An Overview
Historically, innovation was primarily the domain of large corporations and research institutions. However, over the past two decades, the entrepreneurial landscape has shifted dramatically. Several factors have contributed to the meteoric rise of startups:
Technological democratization: The proliferation of cloud computing, mobile technology, artificial intelligence, and blockchain has lowered the barriers to entry for new ventures. Entrepreneurs can now build sophisticated products with limited capital.
Access to capital: Venture capital firms, angel investors, and crowdfunding platforms have emerged as powerful engines of startup growth. Global investment in startups has grown exponentially, enabling ambitious ideas to scale quickly.
Global connectivity: The internet and digital platforms allow startups to reach global audiences instantly, bypassing traditional geographic limitations.
Changing workforce dynamics: Millennials and Gen Z are more inclined toward entrepreneurial ventures, valuing flexibility, creativity, and purpose over conventional employment.
This environment has produced a surge in startups capable of challenging market incumbents and introducing disruptive innovations at unprecedented speed.
2. Disruption Across Sectors
A. Financial Technology (FinTech)
One of the most prominent areas of startup-driven disruption is the financial sector. FinTech startups have fundamentally altered the way people save, invest, borrow, and transact:
Digital payments and banking: Companies like Stripe, PayPal, and Revolut offer seamless digital payment solutions, reducing reliance on traditional banks. In emerging markets, mobile-based payment platforms like M-Pesa have revolutionized access to financial services.
Investment platforms: Startups like Robinhood and Zerodha democratize investing, allowing retail investors to participate in markets previously dominated by institutional players.
Cryptocurrency and blockchain: Blockchain startups such as Coinbase, Binance, and Chainalysis are redefining the concept of currency, security, and decentralized finance (DeFi).
The result is a more inclusive financial ecosystem that challenges conventional banking and payment systems.
B. Healthcare and Biotechnology
Healthcare has traditionally been slow to adopt technology due to regulatory complexities, but startups are driving profound changes:
Telemedicine: Platforms like Teladoc and Practo enable remote consultations, reducing the need for physical visits and improving access to care in remote regions.
Personalized medicine: Startups such as 23andMe and GRAIL leverage genetic data to offer personalized treatments and early disease detection.
Medical devices and diagnostics: Innovators are creating portable, AI-powered diagnostic tools that enhance efficiency and reduce costs.
These startups are not only improving patient outcomes but also creating entirely new healthcare delivery models.
C. Transportation and Mobility
The transportation sector has undergone a radical transformation thanks to startups:
Ride-sharing and mobility-as-a-service: Uber, Lyft, and Didi Chuxing have redefined urban mobility, challenging traditional taxi services while introducing app-based convenience.
Electric vehicles and sustainable transport: Tesla, Rivian, and Nio have catalyzed the electric vehicle revolution, while startups in micromobility—like Lime and Bird—promote sustainable short-distance transportation.
Logistics and supply chain innovation: Companies like Flexport and Convoy use technology to optimize shipping, reduce costs, and improve transparency.
These innovations not only enhance convenience but also contribute to sustainability by reducing carbon footprints.
D. E-commerce and Retail
Startups have radically reshaped consumer behavior and retail structures:
Direct-to-consumer (DTC) brands: Companies like Warby Parker, Glossier, and Casper bypass traditional retail channels, connecting directly with customers online.
Marketplace platforms: Amazon, Shopify, and MercadoLibre empower smaller sellers to reach global audiences.
AI-driven personalization: Startups utilize AI to recommend products, optimize pricing, and enhance customer experience.
As a result, consumers enjoy more choices, lower prices, and personalized shopping experiences, while traditional retailers are forced to innovate or risk obsolescence.
E. Education and Skill Development
The education sector, long dominated by institutions resistant to change, is now witnessing a surge of edtech startups:
Online learning platforms: Coursera, Udemy, and Byju’s provide accessible, flexible, and often affordable education options for global learners.
Skill development and upskilling: Startups like Skillshare and Pluralsight focus on professional development, bridging the gap between academic knowledge and industry needs.
Gamification and AI-driven learning: Innovative tools adapt to individual learning patterns, making education more engaging and effective.
These startups are democratizing knowledge, enabling lifelong learning, and fostering a global talent pipeline.
F. Renewable Energy and Sustainability
Sustainability has become a crucial driver of startup activity:
Clean energy startups: Companies like Rivian, Nextracker, and Sunrun innovate in solar, wind, and battery storage technology.
Circular economy and waste management: Startups focus on recycling, waste-to-energy solutions, and reducing industrial pollution.
Carbon management platforms: Technologies that track, verify, and reduce carbon footprints are increasingly critical as regulatory frameworks tighten globally.
These ventures not only target environmental goals but also create lucrative new markets for sustainable products and services.
3. Drivers of Global Impact
Several key characteristics allow startups to reshape global markets more effectively than traditional companies:
Agility and adaptability: Startups can pivot quickly in response to market feedback, regulatory changes, or technological advancements.
Customer-centric innovation: Unlike legacy corporations bound by legacy systems, startups design products around real user needs, often delivering superior experiences.
Scalable technology: Digital platforms, cloud computing, and AI enable rapid global expansion without proportional increases in cost.
Collaborative ecosystems: Startups leverage partnerships, open-source frameworks, and global networks to accelerate innovation.
Risk tolerance: Higher tolerance for failure allows startups to experiment with bold ideas that incumbents may avoid.
4. Global Examples of Startup Influence
A. United States
The U.S. continues to be a hub for tech-driven startups:
Silicon Valley dominance: Companies like Airbnb, Stripe, and SpaceX exemplify how U.S. startups influence sectors ranging from hospitality to aerospace.
Innovation culture: A strong emphasis on entrepreneurship, venture capital availability, and a skilled workforce enables continuous market disruption.
B. Asia
Asian startups are redefining markets in their regions and globally:
China: Alibaba, Tencent, and Bytedance dominate e-commerce, social media, and entertainment, influencing consumer behavior worldwide.
India: Flipkart, Paytm, and Ola demonstrate the potential of emerging-market startups to scale rapidly while addressing local challenges.
Southeast Asia: Grab and Gojek epitomize mobility and fintech innovation tailored to regional needs.
C. Europe
Europe fosters innovation in sustainability, biotech, and deep tech:
Sustainability startups: Companies like Northvolt focus on green energy and battery production.
Fintech hubs: London and Berlin incubate fintech startups that challenge European banking norms.
Cross-border scalability: EU policies facilitate startups accessing multiple markets efficiently.
D. Emerging Markets
Startups in Africa, Latin America, and the Middle East address unique local challenges while achieving global relevance:
Fintech in Africa: M-Pesa (Kenya) revolutionized mobile banking in regions with limited financial infrastructure.
E-commerce in Latin America: MercadoLibre democratizes online shopping across the continent.
Energy innovation in the Middle East: Startups focus on solar and smart-grid technologies to address energy scarcity.
5. Economic and Social Implications
Startups’ impact on the global market is not confined to technological disruption—they also have significant economic and social consequences:
Job creation: Startups create direct employment opportunities and stimulate ancillary sectors, fostering broader economic growth.
Market competition: Disruption forces incumbents to innovate, ultimately benefiting consumers through better products and services.
Globalization: Startups accelerate the diffusion of ideas, products, and business models across borders.
Inclusivity: By targeting underserved populations or regions, startups foster greater economic inclusion.
Wealth creation: Successful startups generate significant returns for founders, employees, and investors, contributing to wealth distribution and financial dynamism.
6. Challenges and Risks
Despite their potential, startups face substantial challenges:
Funding volatility: Venture capital cycles can lead to sudden liquidity crises for startups dependent on external financing.
Regulatory hurdles: Compliance with local laws, especially in finance, healthcare, and data privacy, can slow growth.
Market saturation: High competition within startup ecosystems can lead to rapid failure rates.
Technological risks: Dependence on emerging technologies carries the risk of obsolescence or failure to achieve scalability.
Global economic shocks: Startups are often vulnerable to macroeconomic disruptions, geopolitical tensions, and supply chain volatility.
Understanding and mitigating these risks is essential for startups to achieve sustainable global influence.
7. Future Outlook
The influence of startups on global markets is poised to expand:
Artificial Intelligence and automation: Startups developing AI-powered tools will transform productivity, decision-making, and customer engagement across industries.
Climate tech and sustainability: The global push toward net-zero emissions will create vast opportunities for startups addressing energy efficiency, carbon reduction, and resource optimization.
Healthcare innovation: Advances in biotechnology, personalized medicine, and digital health will continue to redefine healthcare delivery.
Space and frontier technologies: Companies like SpaceX, Blue Origin, and emerging space startups will expand markets beyond Earth.
Global collaboration: International partnerships, cross-border incubators, and digital platforms will enable startups to scale globally faster than ever before.
Startups’ ability to rapidly experiment, innovate, and adapt positions them as crucial architects of the future economic landscape.
8. Conclusion
Startups are no longer peripheral players—they are central to the evolution of the global market. Their capacity for disruption, combined with technological innovation, global connectivity, and customer-focused strategies, allows them to challenge entrenched incumbents, redefine industries, and create new economic paradigms. While they face challenges from regulation, funding, and competition, their agility and creativity make them uniquely suited to shape the world economy in the 21st century.
In essence, startups are not just creating companies—they are creating new markets, new business models, and new ways of living and working. As they continue to scale and expand, their influence on global trade, investment, technology, and society will only grow, making them indispensable drivers of economic and social transformation.

Amazon Building Launch Pad - ABC Flat Appears as if this is forming a perfect ABC Flat correction, however tis market is so bull it may start next week from this price, if we can get some seasonal weakness in October hoping it fills the GAP. Leg into longs if it continues to decline.
But interestingly enough, what I have found in the past , is that the stock seems to be weak in the 4th quarter, which seems contrary to the fact that it does so much retail business in those months, and actually bulls hard in 1st quarter. So i think its worth watching to see what happens this time around.

AMAZON STOCKS AMAZON stocks pulled out of trend and picked liquidity and back on bullish path, the key drivers for the uptrend will be the following investment into critical infrastructure its building with a strong diversified portfolio in the following
Amazon Web Services (AWS) Growth:
AWS remains Amazon’s largest and most profitable division, generating over $30 billion in quarterly revenue. Demand for cloud infrastructure, especially driven by artificial intelligence workloads and enterprise digital transformation, is fueling AWS growth. AWS’s market share is around 31%, making it the global leader, and new initiatives like AI chatbot Nova add to future growth potential.
Advertising Revenue Expansion:
Amazon’s advertising business is rapidly growing, reaching $15.7 billion in revenue in Q2 2025, up 22% year-over-year. Its robust platform, spanning e-commerce, Prime Video, Twitch, and partnerships with Roku and Disney, positions Amazon as a major digital advertising player.
Innovation in Robotics and Logistics:
Investments in robotics and warehouse automation, including deploying over one million robots and launching same-day grocery delivery, are improving operational efficiency, reducing costs, and supporting faster delivery. These innovations enhance Amazon’s competitive moat.
E-commerce and Fresh Grocery Expansion:
Amazon's push into fresh grocery and same-day delivery strengthens its retail presence against competitors like Walmart and Instacart, capturing growing consumer demand for convenience.
Profitability and Margin Improvement:
The company is showing rising operating income and improved profit margins in both North American and international operations due to operational efficiencies and disciplined cost management.
International Expansion:
Emerging markets present opportunities to increase digital retail penetration, expand Prime subscriptions, and grow AWS adoption.
AI Integration and Products: Ongoing AI integrations across AWS, e-commerce, and devices (e.g., Alexa+) drive innovation and customer engagement.
Strategic Partnerships: Collaborations with Disney, Roku, and others in advertising and streaming enhance ecosystem stickiness and revenue diversity.
Large Market Cap and Financial Health: With a market cap around $2.5 trillion and strong cash flow generation, Amazon has robust resources to invest in growth.
Potential New Market Entrants: Entry into new markets through acquisitions or innovations could unlock further upside.
Amazon is doubling down on AI investments, especially through its cloud computing arm AWS, to develop generative AI capabilities.
The company has invested billions in AI startups like Anthropic (over $8 billion), aiming to strengthen AI collaborations and embed AI-powered products across Amazon services.
Top Companies and Shareholders Holding Amazon Shares in 2025
Jeff Bezos (Founder and Executive Chairman): Owns around 883 million shares (about 8.3% of the company). Despite recent sales of some shares, Bezos remains the largest individual shareholder with a stake valued at approximately $197 billion.
Andrew Jassy (CEO): Holds about 2.2 million shares (a small fraction but significant insider holding), representing his commitment and confidence in the company.
Major Institutional Investors and Asset Managers:
The Vanguard Group: Holds approximately 7.4% of Amazon’s shares, making it one of the largest institutional investors by assets under management.
BlackRock, Inc.: Owns about 6.1% of the outstanding shares and is another top institutional holder globally.
State Street Corporation: A major institutional investor with multi-billion-dollar holdings.
Fidelity Investments: Another top holder known for active management and long-term investments.
Geode Capital Management: Significant institutional stake, often involved in indexing and fund management.
Top Hedge Funds Holding Amazon:
Coatue Management
Adage Capital Management
Tiger Global Management
Skye Global Management
Two Sigma Investments
Major Companies Owned by Amazon
Whole Foods Market: A leading organic grocery chain, acquired in 2017, expanding Amazon's footprint in physical retail and groceries.
Zappos: An online shoe and clothing retailer known for exceptional customer service, acquired in 2009.
Twitch: The popular live streaming platform, especially for gamers and e-sports, acquired in 2014.
IMDb: The Internet Movie Database, an online repository for films, TV shows, and celebrity information, acquired in 1998.
PillPack: An online pharmacy that offers sorted medication delivery, acquired in 2018, marking Amazon's entrance into healthcare.
Goodreads: A social platform for book lovers to review and discuss literature, acquired in 2013.
Souq.com: A major e-commerce platform in the Middle East, acquired in 2017 to strengthen Amazon’s presence in that region.
Ring: Manufacturer of smart doorbells and security cameras, acquired in 2018, integrated with Amazon's home device ecosystem.
ComiXology: A digital platform for comics and graphic novels, acquired in 2014.
Woot: An online deals retailer known for daily limited-time offers, acquired in 2010.
MGM (Metro-Goldwyn-Mayer): Acquired in 2021, MGM is a legendary film and TV studio that bolsters Amazon Prime Video’s content library.
Kuiper Systems: Amazon’s ambitious satellite internet project aimed at providing global broadband connectivity.
Amazon's Subsidiaries also include:
Amazon Web Services (AWS): The highly profitable cloud computing division offering infrastructure, software, and AI services.
Amazon Robotics: Specializing in warehouse automation and robotics technology.
Amazon Fresh and Amazon Go: Physical grocery and convenience stores specializing in fresh food and cashier-less shopping experiences.
Zoox: An autonomous vehicle startup acquired to develop self-driving car technologies.
This extensive network of companies helps Amazon diversify revenue streams, expand ecosystem lock-in, and innovate across multiple sectors.
Wall Street analysts remain bullish on Amazon, with many maintaining a "Strong Buy" rating based on these catalysts.
NOTE;218.52 BUY POSITION IS GOOD AND TARGET WILL BE 283.74.
#AMAZON #STOCKS

Amazon Can Stabilze Near $210Amazon has been pulling back lately, and I’ve been tracking this as a potential wave four flat correction, with wave A and wave B already completed and wave C now eyeing the support around 210. That zone also lines up with the 0.382 Fibonacci retracement and previous breakout levels, so it could attract buyers and provide stabilization. The retracement is quite deep at around 12 percent, but since the stock has not yet retested February highs, it looks more like a consolidation, a pause rather than a new bearish trend. I assume there is a chance for a nice bounce into wave five, still this year.
GH

AMZN – Coiling Snap Back as Gamma Signals Set the Range Sep 291-Hour Technical Outlook
Amazon is still moving inside a descending channel that’s been intact for over a week. Price has been repeatedly testing the $217.5–$218 support while carving out slightly higher lows—early signs of a basing attempt. Current price near $220 is rubbing against the channel’s downtrend line. MACD histogram is building positively and Stoch RSI is holding in bullish territory, hinting at upside momentum if buyers press through resistance.
Key upside levels are $221.5 and $222.5, followed by the major swing zone at $227.5–$230. Support rests at $218.1, then $216.5, where a decisive break could open a retest of the recent lows near $215.
Gamma Exposure (GEX) Confirmation:
Options positioning strengthens the map:
* Highest positive GEX / Call Resistance sits at $225, aligning with the top of the recent structure.
* A dense second call wall clusters at $222.5, which explains why price has stalled there.
* On the downside, dealers show heavy put support at $217.5 and $215, matching the key channel floor.
If AMZN can close above $222.5 with volume, gamma hedging could fuel a quick push to $227.5–$230. A sustained drop through $216.5 would likely bring dealer-driven pressure to $215.
Trade Ideas & Option Plays for This Week
* Bullish Play: Enter on an hourly close above $222.5, targeting $227.5–$230. Options: 1-week 222.5 calls or a 222.5/227.5 call debit spread for lower risk.
* Bearish Play: Short below $216.5, targeting $215 and possibly $212.5. Consider short-dated puts or 217.5/212.5 put spreads.
* IVR around 27.9 and IVx avg near 34 means premiums are moderate—good for defined-risk spreads.
My Take
AMZN is setting up for a clean range expansion. A decisive breakout above $222.5 would turn the short-term tide bullish with room to $230. But if $216.5 cracks, sellers could quickly push to the $215 zone. Watch the open and first hour closely—gamma levels and volume will tell the story.
Disclaimer: This analysis is for educational purposes only and does not constitute financial advice. Always do your own research and manage risk before trading.
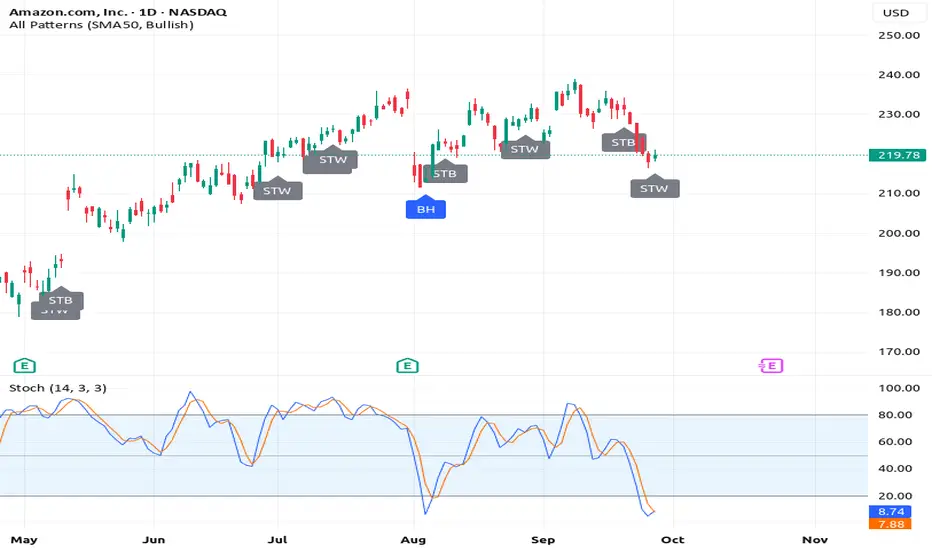
The #1 Chart Pattern:Ascending Triangle - Amazon StockMan am doing my research
and did you know
that you can start a business
using your trading
skills?
This is mind blowing to me
i didn't think a skill
like trading can actually
be a full time
professional career.
So here i am banging my
head against the wall
thinking trading is a hustlers game
with no professional career
at the end of the tunnel.
But this thought is so false.Guys
trading is a real business
infact its the highest
form of business out here.
If you take this thing serious it can lead
to your financial freedom.
Because of this am going to have
a professional trading career
in the future you guys.
I didn't know that it gets this huge.
Am so humbled by this.
The fact that the government
recognises trading as a skill
has really humbled me
And now am starting to
appreciate people
like Robert Kiyosaki.
Who keep encouraging
young people to take up
financial education and change
their lives.
My life has changed or at least
my mindset has seen beyond
what my poor brain could imagine
man.
Anyway look at this chart. NASDAQ:AMZN
Look at the stochastic..(14,3,3)
When that blue line crosses above
the orange line
It will signal an entry signal.
But dont be excited and
expect the price to jump
up immediately.
The pattern is called "Ascending triangle"
This means the price will bounce off the resistance.
before it breakouts out..
That bounce from resistance will form
higher lows which get closer to
the breakout point.
The Spinning Top White Is
The Candlestick charting
technique am using here
Which i learnt from
reading Steve Nison's Book
On Japanese
Charting Techniques,
second edition.
Rocket boost this content to learn more.
Disclaimer: Trading is risky
please risk management
and profit taking strategies.
Also feel free to use a
simulation trading account.
Also dont trade Zero day
options that expire in one day,
please take this as a serious warning.
Introduction to Commodity Supercycle1. Understanding Commodities
Commodities are basic goods used in commerce that are interchangeable with other goods of the same type. They serve as the foundation of the global economy and are divided into several categories:
Energy commodities – oil, natural gas, coal
Metals – gold, silver, copper, aluminum
Agricultural commodities – wheat, corn, soybeans, coffee
Livestock – cattle, pork, poultry
Commodities are distinguished from manufactured products by their standardization and global demand. A barrel of crude oil, for example, is fundamentally the same regardless of producer, allowing it to be traded globally.
2. What is a Commodity Supercycle?
A commodity supercycle refers to an extended period, often lasting 10–30 years, during which commodity prices trend above their long-term average due to structural changes in global demand and supply. Unlike regular commodity cycles, which are typically shorter (3–5 years), supercycles are driven by macroeconomic forces rather than temporary market fluctuations.
Key characteristics of a commodity supercycle include:
Prolonged high prices – commodity prices remain above historical averages for extended periods.
Global demand drivers – typically fueled by emerging markets’ industrialization and urbanization.
Supply constraints – limited capacity to quickly increase production.
Inflationary pressures – rising commodity prices impact broader inflation trends.
Investment opportunities – commodities and related assets tend to outperform other asset classes.
3. Historical Perspective of Commodity Supercycles
Commodity supercycles are not a new phenomenon. Historical analysis highlights several key supercycles:
3.1 The 19th Century Industrialization Cycle
The first recognized supercycle emerged during the Industrial Revolution. Demand for coal, iron, and other raw materials surged as Western Europe and North America industrialized. Key drivers included mechanization, railway construction, and urbanization.
3.2 Post-World War II Reconstruction
Following WWII, Europe and Japan required massive reconstruction. Commodity demand, especially for steel, copper, and oil, rose sharply. This period also saw significant government investment in infrastructure, creating long-term demand pressures.
3.3 The 2000s China-Led Supercycle
The most cited modern supercycle was driven by China’s industrial boom. Rapid urbanization, construction, and manufacturing required unprecedented volumes of metals, energy, and agricultural products. During this period:
Copper prices increased fivefold between 2003 and 2007.
Iron ore prices surged over 400% between 2003 and 2008.
Oil prices reached historic highs, peaking above $140 per barrel in 2008.
This supercycle illustrates the impact of a single economy’s rapid growth on global commodity markets.
4. Drivers of Commodity Supercycles
Several structural and cyclical factors contribute to the formation of supercycles:
4.1 Economic Growth in Emerging Markets
Emerging economies, particularly China, India, and Brazil, experience rapid urbanization and industrialization. Their growing demand for raw materials drives prices upward globally.
4.2 Population Growth and Urbanization
Increasing population, especially in developing countries, creates long-term demand for energy, food, and construction materials. Urban infrastructure, housing, and transportation projects amplify this effect.
4.3 Technological Advancement and Industrialization
While technology can sometimes reduce demand through efficiency gains, large-scale industrialization typically increases the need for steel, copper, and energy-intensive resources.
4.4 Supply Constraints
Unlike demand, which can surge quickly, commodity supply often lags due to:
Long lead times for mining and energy projects
Geopolitical risks in resource-rich regions
Environmental regulations limiting extraction
This imbalance between rising demand and constrained supply sustains higher prices.
4.5 Inflation and Monetary Policy
Periods of loose monetary policy and low real interest rates often coincide with commodity supercycles. Investors seek inflation hedges, and commodities become attractive, creating a self-reinforcing cycle.
5. Key Commodities in Supercycles
Certain commodities are more prone to supercycle effects due to their strategic importance:
5.1 Energy Commodities
Crude Oil: Critical for transportation and industrial production.
Natural Gas: Heating, power generation, and chemical feedstock.
Coal: Industrial power, especially in emerging markets.
Energy demand rises with urbanization, industrialization, and global transport expansion, often driving supercycle trends.
5.2 Metals
Copper: Integral for electrical systems, construction, and electronics.
Iron Ore & Steel: Essential for infrastructure and heavy industry.
Aluminum & Nickel: Key for manufacturing, transportation, and battery production.
Technological advances like electrification and renewable energy further boost demand for certain metals.
5.3 Agricultural Commodities
Grains (wheat, corn, rice): Food security concerns, population growth.
Soybeans & Edible Oils: Rising protein consumption and industrial applications.
Coffee & Sugar: Urban lifestyle changes and consumer demand.
Weather patterns, climate change, and land scarcity can intensify supply constraints.
6. Investment Implications of Commodity Supercycles
Commodity supercycles create both opportunities and risks for investors:
6.1 Asset Classes Benefiting
Commodity Futures and ETFs: Direct exposure to price increases.
Mining and Energy Stocks: Profit from rising commodity prices.
Infrastructure Investments: Higher raw material demand can boost certain industries.
6.2 Risks
Volatility: Despite long-term trends, commodities remain cyclical in the short term.
Inflation and Currency Risk: Commodities often trade in USD, affecting returns for other currencies.
Geopolitical Events: Resource nationalism, wars, and trade restrictions can impact supply.
6.3 Strategic Positioning
Long-term investors often diversify across commodities and related equities to capture supercycle gains while mitigating risk.
7. Measuring and Identifying Supercycles
Economists and market analysts use several tools to identify supercycles:
7.1 Real Price Trends
Adjusting for inflation, analysts track long-term price trends to distinguish supercycles from temporary spikes.
7.2 Supply-Demand Gaps
Persistent supply shortages relative to rising demand indicate potential supercycle formation.
7.3 Macro Indicators
Urbanization rates
Industrial production growth
Energy consumption patterns
These indicators signal structural demand trends that can drive supercycles.
7.4 Investment Flows
Tracking institutional investment in commodities can reveal market expectations of long-term price growth.
8. The Role of Emerging Technologies
Emerging technologies can both create and sustain supercycles:
Electric Vehicles (EVs): Surge in copper, lithium, nickel, and cobalt demand.
Renewable Energy Infrastructure: Increases need for steel, aluminum, and rare earth metals.
Smart Agriculture: Efficient production can ease pressure on food commodities but also raises demand for fertilizers and energy.
Technology-driven demand tends to be structural and long-lasting, aligning with supercycle characteristics.
9. Environmental and Geopolitical Considerations
9.1 Climate Change
Extreme weather affects crop yields and energy supply.
Stricter environmental regulations may restrict mining, oil drilling, and fossil fuel production.
9.2 Geopolitical Risks
Resource-rich countries may leverage commodities for political influence.
Trade wars and sanctions can disrupt supply chains, further impacting prices.
10. Future Outlook
Many analysts believe a new commodity supercycle may be emerging due to:
Post-pandemic industrial recovery
Rapid energy transition to renewables
EV and battery metal demand
Geopolitical shifts and supply chain restructuring
However, global economic slowdowns, technological breakthroughs, and policy interventions could temper or extend the supercycle’s trajectory.
Conclusion
Commodity supercycles represent one of the most significant long-term economic phenomena affecting markets, investors, and nations. Driven by structural demand growth, supply constraints, and technological innovation, they influence global trade, inflation, and investment strategies. Recognizing the signals of a supercycle allows governments, corporations, and investors to strategically position themselves to benefit from prolonged commodity trends. While predicting the exact duration and magnitude is challenging, historical patterns provide valuable guidance for navigating future supercycles.
AMZN: Looking HOT!Watching the reactions to the zone. I will innit ate the position if we land on the support or if my AI system gives me an entry.

AMAZON FREE SIGNAL|SHORT|
✅AMZN Price rejects supply area with ICT displacement, showing bearish order flow. Liquidity below 217$ becomes the likely draw as inefficiency invites continuation.
—————————
Entry: 220.10$
Stop Loss: 222.00$
Take Profit: 217.00$
Time Frame: 2H
—————————
SHORT🔥
✅Like and subscribe to never miss a new idea!✅
