AMZ trade ideas

BearishThe rally looks weak with a clear sign of market manipulation. The rally was not an authentic move. Compare it to the closing candle of the day before and it confirms even more signs of manipulation.
There is selling pressure with large upper wicks and the major trend is down. This seems like a good entry.
To be objective, my only concern about this entry is that I don't generally like to open positions during lunch time hours, but this does seem like a trade I would take. Look for support around 94.50'ish.
Remember this is strictly an opinion. There is no such thing as a 100% for sure guarantee thing in the market. Always do your own evaluation. This is not financial advice.

AMZN, quarterlyAmazon issued a weaker-than-expected forecast for 2023Q1. In January, Amazon began layoffs to the tune of 18,000 jobs—a sizable cost cut that will likely pump up net revenue for the next few reports and give shareholders a warm feeling.
After Prime Video’s disastrous performance and insane production costs, the salary reduction is much needed to keep Amazon agile. Expenses have become a primary target for Amazon’s “lean clean” phase, which will balance out the pandemic period’s excessive hiring.
Product sales are lower than expected in 2023, and the stock charts don’t show it yet. Whatever or whoever is fueling the AMZN rise won’t last long without support, but Amazon isn’t cooking anything that will give investors high hopes in the coming months, so don’t be surprised if AMZN has a reversal right after media channels are waving bullish flags.

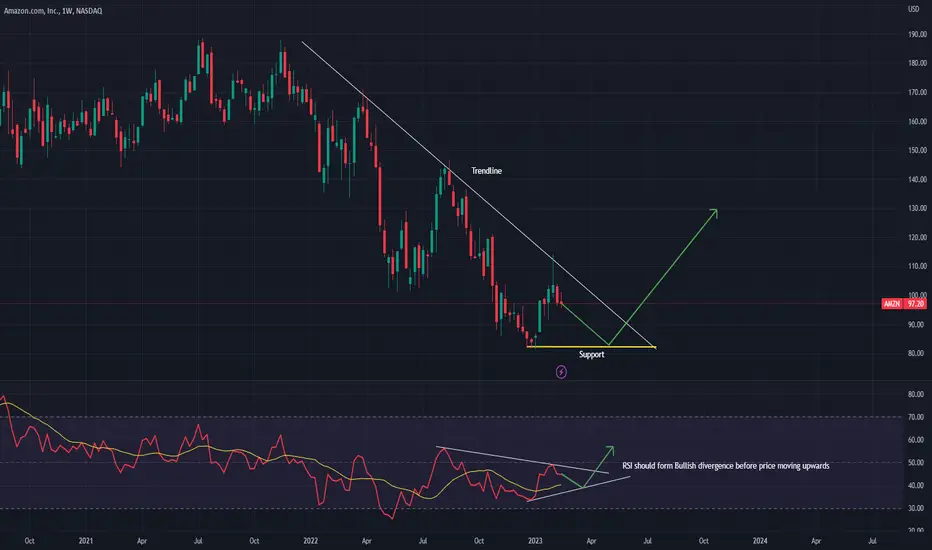
Amazon Weekly AnalysisAmazon rejected Key trendline multiple times.
For price to move upside and break key trendline price should retest at $90-82 zone to make double bottom with Bullish divergence (RSI forming HL).
AMAZON- WEEKLY ANALYSIS Amazon will require all office staff to work in-person at least three days a week, ending a policy that left remote work decisions up to team directors.

AMZN (Amazon)- looks bad in a short time, unknown for the restIf in the next three trading dates (21 -23 Feb) does not close above the neck line, I predict AMZN will continue to correct and build up its momentum.

AMAZON Stock Chart Fibonacci Analysis 021823Trading Idea
1) Find a FIBO slingshot
2) Check FIBO 61.80% level
3) Entry Point > 99/61.80%

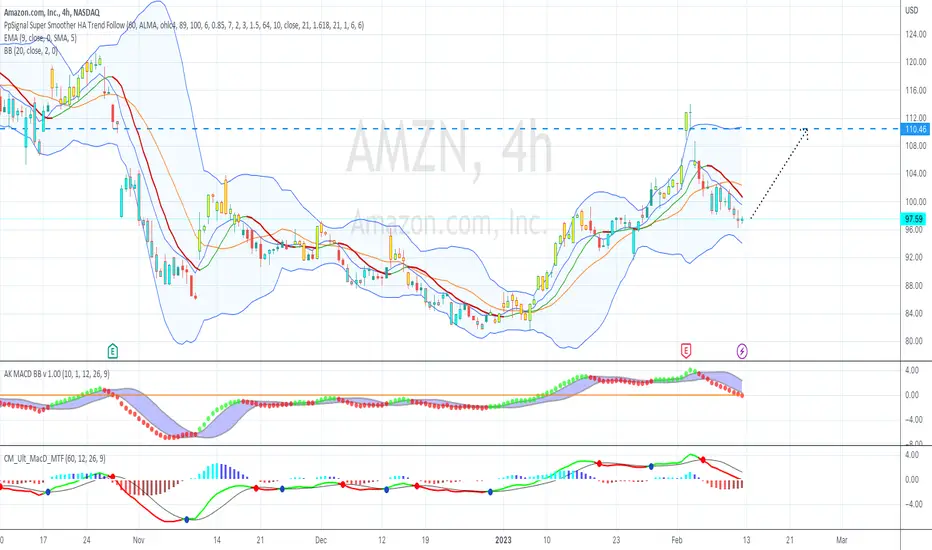
AMZN Still DumpingAfter this huge TrendLine rejection on the 4H chart, I am only looking for short.
We then have a good break of trendline with retest and forming a reversal cup pattern for more unwind.
On a fail of $95.0 level, we should see the price going lower to around $87.0 level.
This $87.0 level can be for me the level used for a trend shift for long, with as confirmation a daily trendline break.
Great Trade !

AMZN keeping the downtrendThis is the third time price breaks Ichimoku clod, touch the downtrend line with the WTO at the high that follows a fall until the WTO is at the bottom. Part of the movement is gone but I think there is more path to follow. Stop at the trendline, target at 80.22
Double Top Pattern in AMZN Price reaches all time high (ATH) at the moment with some volume, breaking MA50 and MA200 afterwards

head and shoulder forming on $amznWe've been forming a head and shoulders pattern on Amazon since early January. Weakness below $95 suggests a downward trend to $85.

Amazon Priced In SilverCan Amazon (priced in silver) fall over 94%, AGAIN?
#fintwit #recession #inflation #amzn #silver #nasdaq

Amazon Daily "Heat Map" ChartAmazon just looks TERRIBLE...
Lost for words.
#amzn #amazon $arkk #nasdaq

Testing Rejected Price has been rejected of the broken support strong now resistance. Too much resistance above, I don't think this one is coming back.

AMZN AnalysisPrice played out nicely according to my analysis last week. Price dropped and mitigated the bullish POI at 98.09, and is currently reacting to it. The target for this bullish retracement is potentially the fair value gap at 114.00 where price will fill and drop from.

Amazon -> Bullish Scenario Playing OutHello Traders,
welcome to this free and educational multi-timeframe technical analysis .
From a weekly perspective Amazon recently tested a quite obvious previous weekly support area from which we started a quite nice rally towards the upside.
Considering the fact that Amazon also broke above a key weekly downtrend-line, I think that we have some more overall upside potential.
From a daily timeframe we are currently retesting previous resistance which is now turned strong support, so if we see some more bullish confirmation inside of this zone, there is a high chance that we will actually see the continuation towards the upside.
Thank you for watching and I will see you tomorrow!
You can also check out my previous analysis of this asset:

Amazon - Feb - Daily AnalysisBasing Candle with closing below the previous trend line which indicates - Short position.
However we need to wait & watch for the next candle for DBR or DBD.
Reasons to Go Short:
1. MACD cross over is awaiting.
2. Super trend indicates short
3. Candle closing below the previous break out line
4. Weak Demand zones
5. If 13-Feb closes below 97, then Drop based Drop is confirmed else next candle should be strong green to consider it as a drop based Rally.
Strong supply Area
Its tested once with 1:4 risk reward ratio from 114 to 97
Weak Demand Area
Might give 1:1, if this level breaks our then the target is 83.

AMZN TRADE IDEAS 2/13-2/17AMZN consolidating on the primary trend line and the wedge of the secondary trend line.
A break above the daily 100ma, at 99.75, I'll look to take it to 101.18, 103.63.
Between the 200ma, 100ma, and 50ma, AMZN has rejected the primary trend line and broke below a key level at 103.63 and closed below both the 200 and 100ma. The next Moving Average support level down is the 50ma, sitting at 93.
A break below 95.75 and I profit target 94, 92.75. A break below the daily 50ma and I will have the demand zone of 85 in sights!

Amazon: 25 years; $1tn valuation from $2tnGreat Run for the retailer of the world.
The trensdline support at $85 is crucial.
most likley it will stay within the guard rails of the 25 years. Though the momentum indicators are very weak. Might be it will just laze around the current levels.

Amzn H&SGap dow today and rallied up to test 21ema where it was rejected .
XLY (Amzn sector) is very bearish below 148
Entry below 96$
Target gap close 90$

Amazon: Slowly getting there 🐌Amazon is still working on its correction - well, we might have to drag the stock to the green target zone between $95.21 and $85.51 since it is currently moving sideways. Once the green wave is fulfilled within the target zone, the trend can turn back North and rise above the resistance line at $117.50. Our alternative scenario with a probability of 40% implies, that the Amazon stock could ignore the green target zone and exceed the $117.50-mark right away.

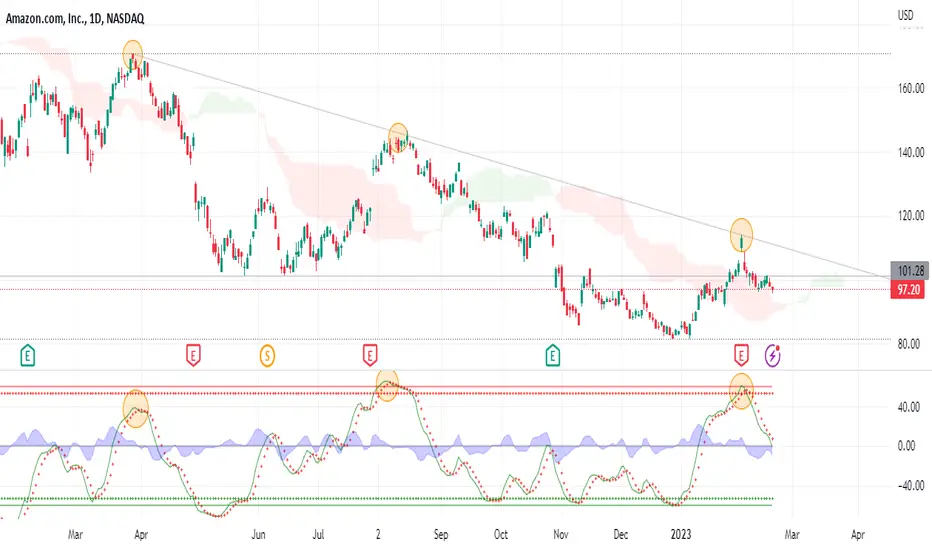
‘Abandoned Baby’ in Amazon.com?Amazon.com tried to rally a week ago. It proceeded to fall on weak quarterly results, leaving some potentially difficult patterns on the daily chart.
First, the single candlestick on February 2 was isolated above the other recent prices. That is sometimes known as a bearish “abandoned baby” -- essentially a failed breakout.
The location of the candlestick is potentially important. By occurring at the falling 200-day simple moving average (SMA), it suggests the longer-term downtrend remains in effect. (It was AMZN’s first test of the 200-day SMA since August.)
It was also near a bearish gap on October 28, which was triggered by weak guidance.
Next, the Relative Strength Index (RSI) is retreating from an overbought condition.
Traders looking for continuation lower may now watch for a potential break of the trendline along the lows of 2023.
TradeStation has, for decades, advanced the trading industry, providing access to stocks, options, futures and cryptocurrencies. See our Overview for more.
Important Information
TradeStation Securities, Inc., TradeStation Crypto, Inc., and TradeStation Technologies, Inc. are each wholly owned subsidiaries of TradeStation Group, Inc., all operating, and providing products and services, under the TradeStation brand and trademark. TradeStation Crypto, Inc. offers to self-directed investors and traders cryptocurrency brokerage services. It is neither licensed with the SEC or the CFTC nor is it a Member of NFA. When applying for, or purchasing, accounts, subscriptions, products, and services, it is important that you know which company you will be dealing with. Please click here for further important information explaining what this means.
This content is for informational and educational purposes only. This is not a recommendation regarding any investment or investment strategy. Any opinions expressed herein are those of the author and do not represent the views or opinions of TradeStation or any of its affiliates.
Investing involves risks. Past performance, whether actual or indicated by historical tests of strategies, is no guarantee of future performance or success. There is a possibility that you may sustain a loss equal to or greater than your entire investment regardless of which asset class you trade (equities, options, futures, or digital assets); therefore, you should not invest or risk money that you cannot afford to lose. Before trading any asset class, first read the relevant risk disclosure statements on the Important Documents page, found here: www.tradestation.com .
