AMZN breaks trend line of over 20 years Chart speaks for itself, trend line broke and will get ugly for the bulls. no dividends or rewards for holding all these years . just pain
AMZ trade ideas

Amazon earnings todayAmazon Q3 September 2022 earnings are today 10/27 at 4pm. Amazon (AMZN) reported Q2 June 2022 earnings of $0.10 per share on revenue of $121.2 billion. The consensus earnings estimate was $0.15 per share on revenue of $119.5 billion. Revenue grew 7.2% on a year-over-year basis. The company said it expects third quarter revenue of $125 billion to $130 billion. Here's levels on the 1-day chart:
Q3 September 2022 Consensus:
P/E = $0.22
Revenue = $126.42 B
SMA50 = 123.10
SMA100 = 121.74
SMA150 = 126.23
SMA200 = 132.67
SMA20 trend channel
top = 138.82
R3 = 133.04
R2 = 127.25
R1 = 121.47
pivot = 115.69
S1 = 109.90
S2 = 104.12
S3 = 98.33
bottom = 92.55
Do your own due diligence, your risk is 100% your responsibility. This is for educational and entertainment purposes only. You win some or you learn some. Consider being charitable with some of your profit to help humankind. Good luck and happy trading friends...
*3x lucky 7s of trading*
7pt Trading compass:
Price action, entry/exit
Volume average/direction
Trend, patterns, momentum
Newsworthy current events
Revenue
Earnings
Balance sheet
7 Common mistakes:
+5% portfolio trades, capital risk management
Beware of analyst's motives
Emotions & Opinions
FOMO : bad timing, the market is ruthless, be shrewd
Lack of planning & discipline
Forgetting restraint
Obdurate repetitive errors, no adaptation
7 Important tools:
Trading View app!, Brokerage UI
Accurate indicators & settings
Wide screen monitor/s
Trading log (pencil & graph paper)
Big, organized desk
Reading books, playing chess
Sorted watch-list
Checkout my indicators:
Fibonacci VIP - volume
Fibonacci MA7 - price
pi RSI - trend momentum
TTC - trend channel
AlertiT - notification
tickerTracker - MFI Oscillator
www.tradingview.com

AMZN Buying oppurtunity NASDAQ:AMZN
AMZN returning to some levels we have not seen in a very long time.
good chance to pick up some shares at a decent area where you can manage your position if things go absolutely sideways
just sharing the chart on this one because for this, its all about the levels.
Happy trading
mindset matters

weekly-pivot 2022.12.19just to identify the nature of the price lines drawn
Support & Resistance
bullish & bearish area (trend change)
Neutral area
trend reversal
return_compression or trend_stabilization
order fill rate

AMZN to $49 Gap Fill?AMZN is looking pretty nasty as of late. Official recession is on the horizon, could we finally see that gap fill at $49. Will also be watching the MACD for some divergence to signal the bottom.

Amazon Targeting A pivotal $60.00 TestIn this update we review the recent price action in Amazon and identify the next high probability trading opportunities and price objectives to target

AMZN Potential for Bearish Continuation | 20th December 2022Looking at the H4 chart, my overall bias for AMZN is bearish due to the current price being below the Ichimoku cloud , indicating a bearish market. Looking for a sell entry at 85.88, where the previous low is. Stop loss will be at 103.78, where the recent high is. Take profit will be at 69.43, where the -27.2% Fibonacci expansion line is.
Any opinions, news, research, analyses, prices, other information, or links to third-party sites contained on this website are provided on an "as-is" basis, as general market commentary, and do not constitute investment advice. The market commentary has not been prepared in accordance with legal requirements designed to promote the independence of investment research, and it is therefore not subject to any prohibition on dealing ahead of dissemination. Although this commentary is not produced by an independent source, FXCM takes all sufficient steps to eliminate or prevent any conflicts of interest arising out of the production and dissemination of this communication. The employees of FXCM commit to acting in the clients' best interests and represent their views without misleading, deceiving, or otherwise impairing the clients' ability to make informed investment decisions. For more information about the FXCM's internal organizational and administrative arrangements for the prevention of conflicts, please refer to the Firms' Managing Conflicts Policy. Please ensure that you read and understand our Full Disclaimer and Liability provision concerning the foregoing Information, which can be accessed on the website.

Amazon.com Inc. (AMZN) - 12/20/2022Business Side
Amazon.com secured a 5-year contract worth 700 million USD to provide cloud services to the United States Department of Navy.
Support Price Currently Being Tested
In my view, this is positive news for the traders of this stock as it tries to re-test its one-month support level of $86/share. A confirmation of this support line may fuel another upside of this stock to 121.35

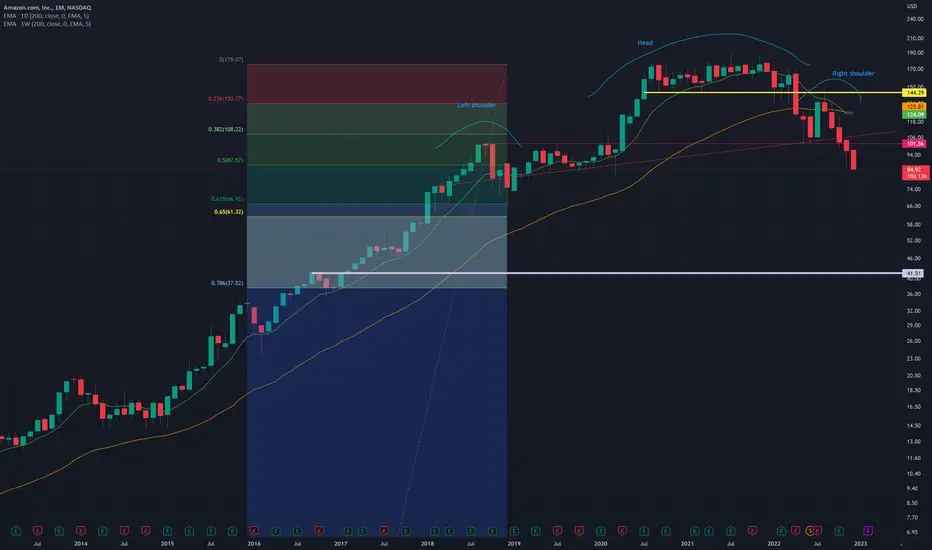
Amazon head and shouldersLooks like this could be a somewhat elongated head and shoulders pattern atop the chart for Amazon. Recently price has dropped below the next line quite significantly. Target price would be about 62.
Short setup in Amazon. Target - 1600+ zoneEWT wise Amazon is building a tradeable short setup in 1-2 / 1-2 fashion. I expect a retracement to 3200 area to complete wave 2 of circle 3 of wave A. It may take up to 2 weeks to complete wave 2. Demand zone for the whole wave A resides in the area of wave 4 of the larger degree (blue area on the left side).

AMZN Potential for Bearish Continuation | 20th December 2022Looking at the H4 chart, my overall bias for AMZN is bearish due to the current price being below the Ichimoku cloud, indicating a bearish market. Looking for a sell entry at 85.88, where the previous low is. Stop loss will be at 103.78, where the recent high is. Take profit will be at 69.43, where the -27.2% Fibonacci expansion line is.
Any opinions, news, research, analyses, prices, other information, or links to third-party sites contained on this website are provided on an "as-is" basis, as general market commentary, and do not constitute investment advice. The market commentary has not been prepared in accordance with legal requirements designed to promote the independence of investment research, and it is therefore not subject to any prohibition on dealing ahead of dissemination. Although this commentary is not produced by an independent source, FXCM takes all sufficient steps to eliminate or prevent any conflicts of interest arising out of the production and dissemination of this communication. The employees of FXCM commit to acting in the clients' best interests and represent their views without misleading, deceiving, or otherwise impairing the clients' ability to make informed investment decisions. For more information about the FXCM's internal organizational and administrative arrangements for the prevention of conflicts, please refer to the Firms' Managing Conflicts Policy. Please ensure that you read and understand our Full Disclaimer and Liability provision concerning the foregoing Information, which can be accessed on the website.

buy Amazon during the RecessionI kept knowing people are needing to know where to buy in 2023 during a recession. 85$ support are really strong I expect to start the bull run here.
Love to start buy Amazon for 1000$ fully guaranteed you will profit big in 6 figures.
Buy their and you’ll be fine because now everything will be pretty tough to keep things stable.
Because during a recession Amazon wanted to keep much employees as possible to keep amazon service alive and challenging the recession in 2023.. to help the customers orders and needs.. as Jeff bezos amid layoffs are going around but want to keep much employees as possible meanwhile for the very first time amazon at UK going on Strike because of less pay of 15 euros..
if the bulls can’t take it from here then we will accept to see further downside.
Buy carefully if bottomed strong in then 1000$ .. if not then just go with just 100$
Buy safe and good luck.

AMZN looking like a SNACKBuying the DIP as I know that AWS is killing it, with the beginning of it's growth just revving up. Plenty gains to be made in the long term, I'm not sure WTF analysts/ppl are seeing here that it's gone this low but i kinda like it makes buying it a lot cheaper. 70 time to take another medium bite, then at 60ish I'm going to fill up like a Professional Hot Dog Eating Champion.

AMAZON heading higher $AMZN heading higher before a short term regression. Using Fibonacci extensions and retractions.

AMZN Amazon Technical ReboundIf you haven`t sold Amazon`s slowest growth since 2001, with EPS far below analyst predictions:
Then you should know that a technical rebound refers to a recovery from a prior period of losses when technical signals indicate that the move was oversold.
In this case, the Relative Strength Index momentum indicator of AMZN is close to oversold level.
Even though i am overall bearish on the economy, buying a strong financial instrument when the RSI is below 30, would make a case for a potential short term reversal.
The chart is self-explanatory.
Looking forward to read your opinion about it.

Amazon (AMZN) Continues the Bearish Elliott Wave Sequence LowerShort term Elliott wave View in Amazon (ticker; AMZN) suggests the decline from 12.1.2022 peak is in progress as a 5 waves impulse. Down from 12.1.2022 peak, wave ((i)) ended at 94.92 and wave ((ii)) rally ended at 96.45. Stock resumed lower in wave ((iii)) towards 87.90 and wave ((iv)) correction ended at 88.88. Final leg wave ((v)) ended at 87.45 which completed wave 1 as the 45 minutes chart below shows. From there, wave 2 corrective rally ended at 96.26. Internal subdivision of wave 2 took the form of a zigzag Elliott Wave structure. Up from wave 1, wave ((a)) ended at 91.39, wave ((b)) ended at 87.87, and wave ((c)) ended at 96.26.
Stock resumed lower in wave 3 with internal subdivision as an impulse. Down from wave 2, wave (i) ended at 90.52, and rally in wave (ii) ended at 93.46. Stock then extended lower in wave (iii) and should complete with a few more lows. The stock should then bounce in wave (iv) before another leg lower in wave (v) to complete wave ((i)) of 3. Near term, as far as pivot at 96.26 high stays intact, expect rally to find sellers in 3, 7, or 11 swing for further downside.
