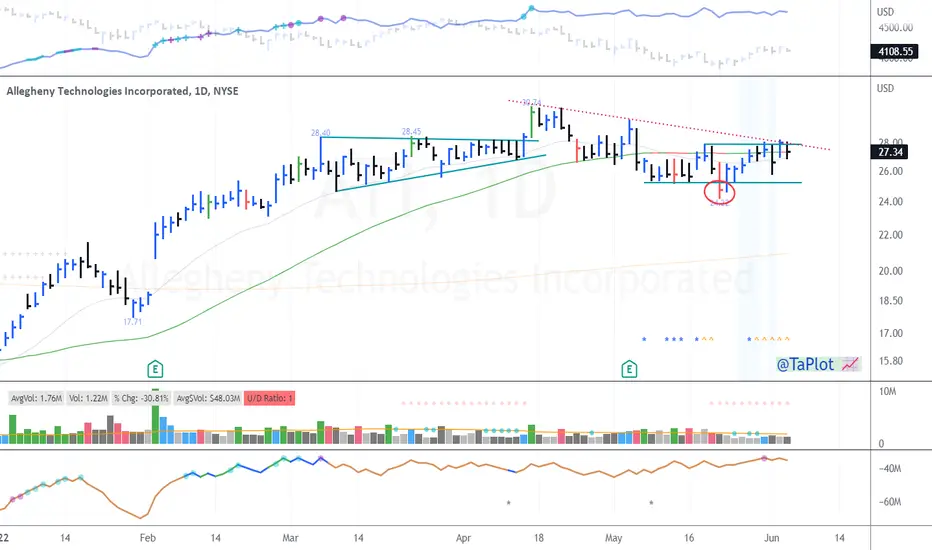
ATI Still Has More Upside PotentialATI broke out above the key $67.35 resistance level in early May and is now attempting to consolidate its recent surge. While the stock has nearly reached the consensus analyst price target—suggesting limited near-term upside—the recent Middle East visit by Trump may have changed the outlook.
ATI i
Next report date
—
Report period
—
EPS estimate
—
Revenue estimate
—
2.56 EUR
355.29 M EUR
4.21 B EUR
136.48 M
About ATI Inc.
Sector
Industry
CEO
Kimberly Ann Fields
Website
Headquarters
Dallas
Founded
1996
ISIN
US01741R1023
FIGI
BBG000GLVGM1
ATI, Inc. engages in the manufacture of specialty materials and components. It operates through the High Performance Materials and Components and Advanced Alloys and Solutions segments. The High Performance Materials and Components segment consists of the production of materials, parts, and components for aerospace and defense, medical, and energy markets. The Advanced Alloys and Solutions segment includes the production of nickel-based alloys, titanium and titanium-based alloys, and alloys in a variety of forms including plate, sheet, and PRS products. The company was founded on August 15, 1996 and is headquartered in Dallas, TX.
Related stocks

ATI – Long Trade Setup!📈
🔍 Pattern: Bull flag breakout attempt
📍 Entry: $85.19 (above triangle breakout)
🎯 Target: $88.16 (prior high / resistance zone)
🛑 Stop-loss: $84.00 (below ascending trendline)
✅ Why this setup?
Clear breakout of falling wedge/bull flag
Strong base near $84 with higher lows
Momentum continuati

Good scoop upReasoning
- Consolidation seems done
- Correction is not overextended
- Good Relative Strength
- Great earnings
- RSI tested bullish range multiple times
- Multiple Bullish Days
- Always try to use 2 timeframes
My Would Be Trade Plan
- Risk about 1.5ATR and aim to ride up to 4.5ATR

ATI Entry, Volume, Target, StopEnter when price clears 43.32
With daily volume greater than 1.4M
Target: 49.50 area
Depending on your risk tolerance: 41.24 gets you 3/1 Risk/Reward

ATI Stock Chart Fibonacci Analysis 041323Trading Idea
1) Find a FIBO slingshot
2) Check FIBO 61.80% level
3) Entry Point > 38.6/61.80%

ATI - Trend pullback ATI is part of the XME sector and has stronger price action than the sector.
Perhaps some doubletop price action here after testing the earnings spike. However, with XME setting up to break higher, ATI looks to benefit with already strong price action.
G/G trend with RAF at extremes. 13/21 propu

ATI - Down Channel BreakoutPrice has left the down channel which has been contained for quite some time on this Weekly chart
This could be the beginning of a new bull move
Its best to look at this on a Monthly chart to assess whether this bull move will continue


$ATI Breaking Down TrendWatched $ATI punch through that down trending line Friday.
50 MA right above. Couple sessions of sideways here will confirm supply drying up and potentially sets the stage for the resumption of the uptrend (orange bars what i would like to see).

$ATI Setting Up $ATI has many of the elements to send it higher:
RS, Shakeout, tightening, Pivot + downtrend confluence, volume dry-up, OBV NHBP
Focus next week.
See all ideas
An aggregate view of professional's ratings.
Neutral
SellBuy
Strong sellStrong buy
Strong sellSellNeutralBuyStrong buy
Neutral
SellBuy
Strong sellStrong buy
Strong sellSellNeutralBuyStrong buy
Neutral
SellBuy
Strong sellStrong buy
Strong sellSellNeutralBuyStrong buy
Displays a symbol's price movements over previous years to identify recurring trends.
ATI5630955
ATI, Inc. 7.25% 15-AUG-2030Yield to maturity
6.01%
Maturity date
Aug 15, 2030
ATI4914738
ATI, Inc. 5.875% 01-DEC-2027Yield to maturity
5.70%
Maturity date
Dec 1, 2027
ATI5256563
ATI, Inc. 5.125% 01-OCT-2031Yield to maturity
5.28%
Maturity date
Oct 1, 2031
ATI5256562
ATI, Inc. 4.875% 01-OCT-2029Yield to maturity
5.15%
Maturity date
Oct 1, 2029
See all ATD bonds
Frequently Asked Questions
Depending on the exchange, the stock ticker may vary. For instance, on FWB exchange ATI Inc. stocks are traded under the ticker ATD.
We've gathered analysts' opinions on ATI Inc. future price: according to them, ATD price has a max estimate of 103.07 EUR and a min estimate of 79.02 EUR. Watch ATD chart and read a more detailed ATI Inc. stock forecast: see what analysts think of ATI Inc. and suggest that you do with its stocks.
Yes, you can track ATI Inc. financials in yearly and quarterly reports right on TradingView.
ATI Inc. is going to release the next earnings report on Oct 28, 2025. Keep track of upcoming events with our Earnings Calendar.
ATD earnings for the last quarter are 0.63 EUR per share, whereas the estimation was 0.61 EUR resulting in a 3.81% surprise. The estimated earnings for the next quarter are 0.62 EUR per share. See more details about ATI Inc. earnings.
ATI Inc. revenue for the last quarter amounts to 968.09 M EUR, despite the estimated figure of 982.44 M EUR. In the next quarter, revenue is expected to reach 957.53 M EUR.
ATD net income for the last quarter is 85.48 M EUR, while the quarter before that showed 89.66 M EUR of net income which accounts for −4.66% change. Track more ATI Inc. financial stats to get the full picture.
No, ATD doesn't pay any dividends to its shareholders. But don't worry, we've prepared a list of high-dividend stocks for you.
As of Oct 22, 2025, the company has 7.7 K employees. See our rating of the largest employees — is ATI Inc. on this list?
EBITDA measures a company's operating performance, its growth signifies an improvement in the efficiency of a company. ATI Inc. EBITDA is 650.60 M EUR, and current EBITDA margin is 16.03%. See more stats in ATI Inc. financial statements.
Like other stocks, ATD shares are traded on stock exchanges, e.g. Nasdaq, Nyse, Euronext, and the easiest way to buy them is through an online stock broker. To do this, you need to open an account and follow a broker's procedures, then start trading. You can trade ATI Inc. stock right from TradingView charts — choose your broker and connect to your account.