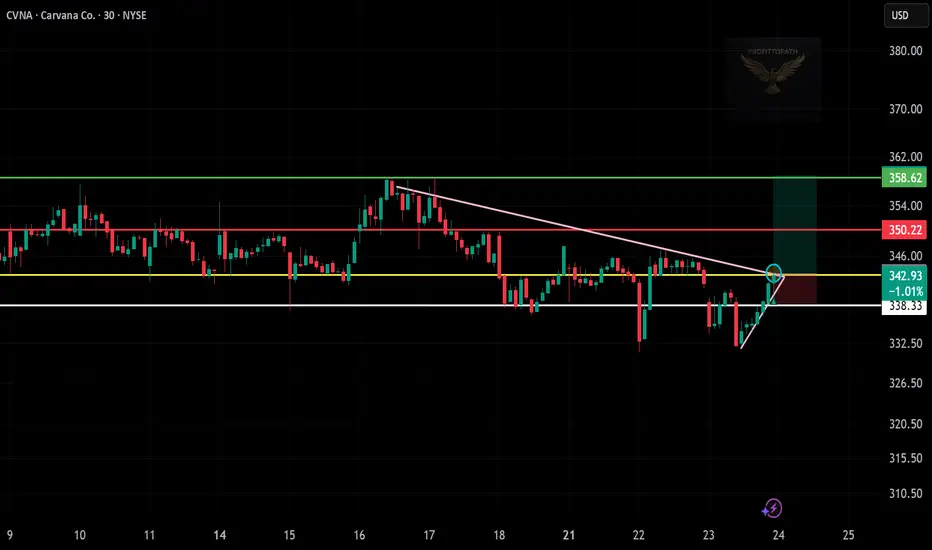
CVNA Technical Outlook – Trading in a Defined Range🚗 CVNA Technical Outlook – Trading in a Defined Range
Ticker: CVNA (Carvana Co.)
Timeframe: 30-minute candles
🔍 Current Setup
CVNA has been trading in a clear horizontal range for several weeks.
Range Support: ~340
Range Resistance: ~370
Current price: ~365, approaching the top of the range.
This
Next report date
—
Report period
—
EPS estimate
—
Revenue estimate
—
3.60 EUR
202.86 M EUR
13.21 B EUR
128.61 M
About Carvana Co.
Sector
Industry
CEO
Ernie C. Garcia
Website
Headquarters
Tempe
Founded
2012
ISIN
US1468691027
FIGI
BBG00GNRK1F8
Carvana Co. is a holding company and an eCommerce platform, which engages in the buying and selling of used cars. The company was founded by Ernest Garcia, III, Benjamin Huston and Ryan Keeton in 2012 and is headquartered in Tempe, AZ.
Related stocks
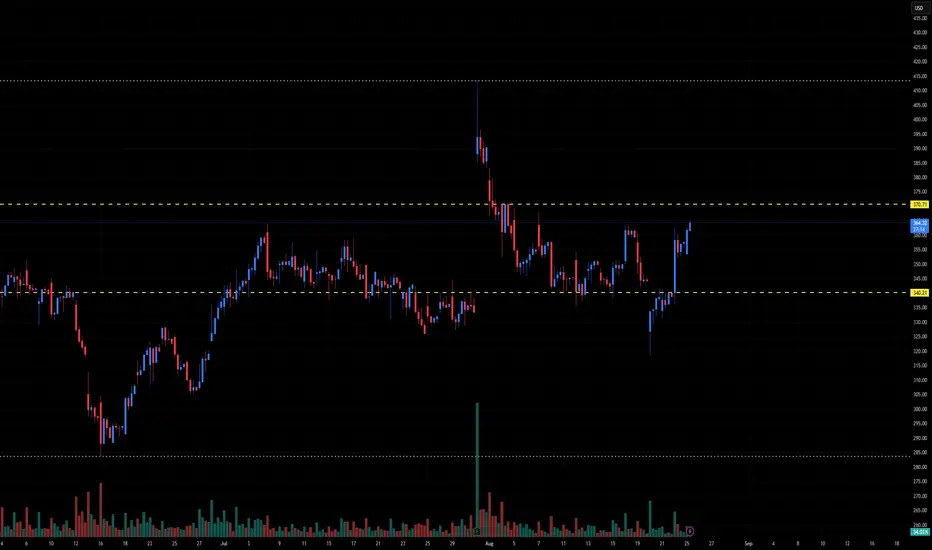
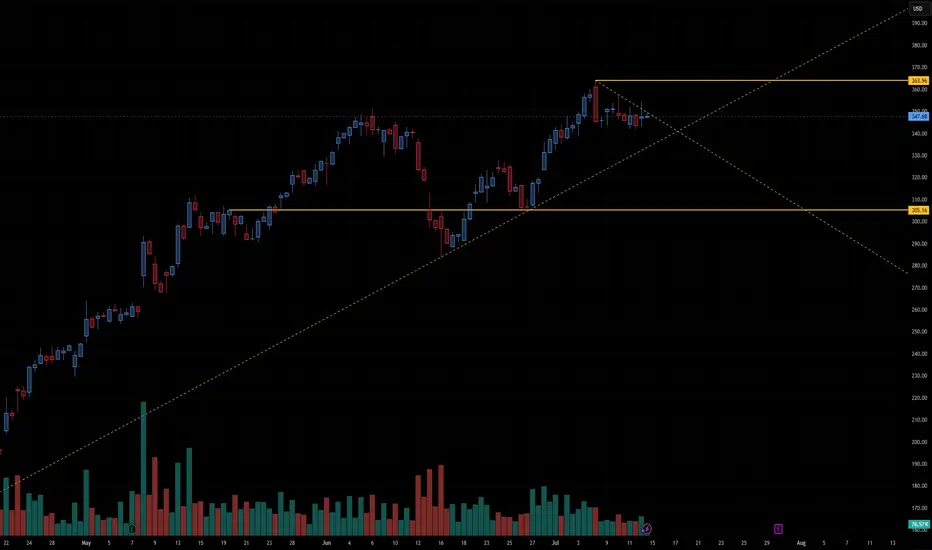
CVNA – Coiling for the Next Launch?After a monster run from ~$148 to ~$413, CVNA is cooling off inside a tight range ($323–$376). This looks like a classic bull flag — a pause before the next leg higher. A breakout above $376 could send price first to $413 and then toward $450 (+37%). A drop below $323, however, may open the door for

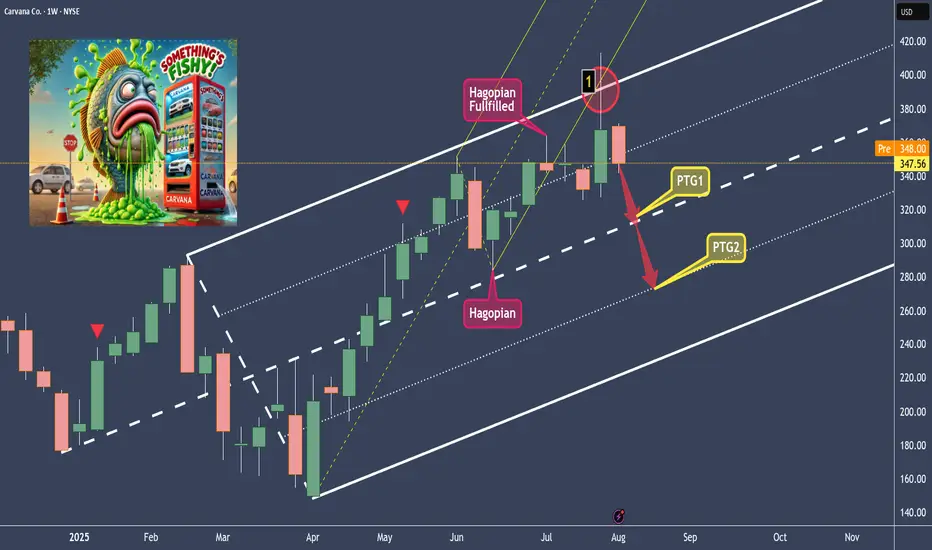
CVNA - Stinky Fish Short SetupAs can be seen from past analyses of CVNA, they have rarely played out as expected. And yet – this time too, I will be trading CVNA short.
Why again?
Because it’s a setup that follows the rules of the Forks.
Setups are one part of a system.
Just one part – nothing more.
A setup has a statistic
Very DangerousCarvana back near all time highs while in an expanding triangle formation. These happen at times where volatility is increasing and swings have become more wild. It can be a sign a lower liquidity causing small dollar amounts to change the stock's price more drastically.
A daily close under $330 is

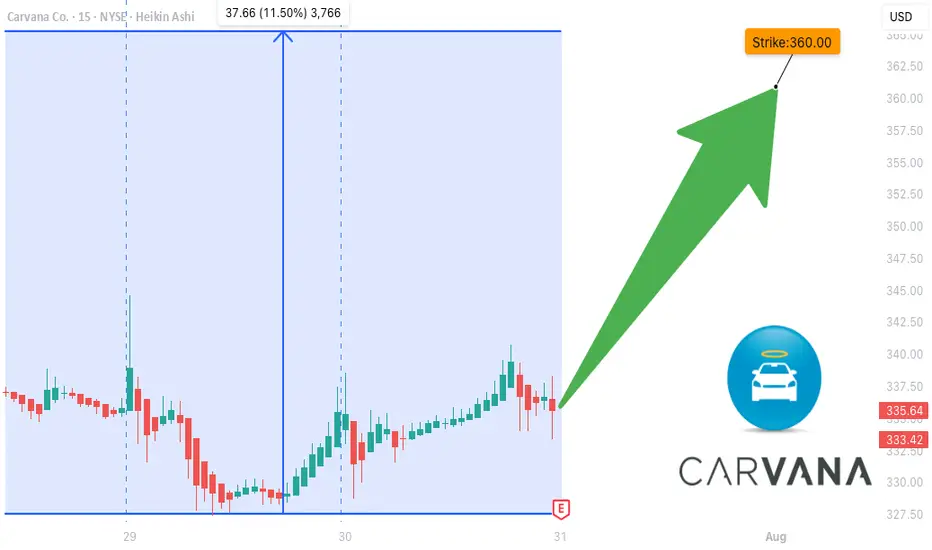
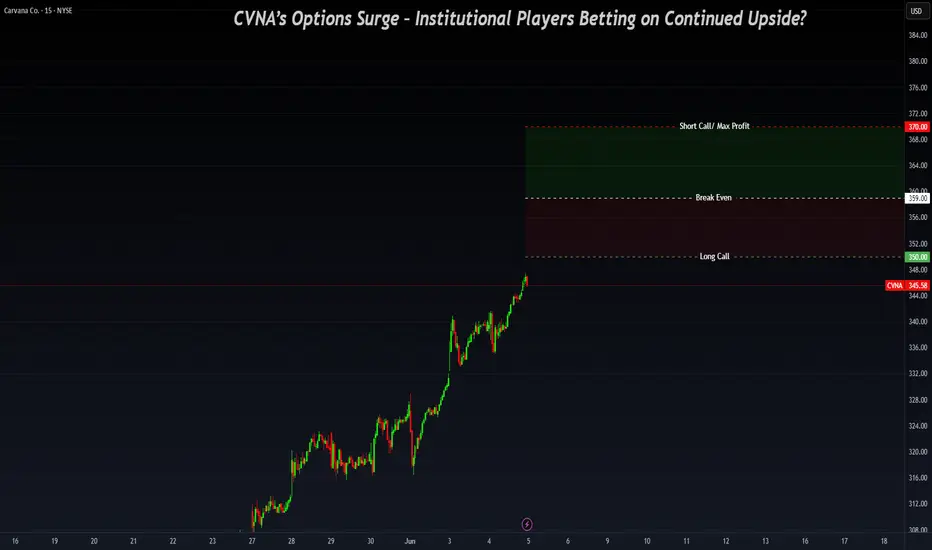
CVNA EARNINGS TRADE IDEA — July 30 (AMC)
## 🚗 CVNA EARNINGS TRADE IDEA — July 30 (AMC)
**Carvana (CVNA)**
📊 **Bullish Confidence**: 85%
📈 **Earnings Play Setup**
💣 Big Volatility + Strong History = Explosive Potential
---
### ⚙️ FUNDAMENTALS SNAPSHOT
✅ **Revenue Growth**: +38.3% YoY
🔁 **8/8 EPS Beats** (114.5% avg surprise)
🟡 **Profit
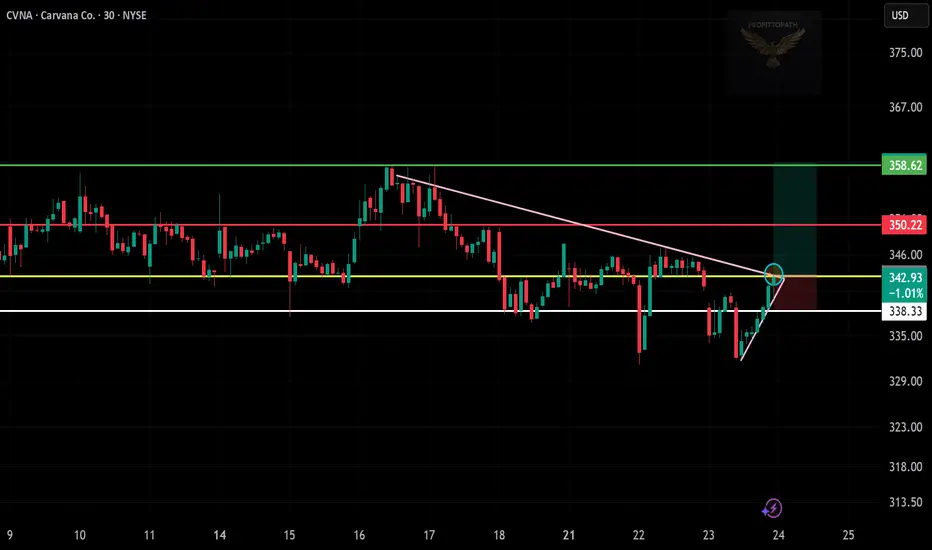
Pattern: Trendline breakout (pink line)
Entry Zone: Around 342.93
Stop Loss: Below 338.33 (support zone)
Targets:
Target 1: 350.22 (resistance)
Target 2: 358.62 (top green level)
IONQ breakout — targeting next resistance zones.
Pattern: Breakout from descending trendline (pink)
Entry Zone: Around 43.28 (breakout zone)
Stop Loss: Below 42.75 (recent support zone)
Targets:
Target 1: 44.21 (red resistance)
Target 2: 45.57 (top green line)
CVNA will falling rates save this darling?VNA (Carvana Co.) shows a strong bullish trend with a breakout setup forming. Here’s a detailed technical analysis:
📈 Trend Analysis: Strong Uptrend
CVNA has been in a clear uptrend, characterized by higher highs and higher lows since March.
The ascending yellow trendline confirms consistent buyin
Carvana Leading Auto Retail – Outpacing LAD & AN-Financial Performance & Momentum:
Carvana reported a record-breaking adjusted EBITDA of $488M in Q1 2025, up $253M YoY, with an EBITDA margin of 11.5% (+3.8pp YoY). The company's strong operational efficiency positions it as a leader in the auto retail industry, nearly doubling the margins of compe
CVNA Monthly resistance hit. CVNA has been a rocket ship. this would be the 3rd time it is hitting the level.

See all ideas
An aggregate view of professional's ratings.
Neutral
SellBuy
Strong sellStrong buy
Strong sellSellNeutralBuyStrong buy
Neutral
SellBuy
Strong sellStrong buy
Strong sellSellNeutralBuyStrong buy
Neutral
SellBuy
Strong sellStrong buy
Strong sellSellNeutralBuyStrong buy
Displays a symbol's price movements over previous years to identify recurring trends.
CVNA5656701
Carvana Co. 9.0% 01-DEC-2028Yield to maturity
—
Maturity date
Dec 1, 2028
CVNA5050779
Carvana Co. 5.875% 01-OCT-2028Yield to maturity
—
Maturity date
Oct 1, 2028
CVNA5156797
Carvana Co. 5.5% 15-APR-2027Yield to maturity
—
Maturity date
Apr 15, 2027
CVNA5050777
Carvana Co. 5.625% 01-OCT-2025Yield to maturity
—
Maturity date
Oct 1, 2025
CVNA5656702
Carvana Co. 9.0% 01-JUN-2030Yield to maturity
—
Maturity date
Jun 1, 2030
CVNA5240196
Carvana Co. 4.875% 01-SEP-2029Yield to maturity
—
Maturity date
Sep 1, 2029
CVNA5656725
Carvana Co. 9.0% 01-JUN-2031Yield to maturity
—
Maturity date
Jun 1, 2031
CVNA5406700
Carvana Co. 10.25% 01-MAY-2030Yield to maturity
—
Maturity date
May 1, 2030
See all CV0 bonds
Frequently Asked Questions
Depending on the exchange, the stock ticker may vary. For instance, on FWB exchange Carvana Co. Class A stocks are traded under the ticker CV0.
We've gathered analysts' opinions on Carvana Co. Class A future price: according to them, CV0 price has a max estimate of 427.24 EUR and a min estimate of 281.98 EUR. Watch CV0 chart and read a more detailed Carvana Co. Class A stock forecast: see what analysts think of Carvana Co. Class A and suggest that you do with its stocks.
Yes, you can track Carvana Co. Class A financials in yearly and quarterly reports right on TradingView.
Carvana Co. Class A is going to release the next earnings report on Oct 30, 2025. Keep track of upcoming events with our Earnings Calendar.
CV0 earnings for the last quarter are 1.17 EUR per share, whereas the estimation was 0.99 EUR resulting in a 17.78% surprise. The estimated earnings for the next quarter are 1.09 EUR per share. See more details about Carvana Co. Class A earnings.
Carvana Co. Class A revenue for the last quarter amounts to 4.11 B EUR, despite the estimated figure of 3.89 B EUR. In the next quarter, revenue is expected to reach 4.26 B EUR.
CV0 net income for the last quarter is 155.35 M EUR, while the quarter before that showed 199.66 M EUR of net income which accounts for −22.19% change. Track more Carvana Co. Class A financial stats to get the full picture.
No, CV0 doesn't pay any dividends to its shareholders. But don't worry, we've prepared a list of high-dividend stocks for you.
As of Sep 10, 2025, the company has 17.4 K employees. See our rating of the largest employees — is Carvana Co. Class A on this list?
EBITDA measures a company's operating performance, its growth signifies an improvement in the efficiency of a company. Carvana Co. Class A EBITDA is 1.53 B EUR, and current EBITDA margin is 9.56%. See more stats in Carvana Co. Class A financial statements.
Like other stocks, CV0 shares are traded on stock exchanges, e.g. Nasdaq, Nyse, Euronext, and the easiest way to buy them is through an online stock broker. To do this, you need to open an account and follow a broker's procedures, then start trading. You can trade Carvana Co. Class A stock right from TradingView charts — choose your broker and connect to your account.