GIS in BUY ZONEMy trading plan is very simple.
I buy or sell when either of these events happen:
* Price tags the top or bottom of parallel channel zones
* Money flow volume spikes beyond it's Bollinger Bands
So...
Here's why I'm picking this symbol to do the thing.
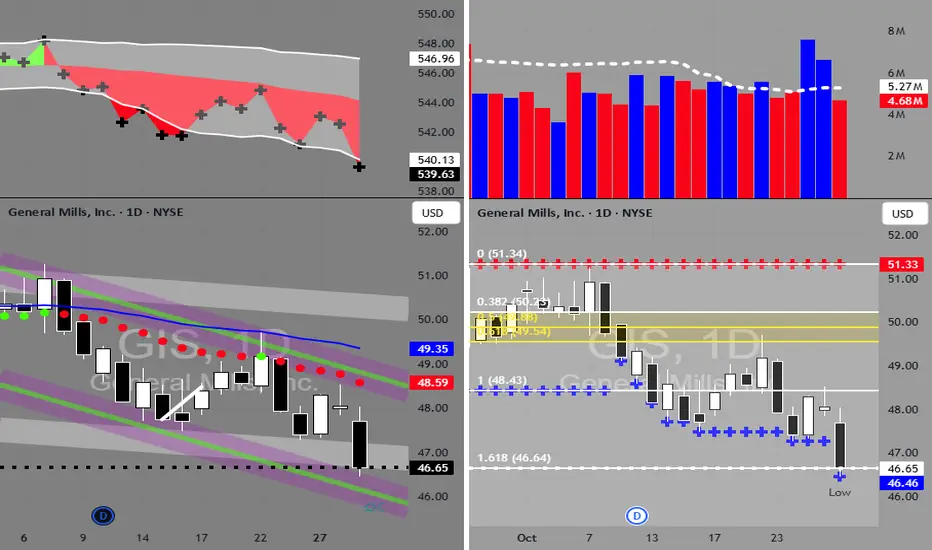
Price in buying zone at bottom of channels
Money flow momentum is spiked negative and under bottom of Bollinger Band
Entry at $46.65
Target is upper channel around $48.50
Trade ideas
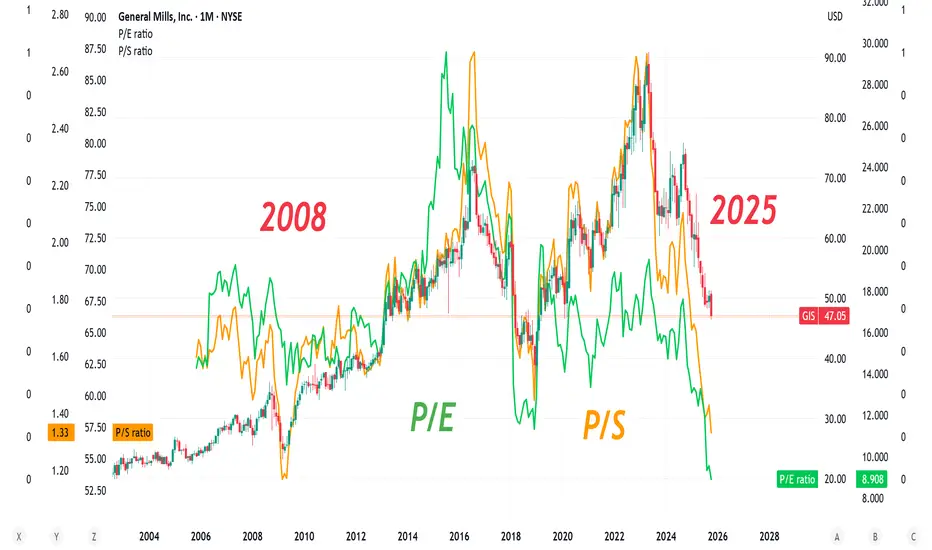
General Mills "GIS" Cool print on P/E & P/S (lowest since2008)" A P/E ratio, or price-to-earnings ratio, is a financial metric that shows a company's share price relative to its earnings per share (EPS). It indicates how much investors are willing to pay for each dollar of a company's earnings, helping to assess if a stock is overvalued, undervalued, or fairly priced. For example, a P/E ratio of 20 means investors are paying $20 for every $1 of the company's current earnings "
General Mills Holds Firm in a Challenging EnvironmentBy Ion Jauregui – Analyst at ActivTrades
General Mills (Ticker AT: GIS.US), one of the U.S. food industry giants, has reported results that show resilience despite difficulties in its main market. In North America, where much of its business is concentrated, volumes declined by 16 percentage points, reflecting weaker consumer demand and competitive pressure. Even so, the company has chosen to maintain its annual guidance, which has been interpreted as a sign of confidence in its ability to deliver.
In the quarter, net sales fell 6.8% to $4.52 billion, a negative figure but one that still came in better than analyst consensus expectations. This detail helped soften the market reaction, which could have been more severe.
On the positive side, the performance of the U.S. pet food division stood out, rising 6% and confirming this segment as a key growth driver for the company. The international business also showed strength, advancing 6%, which helps diversify risk against the slowdown in its domestic market.
From an investment perspective, General Mills remains a defensive stock within the consumer staples sector, supported by a solid brand portfolio and a geographic diversification strategy that provides stability. However, the decline in North American volumes remains a warning sign, as it sets the tone for what could be a year of margin pressure.
Technical Analysis of General Mills (Ticker AT: GIS.US)
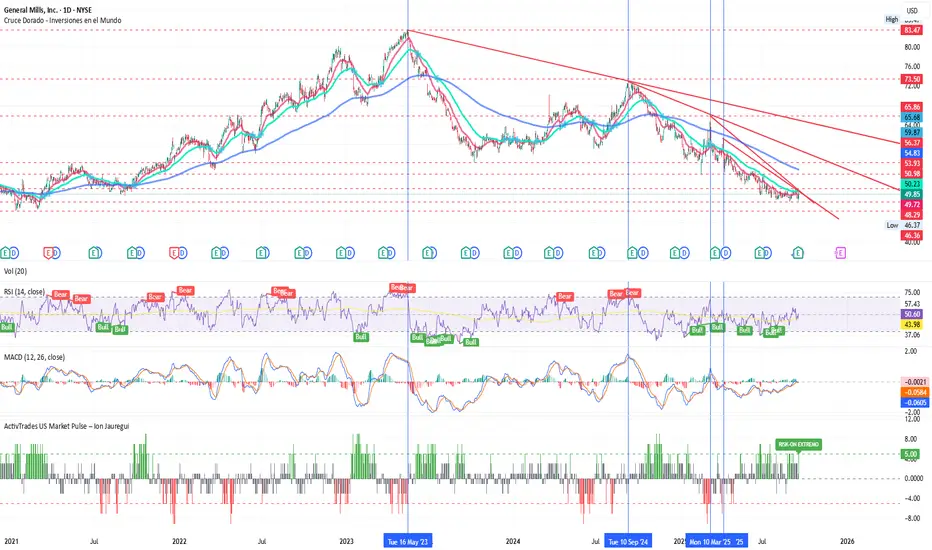
Since May 2023, General Mills has been in a clear downtrend, with a brief pause in September 2024 and subsequent failed recovery attempts in March and April 2025. Since July, the stock has been in a consolidation phase, trading in a narrow range with support at $49.72 and immediate resistance at $51.04, reflecting short-term indecision.
Key technical levels to watch are:
Critical supports: $48.29 (yearly low) and $46.36 (previous low), which represent key areas to hold in order to avoid further deterioration in price action.
Relevant resistances: a breakout above $56.38 could pave the way toward $65.94, marking a shift into a more constructive bullish scenario.
As for indicators, the RSI remains in neutral territory, reflecting the absence of overbought or oversold conditions, while the MACD is beginning to show signs of recovery from negative territory, suggesting a potential short-term turnaround.
Meanwhile, the ActivTrades US Market Pulse currently points to an extreme Risk-On environment in the U.S., characterized by strong appetite for risk assets, broad-based equity gains, and declines in safe-haven assets. However, this wave of optimism contrasts with the defensive nature of General Mills, which historically performs better in periods of greater uncertainty.
General Mills Holds Its Ground as a Defensive Play
General Mills maintains its profile as a defensive stock, backed by a diversified portfolio and growth drivers such as its pet food and international businesses. Nevertheless, the drag from North American volumes and margin pressure calls for caution.
Technically, the stock appears to have found a floor and is currently in neutral territory, awaiting a decisive breakout. As long as it holds above its critical supports, the likelihood of a rebound toward resistance levels remains plausible, though only a breakout above $56.38 would confirm a more solid trend reversal.
In a market environment dominated by extreme risk appetite, General Mills may take a backseat compared to more cyclical or growth-oriented assets. Even so, it remains an attractive option for investors seeking stability and exposure to the consumer staples sector.
*******************************************************************************************
The information provided does not constitute investment research. The material has not been prepared in accordance with the legal requirements designed to promote the independence of investment research and such should be considered a marketing communication.
All information has been prepared by ActivTrades ("AT"). The information does not contain a record of AT's prices, or an offer of or solicitation for a transaction in any financial instrument. No representation or warranty is given as to the accuracy or completeness of this information.
Any material provided does not have regard to the specific investment objective and financial situation of any person who may receive it. Past performance and forecasting are not a synonym of a reliable indicator of future performance. AT provides an execution-only service. Consequently, any person acting on the information provided does so at their own risk. Political risk is unpredictable. Central bank actions can vary. Platform tools do not guarantee success.
GIS Ascending Broadening Wedge SetupGIS has a strong wedge setup here. Looking at previous trends, price has bounced off the Lower Trendline twice in the past. GIS could be due for yet another bounce off the Lower Trendline. I will watch around that $48-$40 range for a possible breakout, especially with earnings coming up.
Based on the chart patterns, I would be bearish if price falls below that $37 range. Whereas, anything above that $56 we’re probably in for a decent price increase.
Please leave your comments/feedback below

GenneralMills Earnings play —$50C Don’t miss outGIS Earnings Analysis Summary (2025-09-16)
Summary (quick take)
Consensus from the model set: mixed. Two models (Gemini, Llama) favor buying the $50 call around $0.85 into earnings; two models (Grok, DeepSeek) either prefer puts or no-trade; Claude is neutral/no-trade. The single highest‑probability edge is management’s historical tendency to guide conservatively and beat (8/8 beats, ~6% avg surprise). That creates a contrarian asymmetric upside if GIS merely meets or slightly beats low expectations. Options flow, technicals and recent sell-side commentary (RBC warning) are the main contrarian imperfects.
My read: probability-weighted view favors a modest bullish earnings outcome. I will therefore recommend a single‑leg buy of the $50 call (expiry 2025-09-19) at the quoted ask $0.85 — using only strikes/premiums provided in the OPTIONS DATA. This is a tactical earnings play with tight risk controls.
1) Full earnings prediction analysis using your four-pillars framework
A. Fundamental earnings drivers
Revenue momentum: TTM revenue -3.3% — clear top-line weakness. Negative for directional upside.
Margins: Gross 34.6%, operat..

GENERAL MILLS - GIS - MY PROBLEM WITH FRACTALS - EDUCATIONAL... The Markets are definitly fractal.
But at the moment I can't decide...
Maybe someone can help me out?
All in all GIS dropped a huge lot and might present a good entry price for a medium to long term investor / trader...
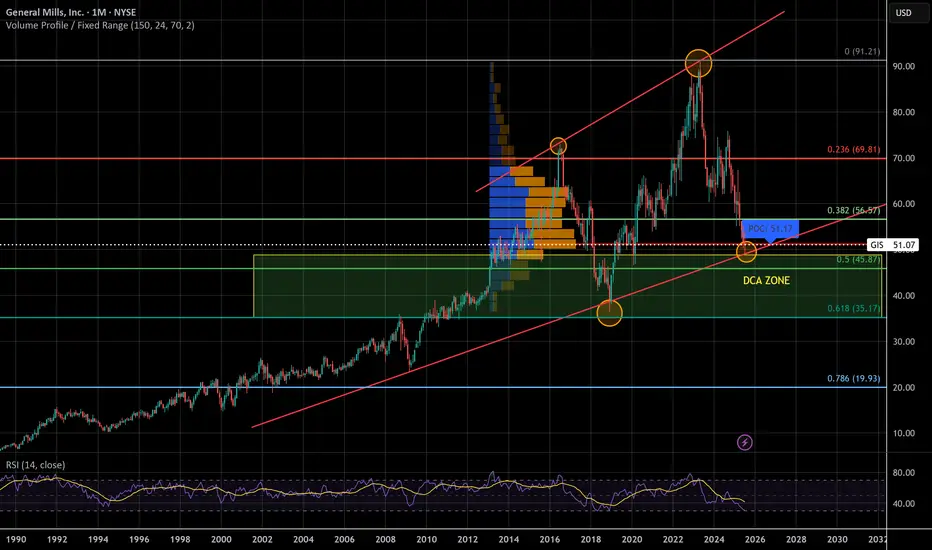
General Mills - Legendary Recession StockWe could be witnessing the biggest correction in General Mills history, again! For the 2nd time in 5 years! I trust in the golden fib, volume looks good, and RSI is low. If it makes it to the top of the channel it'll double in price in the coming years. This looks like a good candidate for Elliott Waves but I'm no good with them.
A lot of people think a recession is coming, if that is the case a lot of people will be buying general mills. More eating at home to save money = more groceries purchased. Looking at the previous financial recessions, General Mills lost 30-35% and recovered swiftly to even greater heights
Tariffs could also heavily affect general mills, which is why I DCA instead of 'aping fat bags'. Making money is hard, but holding onto it is even harder.
GIS to $100 by 2030?Looking at the previous chart patterns and RSI indicator, I am going to be looking for a reversal around the $55.00 level.
This could be a great opportunity to get into a long term position with huge upside potential.
The RSI looks very similar now, to how it did in December of 2018 when it went into an uptrend.
TP1 $60
TP2 $70
TP3 $90
I am mostly posting this so I can look back on my theories and see how I can improve on my trading strategies. Please leave your feedback below, thank you.

GIS Bullish Breakout – Eyes on $55.33! 📈
🧠 Trade Idea Summary:
Ticker: NYSE:GIS (General Mills Inc.)
Trade Type: Long
Chart: 15-minute
Setup: Bullish wedge breakout + volume support
Entry Zone: $54.00 (breakout level)
Stop Loss: $53.59 (below wedge support)
Target 1: $54.57 (resistance zone)
Target 2: $55.33 (gap fill / higher resistance)
🗣️ Caption for Social Media:
📊 GIS Breakout Alert!
Bullish momentum building after a clean wedge breakout.
Entry: $54.00 | SL: $53.59 | TP: $55.33
Risk-reward on point — watch for volume confirmation!
#GIS #StockTrading #BreakoutTrade #TradingView #OptionsFlow #ProfittoPath

#GIS - Time to make money - 51 is the key ?!waiting price around 51
way ?
activate 2 bullish patterns for targets on the chart
but don't forget (( stop loss )) will be 49.60
Its not an advice for investing only my vision according to the data on chart
Please consult your account manager before investing
Thanks and good luck

General Mills, Inc (NYSE: $GIS) Set to Report Q3 Earnings TodayGeneral Mills, Inc. (NYSE: NYSE:GIS ) manufactures and markets branded consumer foods worldwide is set to report Third Quarter Earnings results today before market opens. With shares moderately up 0.85% in Wednesday's premarket trading.
Founded in 1866 and headquartered in Minneapolis, Minnesota. The company operates through four segments: North America Retail; International; Pet; and North America Foodservice.
Financial Performance
In 2024, General Mills's revenue was $19.86 billion, a decrease of -1.18% compared to the previous year's $20.09 billion. Earnings were $2.50 billion, a decrease of -3.75%. As investors awaits for the earnings reports NYSE:GIS shares are also waiting for build up momentum to surge breaking above the 1-month high acting as resistant point.
Similarly, should NYSE:GIS faced selling pressure, the 65% Fibonacci retracement level acting as support point would broken leading to consolidatory move to the 1-month low albeit the stock is still bearish at the moment with only Gold surging to new All time high yesterday.
Analyst Forecast
According to 17 analysts, the average rating for GIS stock is "Hold." The 12-month stock price forecast is $66.13, which is an increase of 9.41% from the latest price.

Robert F. Kennedy Jr.’s Impact on Food IndustryThe same man who set pharmaceuticals dancing is now turning his attention to the food industry. Robert F. Kennedy Jr, head of the U.S. Department of Health, will meet today with top executives from General Mills (Ticker AT:GIS.US) and PepsiCo (Ticker AT:PEP.US), according to Politico. Pushed by the White House, this meeting aims to discuss the elimination of additives and ultra-processed products in schools, which could trigger significant regulatory changes in an industry already under pressure from rising raw material costs and demand for healthier products.
General Mills and PepsiCo: Two models of success
General Mills, founded in 1866, has a broad portfolio spanning cereals, baked goods, dairy and snacks. Iconic brands such as Cheerios, Haagen-Dazs and Yoplait attest to its commitment to sustainability and response to the growing demand for organic and lower-sugar foods. Its expansion into emerging markets has been key to its growth.
PepsiCo stands out as one of the largest food and beverage multinationals, with recognized brands such as Pepsi, Lay's, Gatorade, Quaker and Tropicana. Its innovation strategy, based on vertical integration and the acquisition of emerging functional food companies, has strengthened its global position and its commitment to healthier options.
Market Reactions and Stock Performance
Today's meeting could cause volatility in the stock market. The possibility of new food regulations may lead both companies to reformulate their flagship products, affecting margins and creating opportunities for competitors with more natural alternatives.
In the case of General Mills, the chart shows an upward trajectory until May 2023, followed by a correction towards the $60 area, considered a checkpoint, from its highs of $90.89. PepsiCo, on the other hand, experienced a similar development: a rise until May 2023, a pullback towards an accumulation zone around $168.66 and a recovery attempt in February. The RSI for both is in a neutral zone, reflecting a balance between buying and selling pressure.
Future outlook
Beyond the meeting, General Mills and PepsiCo continue to adapt to a market where demand for less processed and healthier products is steadily growing. However, regulatory pressure could accelerate the transformation of their product portfolios. Investors will be watching for post-meeting statements, as any concrete action could decisively influence their stock performance and redefine the FMCG landscape.
*******************************************************************************************
The information provided does not constitute investment research. The material has not been prepared in accordance with the legal requirements designed to promote the independence of investment research and such should be considered a marketing communication.
All information has been prepared by ActivTrades ("AT"). The information does not contain a record of AT's prices, or an offer of or solicitation for a transaction in any financial instrument. No representation or warranty is given as to the accuracy or completeness of this information.
Any material provided does not have regard to the specific investment objective and financial situation of any person who may receive it. Past performance is not reliable indicator of future performance. AT provides an execution-only service. Consequently, any person acing on the information provided does so at their own risk.

GENERAL MILLS Stock Chart Fibonacci Analysis 022325Trading Idea
1) Find a FIBO slingshot
2) Check FIBO 61.80% level
3) Entry Point > 57/61.80%
Chart time frame: D
A) 15 min(1W-3M)
B) 1 hr(3M-6M)
C) 4 hr(6M-1year)
D) 1 day(1-3years)
Stock progress: A
A) Keep rising over 61.80% resistance
B) 61.80% resistance
C) 61.80% support
D) Hit the bottom
E) Hit the top
Stocks rise as they rise from support and fall from resistance. Our goal is to find a low support point and enter. It can be referred to as buying at the pullback point. The pullback point can be found with a Fibonacci extension of 61.80%. This is a step to find entry level. 1) Find a triangle (Fibonacci Speed Fan Line) that connects the high (resistance) and low (support) points of the stock in progress, where it is continuously expressed as a Slingshot, 2) and create a Fibonacci extension level for the first rising wave from the start point of slingshot pattern.
When the current price goes over 61.80% level , that can be a good entry point, especially if the SMA 100 and 200 curves are gathered together at 61.80%, it is a very good entry point.
As a great help, tradingview provides these Fibonacci speed fan lines and extension levels with ease. So if you use the Fibonacci fan line, the extension level, and the SMA 100/200 curve well, you can find an entry point for the stock market. At least you have to enter at this low point to avoid trading failure, and if you are skilled at entering this low point, with fibonacci6180 technique, your reading skill to chart will be greatly improved.
If you want to do day trading, please set the time frame to 5 minutes or 15 minutes, and you will see many of the low point of rising stocks.
If want to prefer long term range trading, you can set the time frame to 1 hr or 1 day.

GIS to $60My trading plan is very simple.
I buy or sell when price tags the top or bottom of parallel channels.
I confirm when price hits Fibonacci levels.
So...
Here's why I'm picking this symbol to do the thing.
Price at bottom of channels (period 52 39 & 26)
Stochastic Momentum Index (SMI) at oversold level
VBSM is spiked negative and at bottom of Bollinger Band
Entry at $58.25
Target is $60 or channel top

GIS General Mills Options Ahead of EarningsIf you haven`t sold GIS before the previous earnings:
Now analyzing the options chain and the chart patterns of GIS General Mills prior to the earnings report this week,
I would consider purchasing the 57.5usd strike price Puts with
an expiration date of 2025-9-19,
for a premium of approximately $1.92.
If these options prove to be profitable prior to the earnings release, I would sell at least half of them.

General Mills (GIS) Earnings: Key Insights and Market ImpactGeneral Mills (NYSE: NYSE:GIS ) is set to announce its earnings results today, September 18, 2024, before the market opens. As one of the largest packaged food companies, investors and analysts are keen to see how the company performed in a challenging economic environment, especially after its recent earnings miss.
Overview
In the previous quarter, General Mills (NYSE: NYSE:GIS ) missed analysts' revenue expectations by 3%, reporting revenues of $4.71 billion, down 6.3% year over year. This was a notable drop, given the company’s traditionally stable performance in the consumer staples sector. Additionally, analysts have forecasted that this quarter’s revenue will decline by 2.1%, which is a reversal from the 4% increase seen in the same period last year. Adjusted earnings per share are expected to be $1.06.
One of the key takeaways from recent earnings is General Mills’ struggle to maintain sales momentum, particularly as the company saw a 1% drop in organic net sales. CEO Jeff Harmening cited that challenging consumer sentiment and inflationary pressures—especially in labor, sourcing, and logistics costs—have impacted their performance. Inflation remains a critical concern, contributing to higher input costs across the board.
While the company faces headwinds, there are still significant opportunities for growth. General Mills (NYSE: NYSE:GIS ) has demonstrated strong financial health, with a robust free cash flow of over $2.5 billion and an impressive 96% conversion rate. The company’s focus on cost savings through holistic margin management (HMM) in fiscal 2025 should provide more room for reinvestment in growth initiatives, potentially bolstering sales.
Moreover, General Mills (NYSE: NYSE:GIS ) is actively positioning itself for the future with innovation, particularly with a 40% increase in “big bet” product launches that have strengthened its market position. Initiatives like a renewed focus on sustainability, regenerative agriculture, and recyclable packaging are expected to drive long-term value. Despite these growth strategies, the company is currently undervalued, trading at a Price-to-Earnings (P/E) ratio of 16.4x, significantly below both its peers (26.7x) and the industry average (19.6x). However, the company’s negative earnings growth (-3.9%) over the past year highlights the challenges it faces in an increasingly competitive industry.
Key Strengths and Weaknesses
- Strengths: Strong free cash flow, financial agility, undervaluation relative to peers, and ongoing innovation.
- Weaknesses: Declining organic sales, inflationary pressures, and weaker earnings growth compared to industry averages.
Opportunities for Growth
General Mills (NYSE: NYSE:GIS ) is focused on driving margin improvements in fiscal 2025, especially by reinvesting in growth opportunities aimed at creating remarkable consumer experiences. The company’s focus on iconic brands like the Pillsbury Doughboy and family-centered marketing campaigns could accelerate organic sales growth. The company also continues to invest in sustainability, which could help differentiate it from competitors in a market where consumers are increasingly environmentally conscious.
Threats and Risks
The major risks for General Mills (NYSE: NYSE:GIS ) remain tied to macroeconomic conditions. With continued uncertainty, consumers are likely to engage in value-seeking behavior, which could pressure the company’s pricing strategies and margins. Additionally, smaller competitors and private labels pose an increasing threat to General Mills' market share. Regulatory challenges and potential inflation-driven cost increases (expected to be 3% to 4% of cost of goods sold) could also affect the company’s bottom line.
Technical Outlook
From a technical perspective, General Mills (NYSE: NYSE:GIS ) is currently in a critical position. As of this morning's premarket trading, the stock is down 0.60%, and the daily chart suggests the formation of a falling wedge pattern, which often signals a bearish reversal. This pattern will be confirmed or denied once General Mills releases its earnings report before the market opens. The RSI (Relative Strength Index) is sitting at 66.62, close to overbought territory, but it may signal a fakeout rather than a clear indicator of a bullish continuation.
If the earnings surprise positively, the stock could break out of the wedge and rise further, driven by renewed investor confidence. Conversely, any disappointment in today’s earnings report could lead to further declines in the stock price. Given the stock’s recent 6.9% increase in share price over the last month, investors will be closely watching today’s report to determine whether General Mills (NYSE: NYSE:GIS ) can sustain its growth trajectory or if the challenges will weigh more heavily on its stock performance.
Conclusion
General Mills (NYSE: NYSE:GIS ) is at a pivotal moment, both fundamentally and technically. While the company has a proven track record of financial health and innovation, its recent struggles with inflation and organic sales growth could be significant barriers to further success. Investors will be watching closely to see how the company navigates these challenges and whether today's earnings report will provide the catalyst for a continued upward trend or signal further headwinds.

GIS General Mills Options Ahead of EarningsIf you didn’t short GIS before the selloff:
Now analyzing the options chain and the chart patterns of GIS General Mills prior to the earnings report this week,
I would consider purchasing the 72.5usd strike price Puts with
an expiration date of 2024-9-20,
for a premium of approximately $0.85.
If these options prove to be profitable prior to the earnings release, I would sell at least half of them.

GIS - Conservative Income PlayGeneral Mills has been gaining a bit of strength crossing above it's 20 week moving average. Volatility is dead flat.
Transacting a June 25 67.5 buy/write, in addition to a 3.5% dividend results in this play producing in annualized rate of return in excess of 12%.
I do this kind of strategy in a qualified account as dividends received in a buy/write transaction may not be considered qualified dividends. Be sure to seek the advice of an investment adviser before trading any of my ideas.

GIS General Mills Options Ahead of EarningsIf you haven`t sold GIS before the previous earnings:
Now analyzing the options chain and the chart patterns of GIS General Mills prior to the earnings report this week,
I would consider purchasing the 67.50usd strike price Puts with
an expiration date of 2024-7-19,
for a premium of approximately $2.02.
If these options prove to be profitable prior to the earnings release, I would sell at least half of them.

GIS weekly Cup formation progress LONGGIS a consumer staples is set up long and is a good defensive play for recession or black swan
events. The idea is on the chart. I am long since the first of the year. Adding for small dips
on the daily or 180 minute chart. Food is about as basic as it gets. GIS is a market leader.
TSN idea also. What about McDonalds?

General Mills Rides Price Hikes to Beat Quarterly EstimatesGeneral Mills ( NYSE:GIS ), the iconic maker of Cheerios and a wide array of pantry staples, has once again exceeded market expectations in its third-quarter earnings report, buoyed by strategic price adjustments across its product portfolio. Despite challenges stemming from inflation and shifting consumer preferences, the Minnesota-based company's proactive approach to pricing has proven effective in maintaining profitability.
The company's decision to raise prices on breakfast cereals, snack bars, and pet food products has not only cushioned the impact of escalating labor and input costs but also contributed to a notable increase in gross margin. With a 7% surge in early trading following the earnings release, investors have expressed confidence in General Mills' ability to navigate the current economic landscape.
CEO Jeff Harmening acknowledges the evolving consumer behavior characterized by a preference for value-oriented purchases. However, Harmening remains optimistic, noting signs of inflation moderation and a reduction in supply chain disruptions, providing a glimmer of hope for sustained growth.
While General Mills' ( NYSE:GIS ) gross margin saw a significant boost to 33.5% year-on-year, quarterly volumes experienced a decline similar to industry peers like Kraft Heinz. Despite challenges in the pet food segment, attributed to shifting consumer preferences and retailer inventory adjustments, the company reported a modest improvement in retail sales for its Blue Buffalo brand.
Analysts, including Barclays' Andrew Lazar, note the positive trajectory in General Mills' pet business, signaling investor confidence in its long-term prospects. The company's quarterly net sales, while experiencing a slight dip of about 1% to $5.1 billion, outpaced analysts' expectations, showcasing the resilience of its pricing strategy.
With adjusted profits surpassing estimates at $1.17 per share, General Mills' performance underscores its ability to adapt to dynamic market conditions and deliver shareholder value. As consumers continue to navigate economic uncertainties, General Mills remains steadfast in its commitment to providing quality products while effectively managing costs.

GIS potential buy setupReasons for bullish bias:
- Price-giving accumulation phase breakout
- Bullish divergence
- Earnings on 20th March, might pump up
Here are the recommended trading levels:
Entry Level(CMP): 67.87
Stop Loss Level: 61.16
Take Profit Level 1: 74.58
Take Profit Level 2: Open

GIS General Mills Options Ahead of EarningsIf you haven`t bought GIS before the rally:
nor sold the potential selloff:
Then analyzing the options chain and the chart patterns of GIS General Mills prior to the earnings report this week,
I would consider purchasing the 62.50usd strike price Puts with
an expiration date of 2024-4-19,
for a premium of approximately $0.60.
If these options prove to be profitable prior to the earnings release, I would sell at least half of them.
