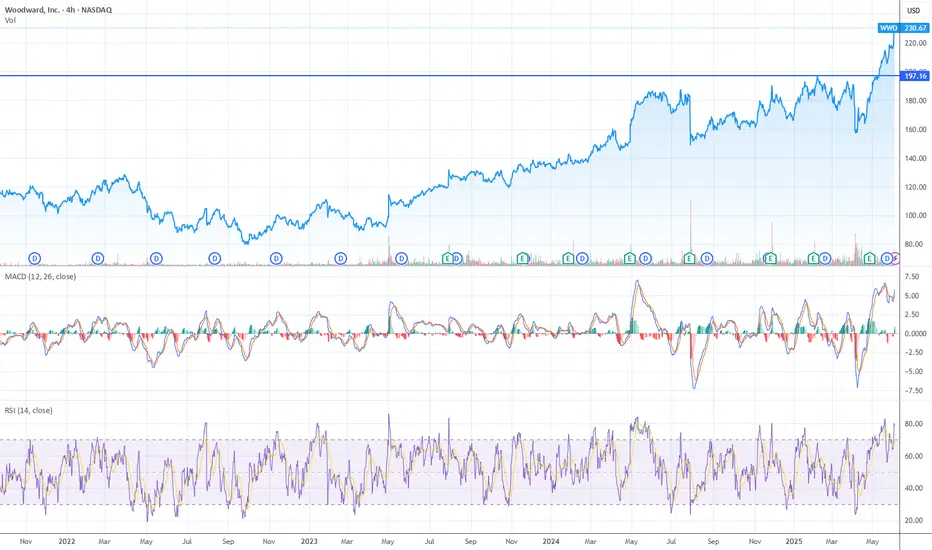
Woodward Breaks Out: $250 in Sight as Momentum Clears Multi-YearWoodward Inc. (WWD) just completed a textbook breakout from long-term resistance near $197, and the move is being confirmed with strong momentum, but near-term caution is warranted as RSI and MACD are both flashing extended conditions.
Technical Breakdown – WWD
Price Action – Long-Term Breakout
Pr
Next report date
—
Report period
—
EPS estimate
—
Revenue estimate
—
6 EUR
376.76 M EUR
3.04 B EUR
56.55 M
About Woodward, Inc.
Sector
Industry
CEO
Charles P. Blankenship
Website
Headquarters
Fort Collins
Founded
1870
ISIN
US9807451037
FIGI
BBG000BQ8LS4
Woodward, Inc. engages in the design and manufacture of control solutions for the aerospace and industrial markets. It operates through the Aerospace and Industrial segments. The Aerospace segment involves the design, manufacture, services systems, and products for the management of fuel, air, combustion, and motion control. The Industrial segment includes the management of fuel, air, fluids, gases, electricity, motion, and combustion. The company was founded by Amos W. Woodward in 1870 and is headquartered in Fort Collins, CO.
Related stocks
$WWD - technically move to the moonNASDAQ:WWD
Ticker :
$WWD (Woodwards)
Forecast :
Possible growth 44% from 98$ to 143$ in 4 months.
Does not constitute a recommendation.

$WWD a bullish outlook after earning release $WWD posted its earnings with a negative over reaction following its release with the PEAD projecting a bullish outlook placing the stock in Drift C
If you would like to see the Drift for another stock please message us. Also click on the Like Button if this was useful and follow us or join us.

WWD throught 98 ATH Love these bluesky break out opportunities.
going to base in around 97, take a full position through 98
vs 95 (94.89)


See all ideas
An aggregate view of professional's ratings.
Neutral
SellBuy
Strong sellStrong buy
Strong sellSellNeutralBuyStrong buy
Neutral
SellBuy
Strong sellStrong buy
Strong sellSellNeutralBuyStrong buy
Neutral
SellBuy
Strong sellStrong buy
Strong sellSellNeutralBuyStrong buy
Displays a symbol's price movements over previous years to identify recurring trends.
Frequently Asked Questions
Depending on the exchange, the stock ticker may vary. For instance, on FWB exchange Woodward, Inc. stocks are traded under the ticker WW1.
We've gathered analysts' opinions on Woodward, Inc. future price: according to them, WW1 price has a max estimate of 310.42 EUR and a min estimate of 250.06 EUR. Watch WW1 chart and read a more detailed Woodward, Inc. stock forecast: see what analysts think of Woodward, Inc. and suggest that you do with its stocks.
Yes, you can track Woodward, Inc. financials in yearly and quarterly reports right on TradingView.
Woodward, Inc. is going to release the next earnings report on Feb 2, 2026. Keep track of upcoming events with our Earnings Calendar.
WW1 earnings for the last quarter are 1.78 EUR per share, whereas the estimation was 1.61 EUR resulting in a 10.96% surprise. The estimated earnings for the next quarter are 1.44 EUR per share. See more details about Woodward, Inc. earnings.
Woodward, Inc. revenue for the last quarter amounts to 848.16 M EUR, despite the estimated figure of 800.70 M EUR. In the next quarter, revenue is expected to reach 767.18 M EUR.
WW1 net income for the last quarter is 117.28 M EUR, while the quarter before that showed 92.06 M EUR of net income which accounts for 27.39% change. Track more Woodward, Inc. financial stats to get the full picture.
Yes, WW1 dividends are paid quarterly. The last dividend per share was 0.24 EUR. As of today, Dividend Yield (TTM)% is 0.39%. Tracking Woodward, Inc. dividends might help you take more informed decisions.
Woodward, Inc. dividend yield was 0.44% in 2025, and payout ratio reached 15.57%. The year before the numbers were 0.58% and 16.65% correspondingly. See high-dividend stocks and find more opportunities for your portfolio.
As of Dec 10, 2025, the company has 10.2 K employees. See our rating of the largest employees — is Woodward, Inc. on this list?
EBITDA measures a company's operating performance, its growth signifies an improvement in the efficiency of a company. Woodward, Inc. EBITDA is 523.77 M EUR, and current EBITDA margin is 17.51%. See more stats in Woodward, Inc. financial statements.
Like other stocks, WW1 shares are traded on stock exchanges, e.g. Nasdaq, Nyse, Euronext, and the easiest way to buy them is through an online stock broker. To do this, you need to open an account and follow a broker's procedures, then start trading. You can trade Woodward, Inc. stock right from TradingView charts — choose your broker and connect to your account.