US30 (Dow Jones) 4H Chart AnalysisPotential Head & Shoulders Breakdown
Pattern: Head and Shoulders
Breakout Zone: ~44,796
Retest Expected before potential continuation lower
Entry: After confirmed rejection near 44,796 (retest zone)
Target: 43,738 (TP zone based on previous support)
Stop Loss: Above recent high (~44,837)
📉 If price respects the neckline and fails to break back above, I’ll be looking for short opportunities with favorable risk-reward.
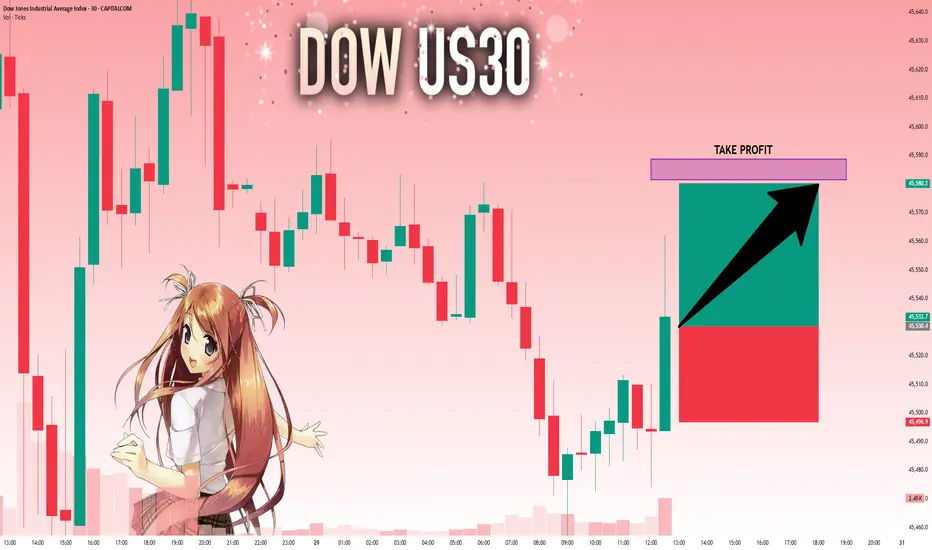
US30 trade ideas

US30-ShortBecause Powell is not lowering interest rates and due to seasonality factor US30 is a clear short in the month of August
DowJones corrective pullback support at 44380Key Support and Resistance Levels
Resistance Level 1: 45400
Resistance Level 2: 45660
Resistance Level 3: 46000
Support Level 1: 44380
Support Level 2: 44080
Support Level 3: 43675
This communication is for informational purposes only and should not be viewed as any form of recommendation as to a particular course of action or as investment advice. It is not intended as an offer or solicitation for the purchase or sale of any financial instrument or as an official confirmation of any transaction. Opinions, estimates and assumptions expressed herein are made as of the date of this communication and are subject to change without notice. This communication has been prepared based upon information, including market prices, data and other information, believed to be reliable; however, Trade Nation does not warrant its completeness or accuracy. All market prices and market data contained in or attached to this communication are indicative and subject to change without notice.

SHORT DJ / US30 READINGBreakout Of Trendline
Entry Price .... 44,820.32
US30... 44,820.32
S/L ...44,950.0
T/P ...44,500.0
And More

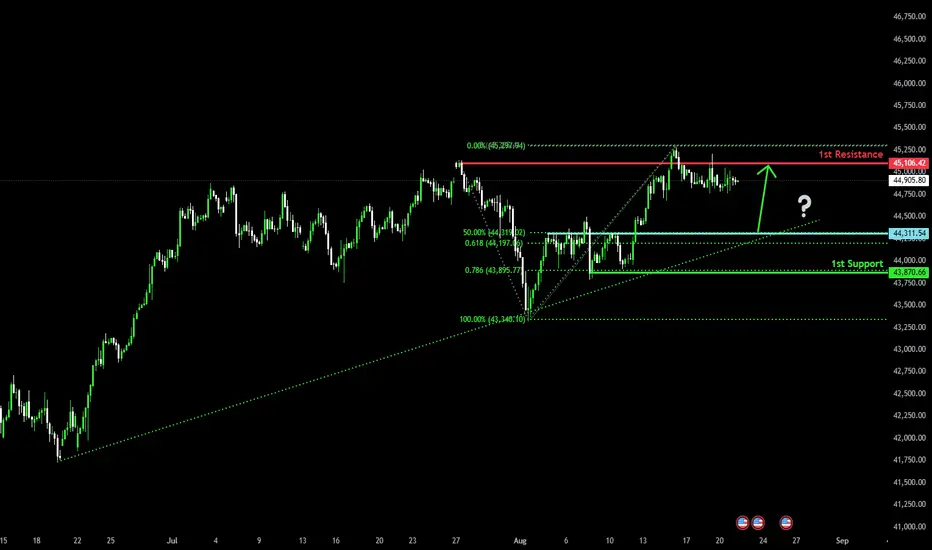
Could we see a bounce from here?Dow Jones (US30) is falling towards the pivot, which acts as a pullback support and could bounce to the 1st resistance, which is a multi-swing high resistance.
Pivot: 44,311.54
1st Support: 43,870.66
1st Resistance: 45,106.42
Risk Warning:
Trading Forex and CFDs carries a high level of risk to your capital and you should only trade with money you can afford to lose. Trading Forex and CFDs may not be suitable for all investors, so please ensure that you fully understand the risks involved and seek independent advice if necessary.
Disclaimer:
The above opinions given constitute general market commentary, and do not constitute the opinion or advice of IC Markets or any form of personal or investment advice.
Any opinions, news, research, analyses, prices, other information, or links to third-party sites contained on this website are provided on an "as-is" basis, are intended only to be informative, is not an advice nor a recommendation, nor research, or a record of our trading prices, or an offer of, or solicitation for a transaction in any financial instrument and thus should not be treated as such. The information provided does not involve any specific investment objectives, financial situation and needs of any specific person who may receive it. Please be aware, that past performance is not a reliable indicator of future performance and/or results. Past Performance or Forward-looking scenarios based upon the reasonable beliefs of the third-party provider are not a guarantee of future performance. Actual results may differ materially from those anticipated in forward-looking or past performance statements. IC Markets makes no representation or warranty and assumes no liability as to the accuracy or completeness of the information provided, nor any loss arising from any investment based on a recommendation, forecast or any information supplied by any third-party.
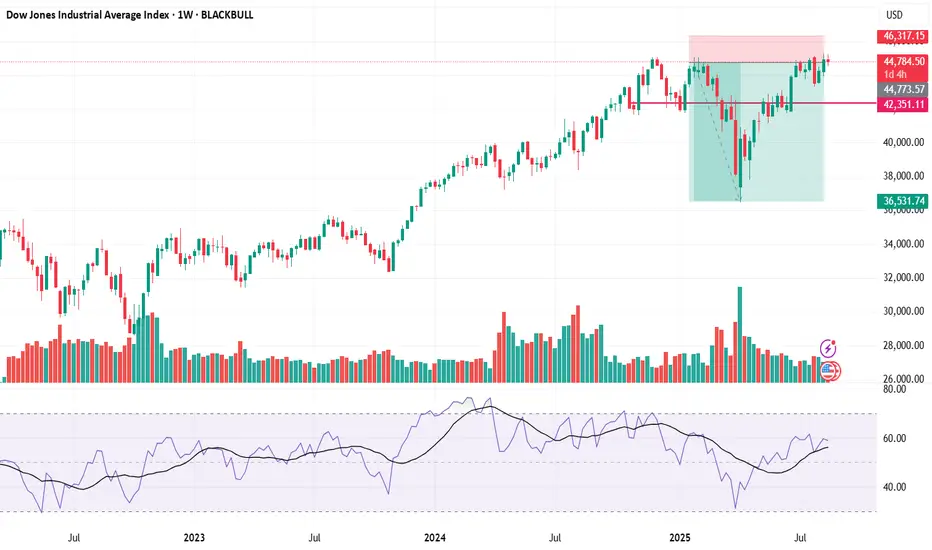
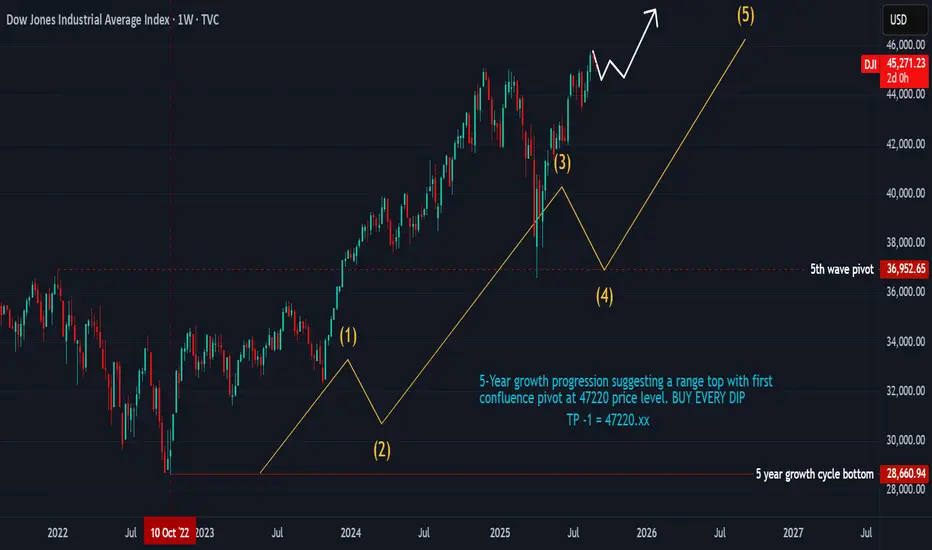
THE BIG TOP ... THE MID-CYCLE CORRECTION COMES SOONTHE BULL IS NOT DEAD YET...
Alternate Cycle progression puts 1942 - 1947, 1982 - 1987. and 2022 - 2027 on the same phase of a larger 20-year cycle. This is the smallest growth cycle that completes in approximately five (5) years. It forms the first section of every alternate 20-year cycle and carves out a very identical fractal. This fractal remerges every 40 to 43 years. This is the basis of Gann's 43-year cycle repetition.
1942 - 1947 5-year cycle
1982 - 1987 Cycle
2022 - 2027 Cycle in progression
Putting the price and time advances into a cumulative progression suggests that we are getting closer to a first correction at 47200 level. It also suggests that the next time and price for the current cycle is measurable and quantifiable with a very slim margin for error.
27th October is a major timeline to watch
Beyond that we have March 2026
TRADE PLAN:
We will close all buy entries in October
We will buy again in May 2026 for another 2-year bull cycle.
Follow for more updates
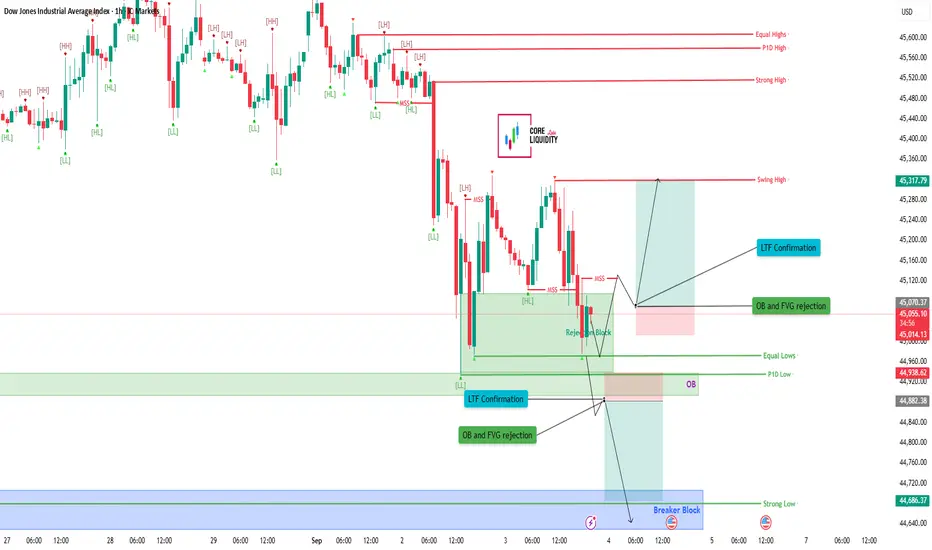
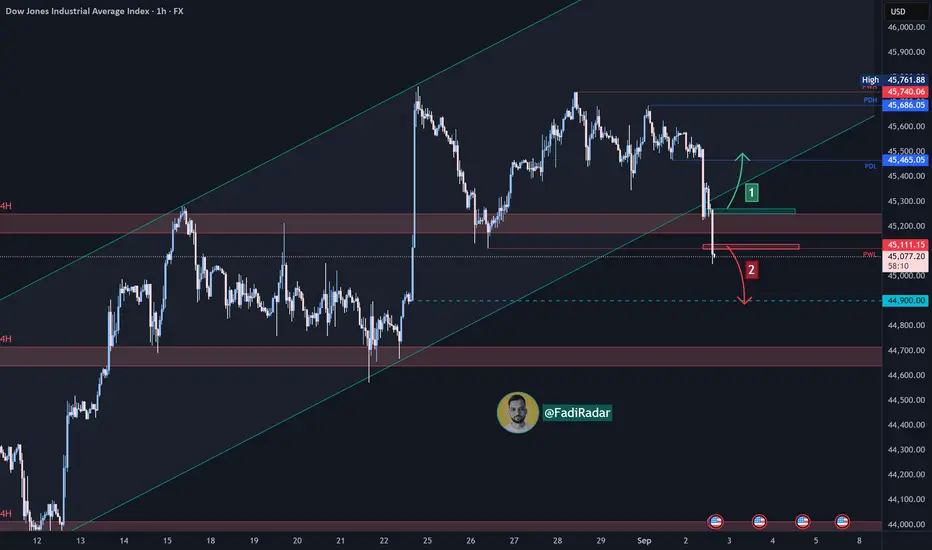
US30 – 1H | Testing Rejection Block & LTF Confirmation
Dow Jones is reacting from a rejection block with lower-timeframe confirmation showing. Market structure shift suggests possible retrace setups.
**Bullish Scenario:**
* Hold above 44,950–45,000 zone (OB & FVG support)
* LTF confirmation aligns with rejection block
* Upside targets: 45,320 swing high → 45,520 strong high
**Bearish Scenario:**
* Lose 44,950 and break below 44,900 P1D Low
* Continuation toward 44,700 breaker block → 44,680 strong low
* Deep downside if OB rejection fails
**Key Levels:**
* Resistance: 45,320 / 45,520 / 45,600
* Support: 44,950 / 44,900 / 44,700 / 44,680
💬 Will US30 hold rejection block for upside push, or break lower into the breaker block?
US30predict for 3 month ago blob blob blbo....
all of my idea is on the chart what the hell i must say?
Us30 longU30 forms a spring on the 4hr.
The general market is bullish on the daily, so underlying conditions are on our side, I can't stress enough the value of that,
So far, setup looks A+

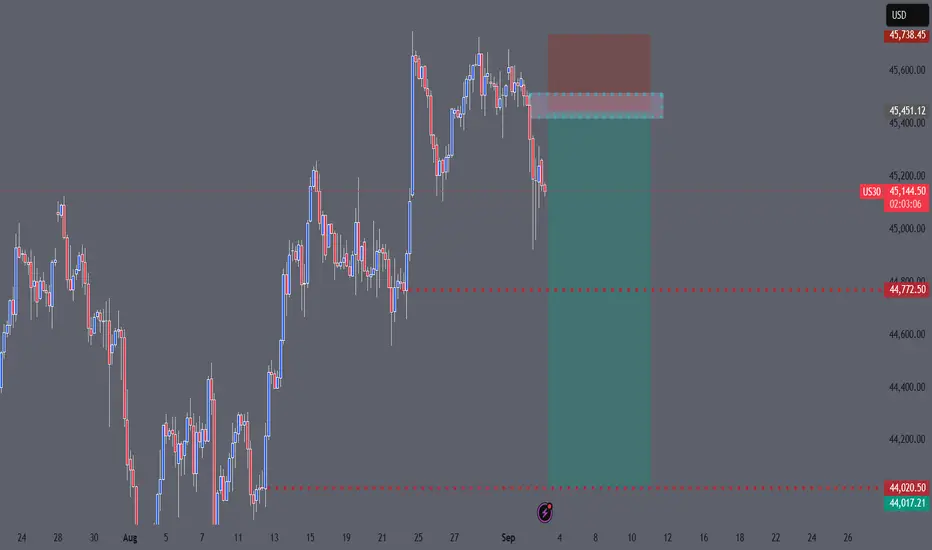
US30 WILL BLEEDWe are entering a short (sell) trade on US30 because the market failed to create new highs and reversed from a strong resistance/supply zone with good breakout, Structure and momentum now favor the downside. Targets are set at 44,770 and 44,020, with a stop above 45,740 to manage risk.
SHORT ON DJ / US30 READINGInner trendline Break and Retest earlier today
Change the Bias on Long for US30 to a Short in our group
We start Selling at the Breakout On H2 timeframe
Entry Price .... 45,600.0
DJ / US30... 45,600.0
S/L ...45,750.00
T/P ...45,989.0
Also looking at a final touch to 44,500.0 LEVEL.
Make sure to Subscribe for more and early trade signal.

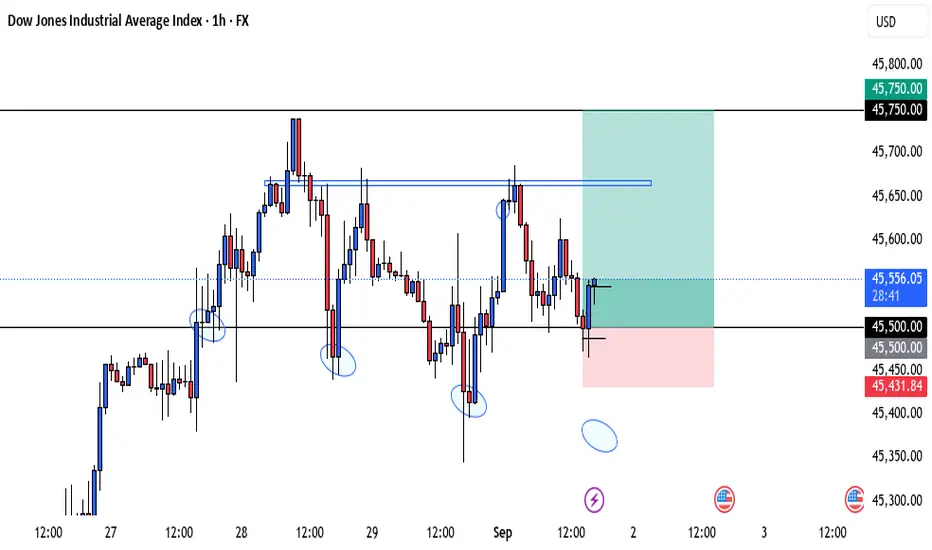
Dow Jones Index Analysis (US30 / Dow Jones)At today’s market open, the Dow Jones index started to decline and is currently testing a key support level at 45,100.
🔺 Bullish Scenario:
If the price rebounds and holds above 45,300, this may drive the index higher toward 45,500.
🔻 Bearish Scenario:
If the price breaks below 45,100 and holds, the index may head to test the 44,700 support area.
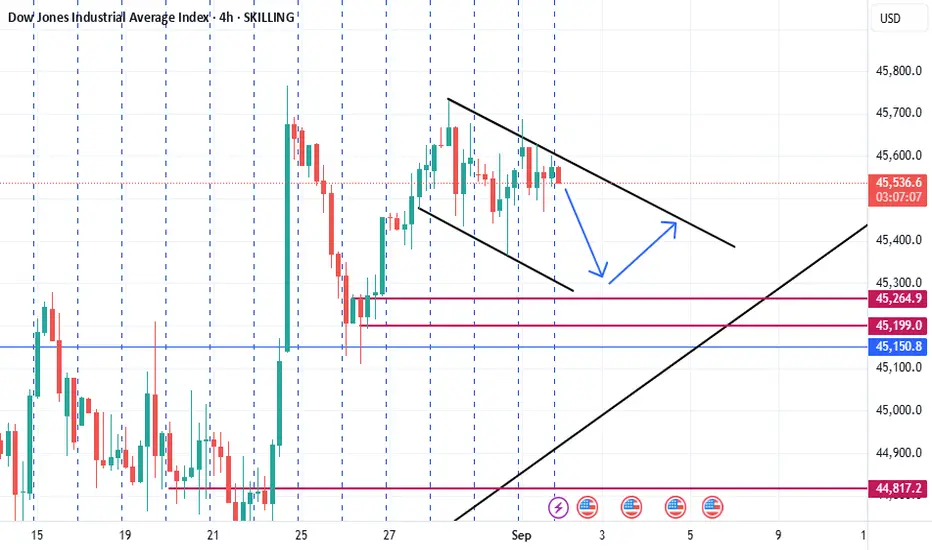
US 30 TRADE IDEA 1 SEPTEMBER 2025This week, the US30 is trading within a short-term descending channel, signaling a corrective phase rather than a full reversal, while the higher timeframe structure remains bullish. Price is approaching a key demand zone between 45,200 and 45,150, where liquidity is likely to be swept before a potential continuation higher. From a Smart Money Concepts perspective, this area aligns with a bullish order block that could drive price back toward the 45,600–45,800 region once buyers step in. However, a clean break below 45,000 would invalidate this setup and open room for further downside toward 44,850–44,700. Fundamentally, the focus will be on US labor market data, including jobless claims and the upcoming NFP release, as signs of a cooling labor market may reinforce expectations of Fed rate cuts later in the year, supporting equities. Conversely, stronger-than-expected data or hawkish Fed commentary could pressure the Dow in the short term. Overall, the primary bias is bullish after a liquidity grab around 45,200–45,150, with upside targets near 45,800, but traders should remain cautious of a bearish continuation if 45,000 fails to hold.
Us30 active buy Us30 active buy aiming for +120 pips Target to create the wick on the last daily candle without a wick
aslong as we remain above MAs we are bullish

US30 (Dow Jones) Approaches Key Resistance - Can It Break ThrougThe US30 (Dow Jones Industrial Average) is putting on a show today, pushing higher towards a critical resistance zone.
Key Levels to Watch:
* Resistance: The major ceiling is clearly at ~45,750. The price has tested this level multiple times today and is currently consolidating just below it. A decisive break and close above this could signal a strong bullish continuation.
* Support: Immediate support sits near 45,430-45,490. A break below this zone could see a pullback towards the 45,300 level.
The price action is looking strong, but the real test is happening now at this significant resistance. Volume on a breakout will be key for confirmation.
What's your take?
* Bullish breakout above 45,800?
* Or a rejection for a pullback?
Tags: #US30 #DOWJONES #Trading #Investing #Stocks #Finance #TechnicalAnalysis #PriceAction #Resistance #Support #TradingView
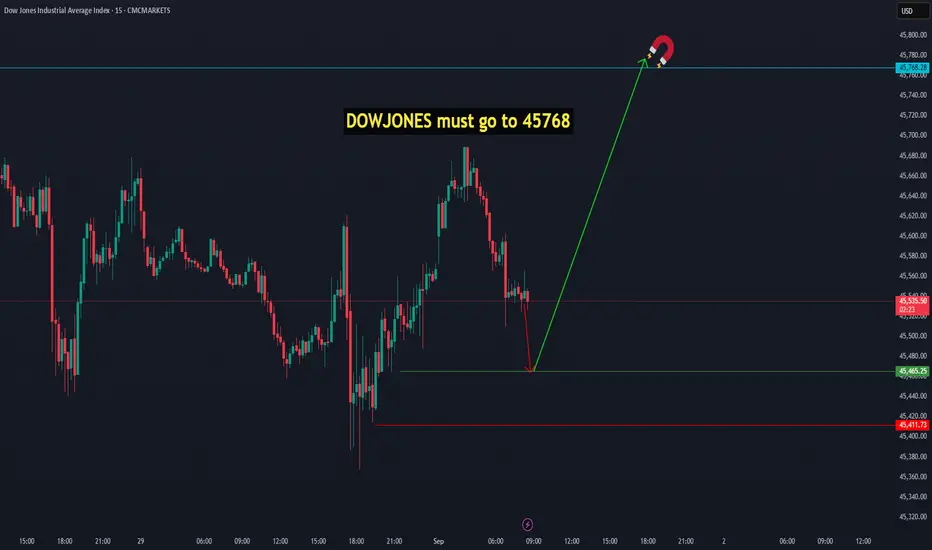
DOWJONES must go to 45768Dow Jones has the potential to start its upward move from the price range of 45,465 to 45,411, targeting 45,768. Even if this support range is broken and price goes lower, the target of 45,768 remains certain and must eventually be reached. CMCMARKETS:US30
LONG ON DJ / US30 READING Continuation after a short PullBack On H1 timeframe
Another Entry can be done on the current Trend Line to the upside.
After a Breakout to the upside which is still valid for a Buy trade
Entry Price .... 45,500.0
DJ / US30... 45,500.0
S/L ...45,355.00
T/P ...45,700.0
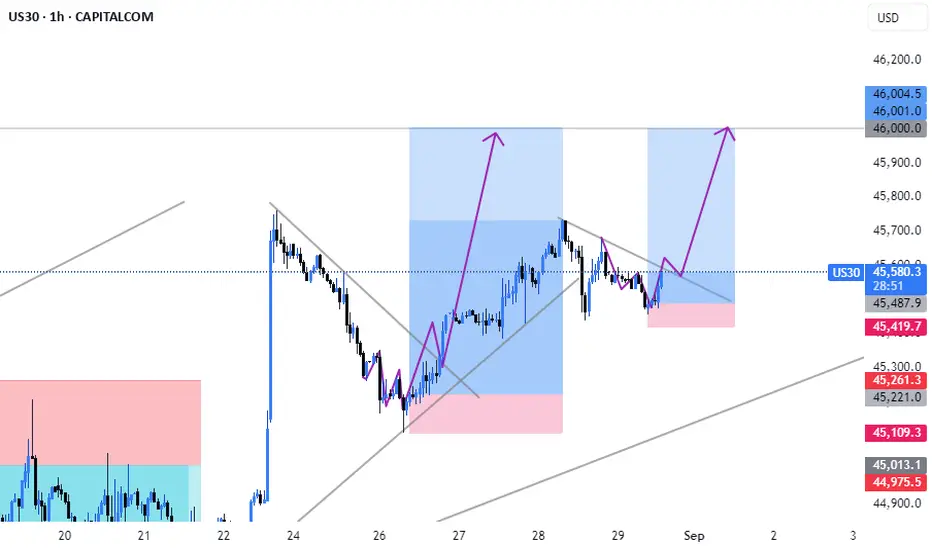
Also looking at a final touch to 46,000.0 LEVEL.
And More
Make sure to like and Subscribe to for more trade ideas in the coming week.
Trade Responsibly.

US30 4HTrading Outlook for Major Currency Pairs and Indices, Especially Gold and Silver, in the Upcoming Week
In this series of analyses, we have reviewed short-term trading perspectives and market outlooks.
As can be seen, each analysis highlights a key support or resistance area near the current price of the asset. The market’s reaction to or break of these levels will determine the subsequent price trend up to the next specified levels.
Important Note: The purpose of these trading outlooks is to identify key price levels and potential market reactions, and the analyses provided should not be considered as trading signals.
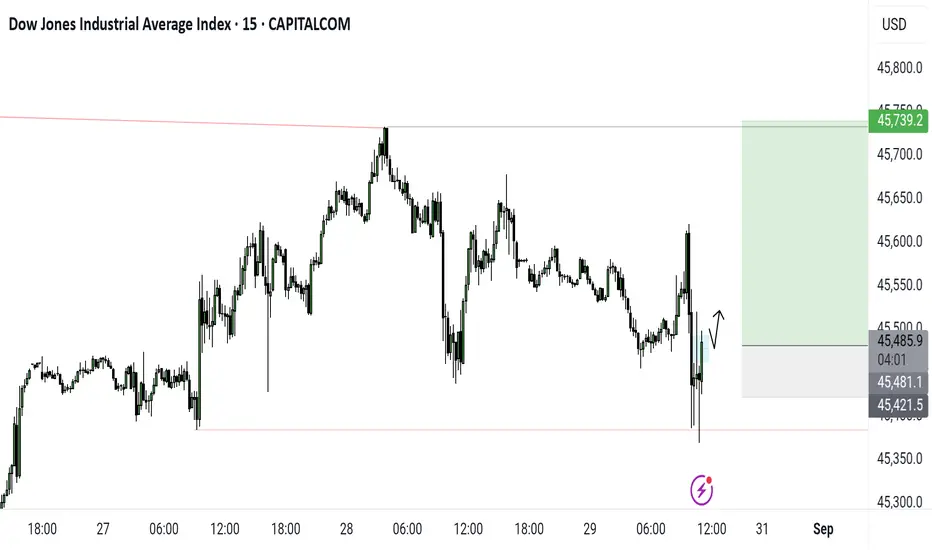
Last Day Of The Month ,But...Today was A Clear TGIF And The Last Day Of The Month, But CSID Or Inversed FVG Closed Above Is A Great Long Position To The Office Low Resistance Liquidity

LONG ON DJ / US30 READINGContinuation after a short PullBack On H1 timeframe
Another Entry can be done on the current Trend Line to the upside.
After a Breakout to the upside which is still valid for a Buy trade
Entry Price .... 45,487.26
DJ / US30... 45,487.26
S/L ...45,400.00
T/P ...45,650.0
Also looking at a final touch to 46,000.0 LEVEL.
And More
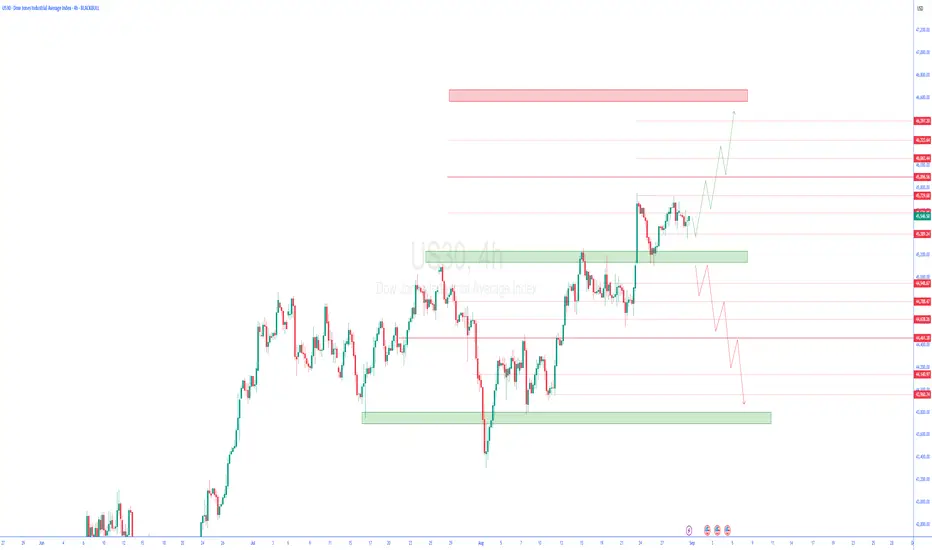
Dow Jones Index Analysis (US30 / Dow Jones)The index is currently trading in an overall uptrend, showing a rebound from the recent support zone at 45,440.
🔺 Bullish Scenario:
If the price holds above 45,440, it could push the index towards 45,700, and then open the way to 46,000.
🔻 Bearish Scenario:
If the price breaks below 45,440 and holds beneath it, the index may head to test the 45,200 level.

US30: Bulls Are Winning! Long!
My dear friends,
Today we will analyse US30 together☺️
The price is near a wide key level
and the pair is approaching a significant decision level of 45,530.4 Therefore, a strong bullish reaction here could determine the next move up.We will watch for a confirmation candle, and then target the next key level of 45,581.4 .Recommend Stop-loss is beyond the current level.
❤️Sending you lots of Love and Hugs❤️