Trade ideas
U30 Trade Set Up Oct 20 2025I want to see price sweep BSL/London highs to then look for internal bearish structure on the 1m-5m to take sells to internal SSL

DOW JONES INDUSTRIAL HIGH PROBABILITY SETUP SOON!!!🚨 DJ30 HIGH PROBABILITY SELL SETUP 🚨
* Here We Can See Clearly The Next Potential Move For US30 Coming Hours/Days.
* Keep Your Eyes Close On Your Trading Positions.
* Happy PIP Hunting Traders.
FXKILLA.

Dow JonesUS 30 - DJI
- Completed " 12345 " Impulsive Waves and " AB " Impulsive Waves
- RSI - Divergence
- Bullish Channel as an corrective pattern in Short Time Frame
- Order Block
- Change of Characteristics

US30 Technical Breakdown – 10/20/2025📍 US30 Technical Breakdown – 10/20/2025
US30 continues to range between key zones as bulls defend the 46,200 level but face heavy rejection pressure near 46,420–46,680 ⚔️. The market’s coiling up again — a decisive breakout is coming soon! ⚡️
📊 Market Behavior:
🔹 Buyers protecting 46,200 zone for the 3rd time
🔹 Price consolidating under resistance
🔹 EMAs tightening — potential volatility ahead
📌 Key Levels:
🔹 Resistance Zones:
46,425 → intraday resistance
46,632 → short-term breakout point
46,680 → key reaction zone
46,893 → upper target 🎯
🔹 Support Zones:
46,247 → EMA dynamic support
46,100 → short-term floor
45,550 → strong demand area
45,320 → higher-timeframe key support
🧠 Bias:
Neutral–Bullish 🟢
➡️ Above 46,680 → bullish momentum toward 46,900+
⬅️ Below 46,100 → sellers regain control

US30 | Correction Continues Below PivotUS30 – Overview | Bearish Correction Toward 46,000
US30 is showing a bearish correction, with price expected to retest the 46,140–46,000 zone before any potential rebound.
If the index closes below 46,000 (1H), it may extend losses toward 45,680 → 45,470.
Technical View
A 1H close above 46,560 would shift momentum bullish, targeting 46,820 → 47,000.
Pivot: 46,410
Bias: Bearish below 46,400

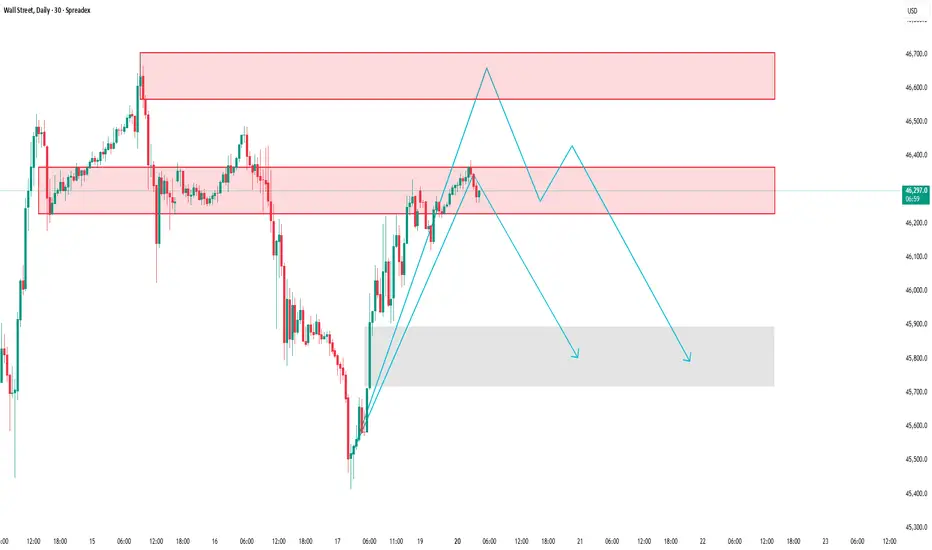
US30: Testing key supply zone, possible pullback ahead
SPREADEX:DJI – Price Reaction at Supply Zone | Possible Short-Term Correction
Timeframe: 30-Minute Chart
Analysis Style: Price Action • Supply & Demand • Market Structure
________________________________________
🧭 Market Context
After a strong rally from the lower demand zone, the Wall Street Index is now approaching a key supply area that previously triggered a sharp downward move.
At this level, sellers are beginning to step in again, and price momentum is starting to fade — suggesting a potential short-term correction ahead.
________________________________________
🧩 Market Structure & Key Zones
🔴 Supply Zone #1: 46,227 – 46,370
→ The first reaction zone, where previous selling pressure started a strong decline.
🔴 Supply Zone #2 (Major Resistance): 46,572 – 46,700
→ A higher zone where strong bearish momentum originated before.
🟢 Demand Zone: 45,900 – 45,700
→ A previous accumulation area that fueled the recent bullish leg — possible support zone if price pulls back.
________________________________________
📊 Current Price Behavior
Price has reached the 46,227 – 46,370 area and is showing signs of buyer exhaustion.
Multiple rejections and slower bullish candles near this level indicate a loss of momentum.
If the short-term bullish structure breaks, the market may shift toward a corrective phase.
________________________________________
📉 Trading Scenario
✅ Primary Scenario (Bearish Reaction Expected):
1. Price might retest 46,229–46,400 once more.
2. Failure to break above this level could lead to a downward “push.”
3. Target zone for the correction: 45,800 – 45,900.
⚙️ Alternative Scenario:
• If price closes clearly above 46,400, the short-term bearish setup becomes invalid.
• In that case, the next resistance to watch lies around 46,600 – 46,700.
________________________________________
💡 Conclusion
The Wall Street Index is currently testing a critical supply zone with visible signs of slowing momentum.
Unless bulls regain control above 46,400, the market may experience a short-term pullback toward the lower demand area.
This analysis is for educational and informational purposes only — not financial advice. Always confirm with your own price action and risk management strategy before making any trading decisions.
Please like and comment below to support our traders. Your reactions will motivate us to do more analysis in the future 🙏✨
Harry Andrew @ ZuperView
The Great Reset In a modern equivalent of the 1929 stock market crash, a rapid and severe market collapse would be triggered by a combination of overleveraged speculation, inflated tech valuations, and sudden shifts in global monetary policy. Within days, trillions in market value could vanish as algorithmic trading amplifies the sell-off, investor panic spreads through social media, and liquidity dries up. Major financial institutions could face insolvency risks, prompting emergency interventions from central banks and triggering a global recession reminiscent of the Great Depression—now unfolding at digital speed.

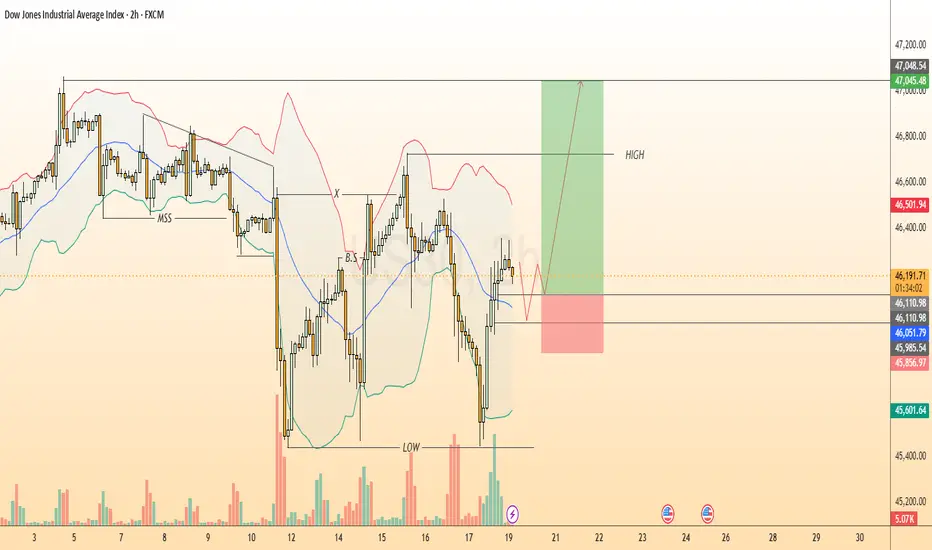
US30 UpdateNext move on the way, focus on proper risk management & stay disciplined. Wishing you successful trades..!
Key Reason:
1. BSL hunting still in pending.
2. Hidden OB formation.
3. When price tap this area and rejected this area along with strong volume. Then we'll see a upside move.
This is not a financial advise. Confirmation is most important. Let's see how it will work.
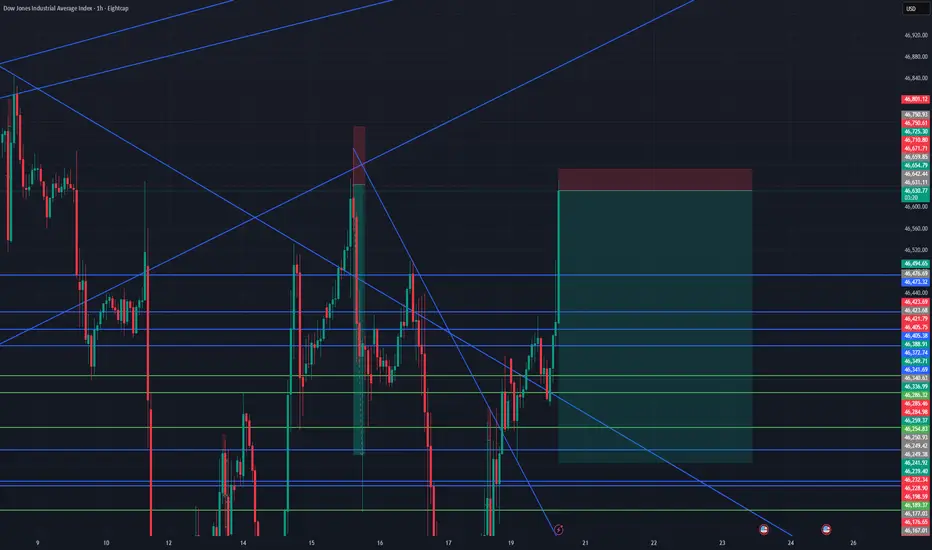
From Sweep to Surge | Dow Jones Liquidity Map Explained Dow Jones (DJI) Analysis | Monday, Oct 20st
Welcome traders! 👋
I’m glad to have you here — we’re all learning and growing together in this amazing trading journey.
Let’s dive into today’s analysis on Dow Jones (DJI) 👇
🧠 Weekly Outlook (October 20st – Monday)
On the weekly timeframe, Dow Jones remains in a bullish trend.
However, on the daily timeframe, price is still in a bearish correction phase within that broader uptrend.
As mentioned in last week’s analysis, price already swept liquidity below the double-bottom lows and turned bullish afterward.
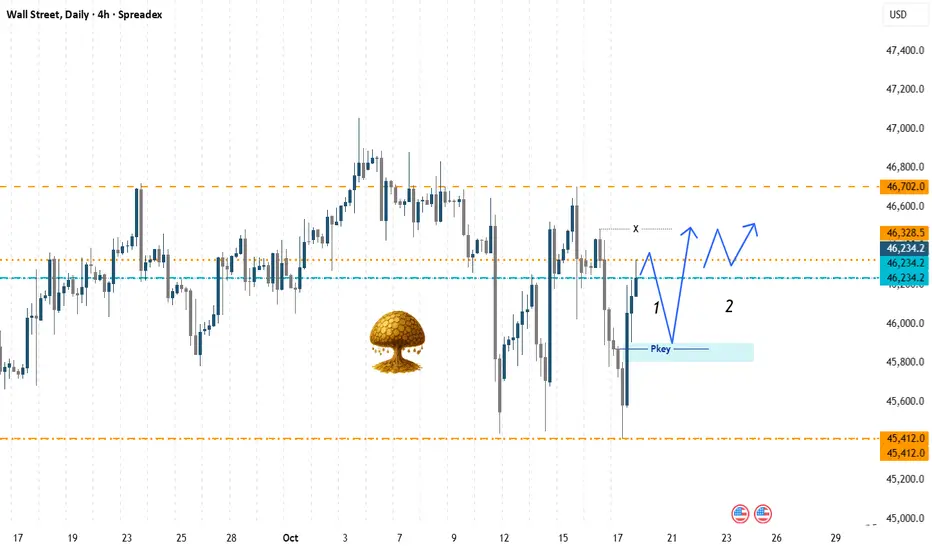
On the 4-hour timeframe, the sell-side liquidity has been taken, and price is now moving toward buy-side liquidity — showing signs of continuation to the upside.
🎯 Monday Scenarios
Here are the two possible setups I’m watching for the start of the trading week:
Scenario 1:
Price reacts to the 4H imbalance / POI. zone, giving bullish confirmation and moving upward toward the buy-side liquidity targets.
Scenario 2:
Price moves directly upward without touching the imbalance, forming higher highs and higher lows, and continues toward the upper liquidity zone.
⚠️ Keep in mind:
The market is never 100% certain.
Always wait for confirmation, manage risk carefully, and stay aware of upcoming economic news before entering any trade.
📅 This analysis is valid for Monday only.
Share your thoughts below 💬
Do you see the same scenario playing out, or are you watching a different setup?
📘 Educational Note:
This analysis is for educational and illustrative purposes only.
Always follow your own plan, confirm with your strategy, and manage risk carefully.
Success in trading comes from discipline, patience, and consistency. 💪
🚀 Empowering traders through clarity, confidence & clean charts.
Follow 👉 parisa_tl for more liquidity setups and weekly insights 💙
#DowJones #DJI #us30 #smartmoneyconcepts #forexanalysis #priceaction #tradingpsychology #liquiditytrading #marketstructure #smcstrategy #forexsetup #smartmoney #technicalanalysis #supplyanddemand #indextrading #smccommunity #forexmentor #priceactiontrader #us30analysis #fxtrader #daytrader #forexeducation #riskmanagement #forexcharts #marketoutlook #tradingview
US30 Under Pressure! SELL!
My dear followers,
I analysed this chart on US30 and concluded the following:
The market is trading on 46.226 pivot level.
Bias - Bearish
Technical Indicators: Both Super Trend & Pivot HL indicate a highly probable Bearish continuation.
Target - 45.961
Safe Stop Loss - 46.378
About Used Indicators:
A super-trend indicator is plotted on either above or below the closing price to signal a buy or sell. The indicator changes color, based on whether or not you should be buying. If the super-trend indicator moves below the closing price, the indicator turns green, and it signals an entry point or points to buy.
Disclosure: I am part of Trade Nation's Influencer program and receive a monthly fee for using their TradingView charts in my analysis.
———————————
WISH YOU ALL LUCK

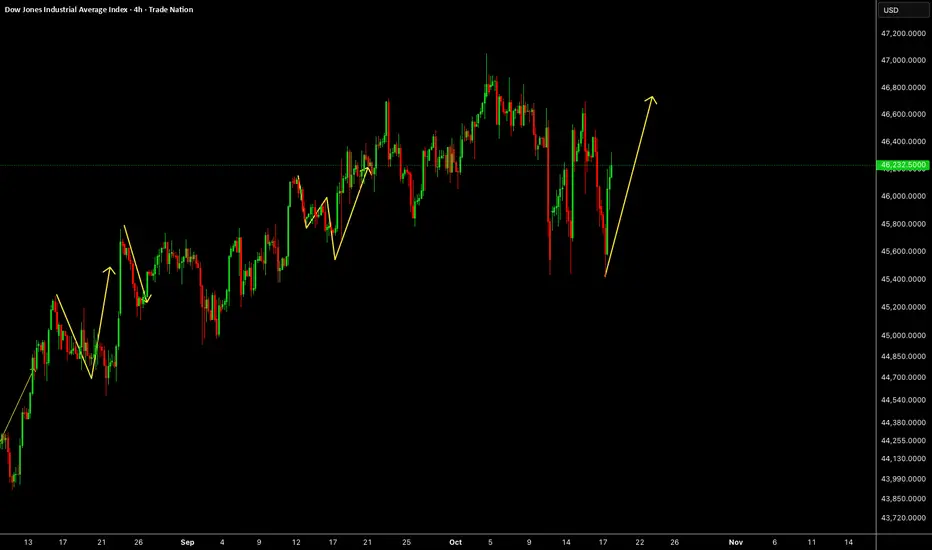
US30US30 still have some upside, correction and one more push up is possible in this week.
Disclosure: We are part of Trade Nation's Influencer program and receive a monthly fee for using their TradingView charts in our analysis.
Silver is now at its SUPER CRE line. Silver is now at its SUPER CRE line.
If this is truly the breakdown line where US equities enter a decade long slumber, then expect a reaction here.
Valid trend lines require 3 reactions.
It won't be pretty, but on the onset, we will have one of the greatest bull eras EVER!

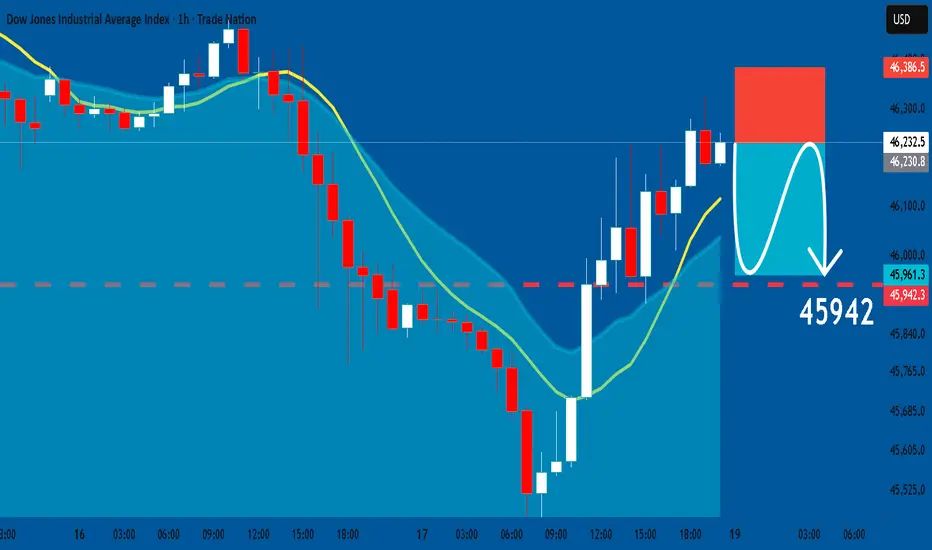
US30: Short Trade Explained
US30
- Classic bearish pattern
- Our team expects retracement
SUGGESTED TRADE:
Swing Trade
Sell US30
Entry - 46232
Stop - 46386
Take - 45943
Our Risk - 1%
Start protection of your profits from lower levels
Disclosure: I am part of Trade Nation's Influencer program and receive a monthly fee for using their TradingView charts in my analysis.
❤️ Please, support our work with like & comment! ❤️
US30 (DJI) Technical Forecast: Navigating Critical JunctureThe US30 consolidates near a significant technical inflection point at 46,233.8 . Our multi-timeframe analysis reveals a battle between bullish structure and emerging bearish divergences.
📊 Multi-Timeframe Synthesis & Market Structure
Daily (Trend Bias): The primary trend remains bullish above the key support confluence of 4 5,800 (50 EMA & Rising Trendline). However, price is testing the lower boundary of a bullish channel. A break below 45,800 would signal a deeper correction towards 45,200.
4H & 1H (Swing Setup): The index is forming a potential Bearish Rising Wedge . RSI on the 4H chart shows a clear bearish divergence, indicating weakening momentum. This is a cautionary sign for swing bulls.
Intraday (15M/5M - Precision): Price is trapped between immediate resistance at 46,450 and support at 46,100. The 5M chart shows Anchored VWAP (from yesterday's low) acting as dynamic resistance. A break below 46,100 targets 45,950.
🧠 Key Technical Narratives & Theories
Elliott Wave & Wyckoff: The pullback from the recent high exhibits characteristics of a Wave 4 correction or a Wyckoffian re-distribution phase. Volume analysis on breakdowns will be key.
Gann Angle & Square of 9: Critical Gann support resides near 45,950-46,000. A decisive break below this zone opens the path for a move towards the next Gann square level near 45,500.
Ichimoku Cloud: On the 4H, price is hovering above the Kumo (cloud). The Tenkan-Sen (red line) is flat, indicating short-term equilibrium. A break below the cloud would be a strong bearish trigger.
⚖️ Momentum & Volume Assessment
RSI (14): Reading of 52 on the 1D, neutral but leaning bearish on lower timeframes with divergences.
Bollinger Bands (20): Price is pressing the middle band (20 SMA). A sustained break below it often signals a shift to a short-term bearish phase.
Anchored VWAP & Volume: Recent up-moves have occurred on declining volume, suggesting a lack of strong bullish conviction—a potential bull trap formation.
🛠️ Trade Plan & Levels
Swing Short Idea: Consider shorts on a break & close below 46,100 (15M), targeting 45,800 and 45,500. Stop loss above 46,550.
Intraday Long Idea: Only above 46,450 (with volume), targeting 46,700. Stop loss below 46,300.
Intraday Short Idea: On a rejection from 46,450 or break of 46,100, targeting 45,950.
💡 The Bottom Line
The US30 is at a critical decision point. The bullish trend is under threat until price reclaims 46,700. The weight of evidence from divergences and pattern formation favors a bearish breakdown in the short term. Risk is elevated; position size accordingly.
Disclaimer: This is technical analysis, not financial advice. Trade at your own risk.
Us30 Idea - Monday 20-10-2025US30 ANALYSIS
Supply - Red areas
Demand - Green areas
LVN (Low volume nodes) - Grey areas
H1 TIME FRAME
We are currently ranging in a 1hr Bearish PD array with price currently in the premium area (selling)- We have also swept External BSL. On the 5min TF we have swept a triple top into a previous LVN 46262. On the 5 min we have double bottom at 45865 holding SSL. demand also lies below this internal SSL as well as a minor demand area (45814) below it. A low volume node for the current bullish leg also lies in the demand area. We can expect one of 3 Scenarios.
Scenario 1.
We inverse the current 1 hr bullish fvg and sell to the SSL (45870) further to the LVN 45781. Thereafter we buy.
Scenario 2.
We inverse the current 1 hr bullish fvg and sell to the SSL (45870) further to the LVN 45781 and even further to 45540.
Scenario 3.
We respect the 1 hr FVG. Claim the LVN 46265 for a bullish run to 46485.
MAJOR DEMAND - 45542
MAJOR SUPPLY - 46485
LTF IQUIDITY
45865 - SSL
Most Likely Scenario.
Considering Daily Po3. Friday closed bullish. We can expect the new candle to print bullish as well (OLHC). This means we can see London Manipulate into the demand area and LVN as in Scenario 2, to then target the supply area at 46485.
Trading a range can sometime be tricky, hence we have to monitor positions at lower TF key levels until we break through major supply or major demand.

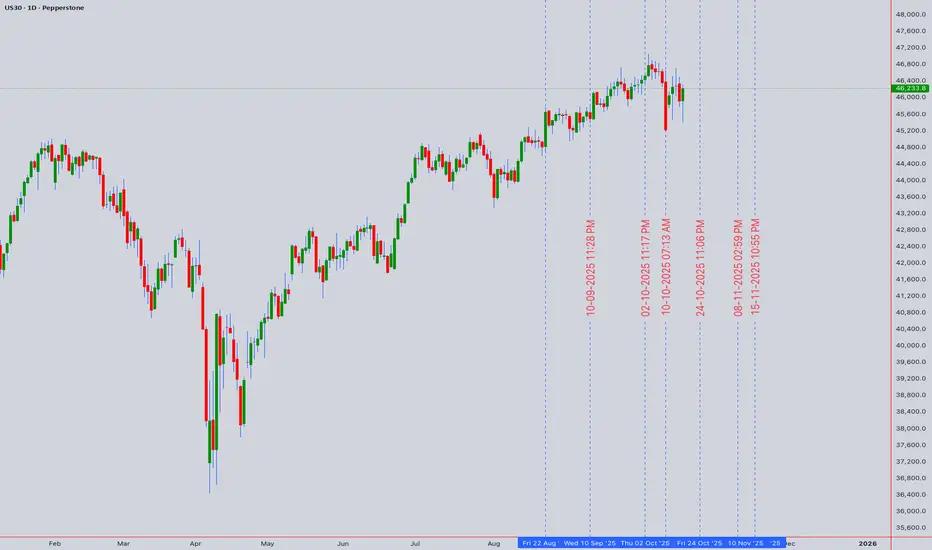
The next market crash is nearhello everyone, its been some time since i last posted but i want to post a market update and warn investors/ traders around the world about a near market correction/recession.
for some months already we have seen markets hit ATH back to back showing great market strength and a very bullish trend. i do think this will continue for a bit of time or continue into a range before having a final pump up to another ATH as shown in the charts below.
first i will start off with the patterns that was seen before the 2008 recession.
as we see in the chart from 2008 we enter what i call "the final range" here is where we see markets ranging right at all time high or near it right after a strong bullish movement. after this range we can see markets enter the "final pump up" zone where we see the markets give off the final movement up which usually is the strongest move out of any previous movement in this cycle. typically when you see a market pump up the last candle before a strong sell off is usually a strong pump up.
now looking at these patterns from 2008 we will see how similar the compare to the ones from 2020.
this chart from 2020 we can see a similar pattern forming like we did in 2008.
first we enter that ranging zone near all time highs for a bit of time before entering into a not very strong push up but it did break this zone giving us new all time highs. after that we enter into a sell off phase.
now looking back at these two instances we will look at how they compare to todays market and what we can expect in the upcoming months/ years.
looking at todays market we can see markets are right about all time highs but due to it reaching a important fib level i do think that it is perfect set up for the market to start ranging in this zone as we saw near the 1.68 fib level. here is where i think we will see the final range before we get a final pump up.
taking a fractal back from around 2018-2019 and placing it on the patterns forming in todays market as we see below:
here we can see how similar the fractal and todays market look. i think this is a very important confirmation supporting my claims.
that being said that is not the only thing supporting my idea. next i will show you the yield inversions and what patterns are forming and what they all had in common before a market crash.
in this chart we see the 10 year 2 year yield curve chart. now this chart is very important because before any major crash/ recession usually we see a inversion between these two.
markets don't usually correct right after it inverts but looking at the chart we can see that once it reaches .7-1.0% that is usually when the market tops off and the start of the recession starts.
we seen this happen in 1990, 2001, 2008, 2020, and now present day we see it coming real close to those levels right after a inversion meaning we could be soon see a market recession coming extremely soon after the final steps of this cycle are complete.
in my personal opinion i think markets could reach levels up to 50-60k before selling off but after that i do think a significant market crash will occur.

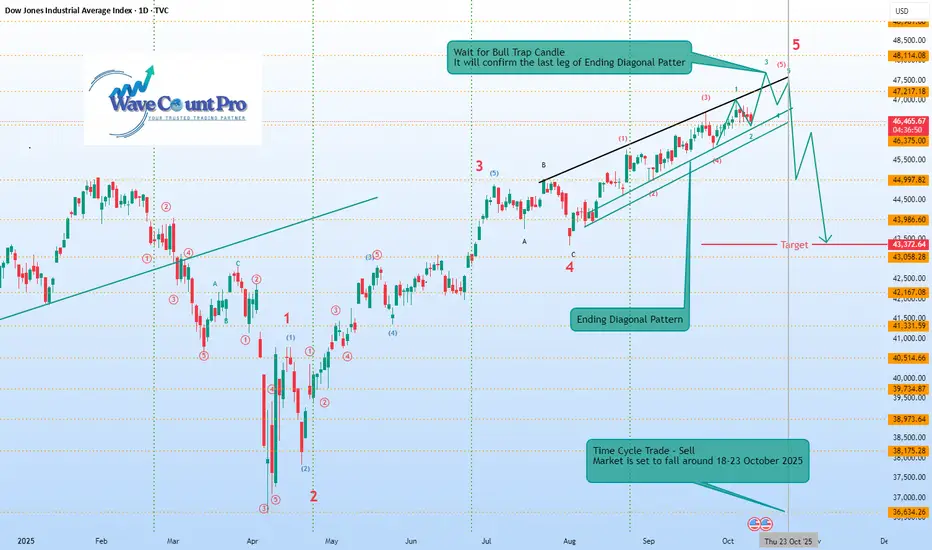
US30 all set to fall 5% starting 18-23rd OctHere’s a summary of the chart you provided:
Index: Dow Jones Industrial Average (DJIA), Daily timeframe (2025).
Pattern: Ending Diagonal Pattern forming in Wave 5.
Wave Count:
Major impulse structure labeled 1–5, with sub-waves marked inside the Ending Diagonal.
Current move is in the final 5th wave, nearing completion.
Key Message:
A Bull Trap Candle is expected — it will confirm the final leg of the Ending Diagonal.
After that, a sharp correction (sell-off) is anticipated.
Target Zone: Around 43,372–43,058.
Time Cycle Note:
A Time Cycle Trade (Sell) is suggested.
Market is projected to fall between October 18–23, 2025.
In short, the chart forecasts the completion of an Ending Diagonal near 47,200–47,500 levels, followed by a significant downside move toward the 43,000 zone starting late October 2025.
US30: Strong Growth Ahead! Long!
My dear friends,
Today we will analyse US30 together☺️
The recent price action suggests a shift in mid-term momentum. A break above the current local range around 46,027.62 will confirm the new direction upwards with the target being the next key level of 46,265.81 and a reconvened placement of a stop-loss beyond the range.
❤️Sending you lots of Love and Hugs❤️

Dow oversold bounce back supported at 45379Key Support and Resistance Levels
Resistance Level 1: 46297
Resistance Level 2: 46485
Resistance Level 3: 46695
Support Level 1: 45379
Support Level 2: 45205
Support Level 3: 45030
This communication is for informational purposes only and should not be viewed as any form of recommendation as to a particular course of action or as investment advice. It is not intended as an offer or solicitation for the purchase or sale of any financial instrument or as an official confirmation of any transaction. Opinions, estimates and assumptions expressed herein are made as of the date of this communication and are subject to change without notice. This communication has been prepared based upon information, including market prices, data and other information, believed to be reliable; however, Trade Nation does not warrant its completeness or accuracy. All market prices and market data contained in or attached to this communication are indicative and subject to change without notice.

Us30 Trade Set Up Oct 17 2025Im overall still bearish so if we get a BOS of the 15m high i will expect price to target 4h FVG before continuing down to SSL levels or i would want to see price close under 15m swing low to then continue down

US30 BuyLooking for a pull back to my zone for a possible buy. Adjust your stop loss accordingly as sometimes mine is too tifgt depends on your risk will see what happens

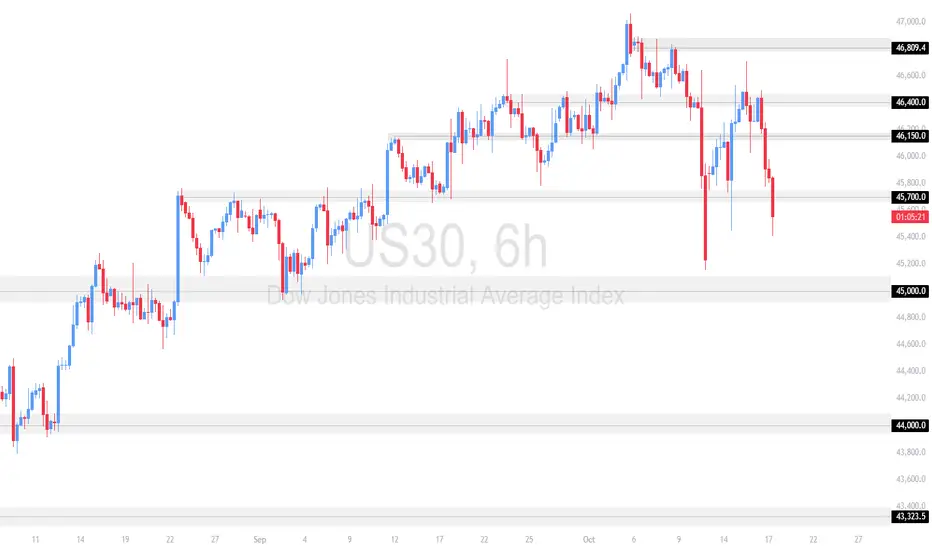
US30 Breaks Key Support – Bears Take Full Control!Price has broken below the 45,700.00 zone, confirming bearish pressure after multiple rejections from the 46,400.00 resistance area. This breakdown shows that sellers remain in control, pushing the index lower as buyers fail to defend key structure levels.
Support at: 45,000.00 🔽 / 44,000.00 🔽 / 43,323.50 🔽
Resistance at: 45,700.00 🔼 / 46,150.00 🔼 / 46,400.00 🔼 / 46,809.40 🔼
🔎 Bias:
🔽 Bearish: As long as price stays below 45,700.00, momentum favors a continuation toward 45,000.00 and potentially 44,000.00 next.
🔼 Bullish: A decisive recovery above 46,150.00 would signal renewed buying interest and shift focus back to 46,400.00–46,809.40.
📛 Disclaimer: This is not financial advice. Trade at your own risk.