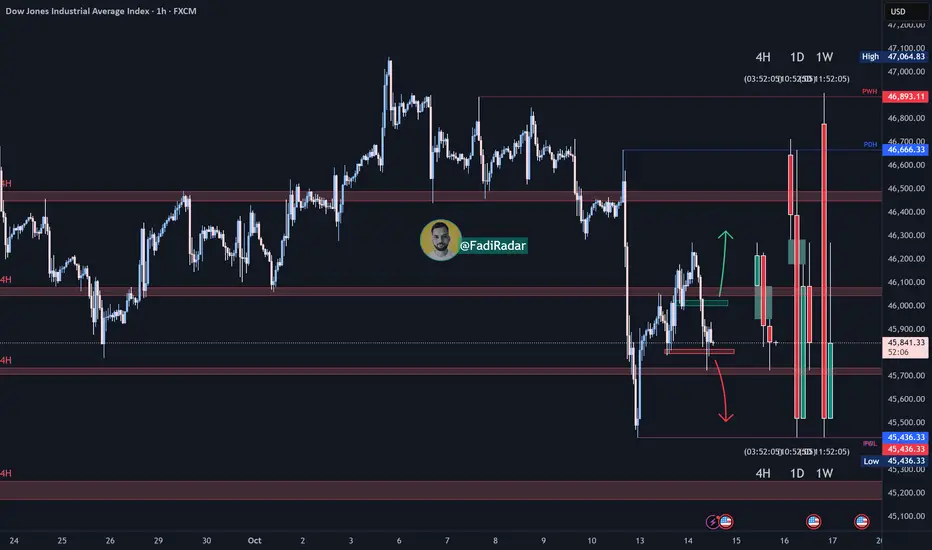
US30 : BULLISH PATTERNI am going to wait until it mitigate my continuation demand area ... And HoLD !
I will see how it goes . Happi Trading
Trade ideas
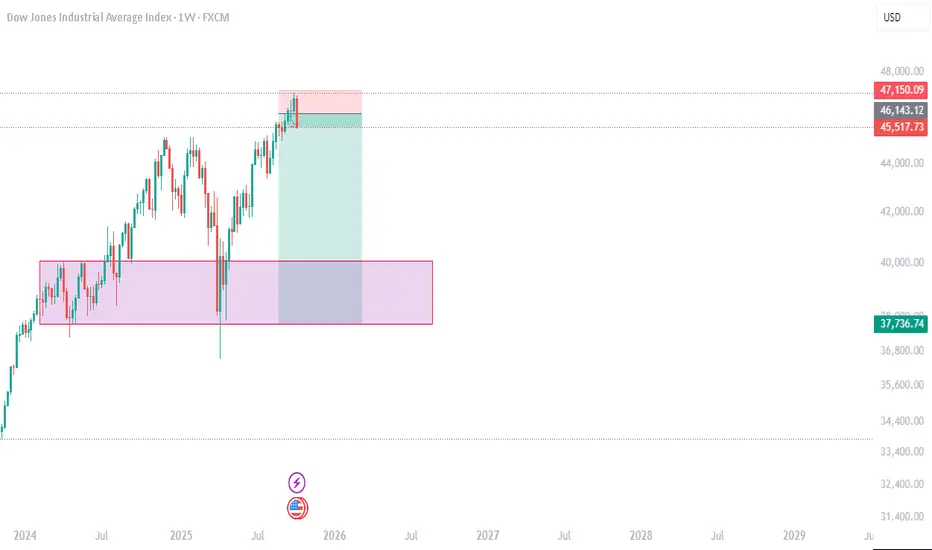
US30: Key support breakdown signals potential sell opportunity
1. Current Market Overview 🌐
The SPREADEX:DJI index is approaching a significant resistance zone where selling pressure is expected to be strong. The price is currently consolidating and moving sideways around this area, preparing for a major move.
2. Technical Signals and Momentum Indicators 📊
Momentum indicators such as MFI, RSI, and Stochastic have all entered the oversold territory, while also showing signs of price compression (consolidation), indicating the market is waiting for the next breakout.
The strong resistance zone and the Overbought/Overextended (OB/OS) signals suggest that buying pressure is weakening, which is favorable for sellers.
3. Sell Scenario on Key Support Breakdown 🔻
If the price breaks below the important Key Support level shown on the chart, this will confirm the beginning of a downtrend.
Traders can consider opening sell positions as soon as the breakout occurs to take advantage of the downward momentum.
The price target is expected to move toward lower support zones where buying interest may emerge to cause a price correction.
4. Risk Management ⚠️
Place stop-loss orders above the resistance zone or the nearest recent highs to protect against unexpected market moves.
Adjust your position size according to your risk tolerance.
5. Conclusion 🔑
The sell setup on US30 is very clear with a strong resistance zone and momentum signals indicating a potential upcoming downtrend.
Main scenario: Breaking the Key Support will trigger a strong decline, providing a profitable trading opportunity for sellers.
Wait for a confirmed support break before entering the trade to ensure safety and effectiveness.
Please like and comment below to support our traders. Your reactions will motivate us to do more analysis in the future 🙏✨
Harry Andrew @ ZuperView
US30 Trade Plan – Range Breakout + Smart Money ManipulationI’m currently watching the US30 (Dow Jones Index) 🏦. On the 4-hour timeframe, we can see a strong uptrend forming — higher highs and higher lows 📈. Whether this trend continues remains to be seen, but having a solid trading plan is key ✅.
Here’s mine: On the 30-minute timeframe, price is currently moving within a defined range. If we see a break above the range, followed by a retracement and failed retest of the range high, I’ll be looking for a long opportunity 🚀.
If price instead breaks below the range, there could also be a short opportunity, though my preference is to stay long given the higher-timeframe bullish structure ⚙️.
⚠️ Keep an eye out for market manipulation — smart money algorithms often trigger fake breakouts to draw in buyers before sweeping liquidity and continuing the move. Stay alert and manage risk carefully.
📉 Disclaimer: This content is for educational purposes only and not financial advice.

Liquidity Sweep + PRZ = The Perfect Setup? Dow Jones Outlook🔹 Multi–Timeframe Liquidity & PRZ Analysis
Welcome traders! 👋
I’m glad to have you here — we’re all learning and growing together in this amazing trading journey.
Let’s dive into today’s analysis on DJI 👇
Today, we’ll break down the Dow Jones setup step-by-step — identifying where liquidity sits and what the institutions might be planning next.
📊 On the weekly timeframe, the Dow Jones Index remains in a strong bullish trend.
However, on the daily timeframe, we can clearly see a bearish correction phase taking place.
Yesterday, price collected buy-side liquidity from the upper zones and then started a sharp downward move.
🧩 H4 Timeframe
On the 4-hour chart, price is currently approaching a Potential Reversal Zone (PRZ) — an area where several key confluences align:
🟢 1H Breaker Block
🟣 Imbalance Zone
🔵 50% of the Daily Candle Shadow
This confluence area makes the zone highly significant for potential reactions.
🎯 My Scenarios for Dow Jones:
📉 Scenario 1:
After tapping into the PRZ and forming a confirmation signal on lower timeframes (M15–M5), price may start a downward move.
This move could happen during the London Session, after sweeping the Asian high, or during the New York Session following a liquidity grab above.
📉 Scenario 2:
Alternatively, price may start dropping without fully reaching the PRZ.
In that case, if we see lower highs and lower lows forming on the 1H or 4H, we can take an entry after confirmation.
🎯 The main target would be the liquidity below the double-bottom area.
⚠️ Important Note:
No analysis is 100% certain — always wait for clear confirmations before entry, manage your risk, and stay aware of market news.
💬 I’d love to hear your thoughts 👇
Do you think Dow Jones will drop from here or go for one more liquidity grab above?
📘 Educational Note:
This analysis is for educational and illustrative purposes only.
Always follow your own plan, confirm with your strategy, and manage risk carefully.
Success in trading comes from discipline, patience, and consistency. 💪
🚀 Empowering traders through clarity, confidence & clean charts.
Follow 👉 @parisa_tl for more SMC setups and weekly insights 💙
#DowJones #DJI
Midnight SeekerI doubt there will be a downward manipulative move before an initial one, what do you see?

US30 – Crab Completion and RetracementTimeframe: 1H
Pattern: Bullish Crab
Instrument:US30
The current 1H structure reveals a Bullish Crab pattern completing near the 45,710 region, aligning with the 3.14 BC projection and 1.618 XA extension. Following the completion of this harmonic leg, price reacted strongly from the terminal zone, establishing a potential reversal base.
Price has since retraced toward the 46,300–46,400 zone, where short-term consolidation is evident. The current setup presents an opportunity for a continuation toward 46,650–46,700 (Target Zone 1), while maintaining bullish structure above 45,770 (key reaction point).
A sustained break below 45,526 (H1 invalidation zone) would negate the pattern’s bullish outlook and suggest deeper downside continuation toward 45,300.
Key Levels:
Entry Zone: 46,200–46,300
Target: 46,650–46,700 (T1)
Stop-Loss: 45,526
Risk/Reward Ratio: 3.4R
Bias: Bullish short-term retracement within harmonic reversal zone
Invalidation: 45,526 (H1 structure break)


Can Dow Jones Maintain Bullish Momentum? Analysis🎯 US30 Dow Jones: The Great Heist Setup! 🏦💰
📊 Asset Overview
US30 (Dow Jones Industrial Average) - CFD Index
Trade Type: Swing/Day Trade
Bias: BULLISH 🐂
🔍 The Master Plan: Double Moving Average Confirmation
We're hunting for a pullback retest at two critical moving averages acting as dynamic support:
✅ Simple Moving Average (SMA) alignment
✅ Kijun-Sen (Ichimoku baseline) confluence
This double confirmation gives us the green light to ride the bullish trend with institutional-level precision. Think of it as the market leaving the vault door slightly open... 🚪💎
🎯 Entry Strategy: The "Thief Layering" Method
Primary Approach: Multiple Buy Limit Orders (Layering Strategy)
Recommended Layer Entry Zones:
🟢 Layer 1: 46,000
🟢 Layer 2: 46,200
🟢 Layer 3: 46,400
💡 Pro Tip: You can add more layers based on your risk appetite and position sizing. This strategy allows you to average into the position as price pulls back to support—like catching falling diamonds! 💎
Alternative: Market execution at any pullback to the moving average confluence zone.
🛡️ Risk Management
Stop Loss: 45,600
⚠️ Important: This is MY stop loss level based on technical invalidation. You're the captain of your own ship—adjust according to YOUR risk tolerance and account size. Trade at your own risk!
🎯 Target Zone: The Police Barricade
Take Profit Target: 47,600 🚨
This level represents:
🚧 Strong resistance zone (the "Police Barricade")
📈 Potential overbought conditions
Bull trap territory
Strategy: Scale out or secure profits as we approach this level. Remember: realized profits are better than paper gains!
⚠️ Reminder: This is MY take profit target. Your exit strategy should align with your trading plan and risk management rules. Lock in profits when YOU'RE comfortable!
🌐 Correlated Assets to Watch
Keep an eye on these related instruments for confluence:
SP:SPX (S&P 500): Broad market sentiment indicator—if SPX shows strength, US30 typically follows
SEED_ALEXDRAYM_SHORTINTEREST2:NQ (Nasdaq 100): Tech-heavy index correlation—risk-on appetite confirmation
TVC:DXY (US Dollar Index): Inverse correlation—weaker dollar often supports equity indices
TVC:TNX (10-Year Treasury Yield): Rate sensitivity—lower yields can fuel equity rallies
TVC:VIX (Volatility Index): Fear gauge—declining VIX supports bullish setups
Key Correlation Note: When these indices move in harmony with declining dollar strength, it strengthens the bullish case for US30. Watch for synchronized moves!
📝 Technical Summary
Trend: Bullish structure intact
Confirmation: Dual moving average support
Risk/Reward: Favorable with 400-1,600 point profit potential (depending on entry layer)
Time Frame: Swing to day trade duration
Strategy Style: "Thief layering" - accumulate on pullbacks
✨ If you find value in my analysis, a 👍 and 🚀 boost is much appreciated — it helps me share more setups with the community!
⚠️ Disclaimer
This "Thief Style" trading strategy is shared for educational and entertainment purposes only. This is NOT financial advice. Trading involves substantial risk of loss. Always conduct your own analysis, manage your risk appropriately, and never trade with money you cannot afford to lose. Past performance does not guarantee future results. You are solely responsible for your trading decisions.
#US30 #DowJones #SwingTrading #DayTrading #TechnicalAnalysis #MovingAverages #LayeringStrategy #IndexTrading #BullishSetup #TradingStrategy #CFDTrading #PriceAction #SupportAndResistance #TradingIdeas #MarketAnalysis #ThiefStyle

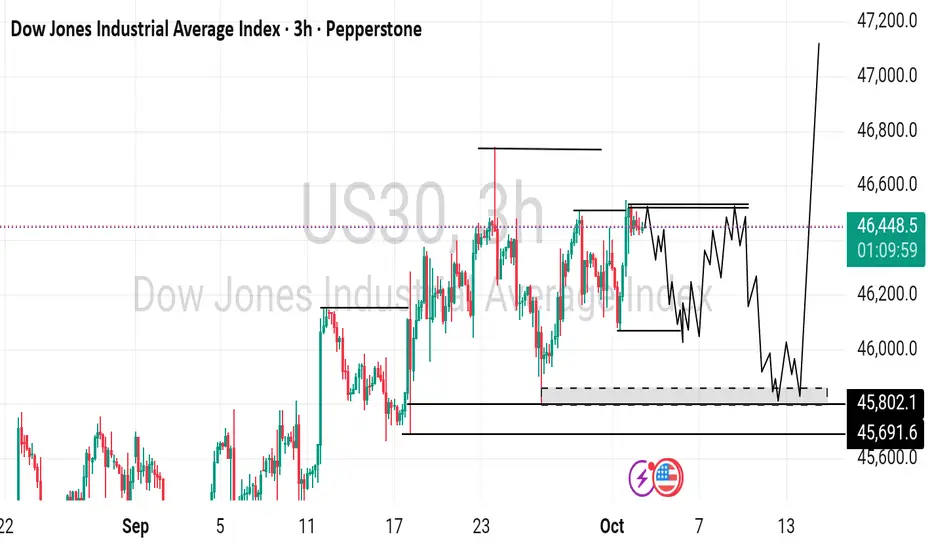
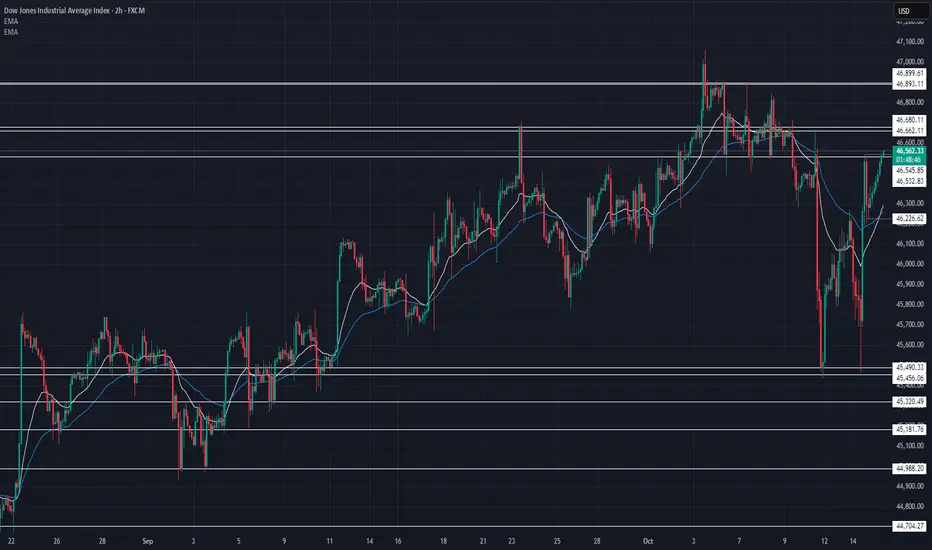
US30 Technical Breakdown – 10/15/2025📍 US30 Technical Breakdown – 10/15/2025
US30 bouncing strong from 45,600 support 🔥 — bulls pushing price back into a key resistance zone near 46,550–46,680. Momentum picking up but still under a heavy ceiling 💪📈
📊 Market Behavior:
🔹 Sharp recovery after double bottom around 45,600
🔹 EMAs turning bullish again after crossover
🔹 Price testing resistance — potential breakout or rejection zone
📌 Key Levels:
🔹 Resistance Zones:
46,545 → intraday resistance
46,662 → strong ceiling
46,680–46,900 → breakout area 🚀
🔹 Support Zones:
46,226 → short-term support
45,837 → mid-level demand
45,490 → deep pullback zone
🧠 Bias:
Bullish–Neutral 🟢
➡️ Above 46,680 → potential breakout toward 46,900
⬅️ Below 46,220 → possible retrace to 45,800
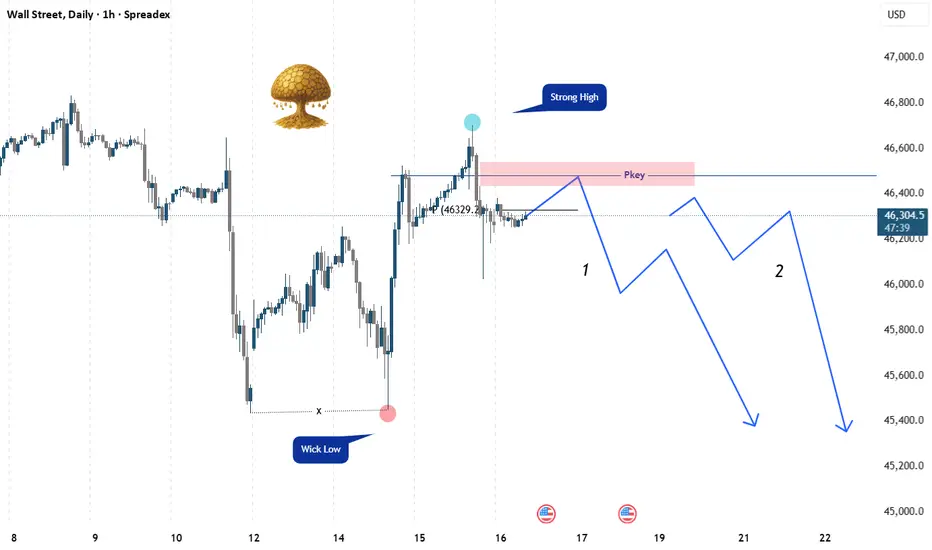
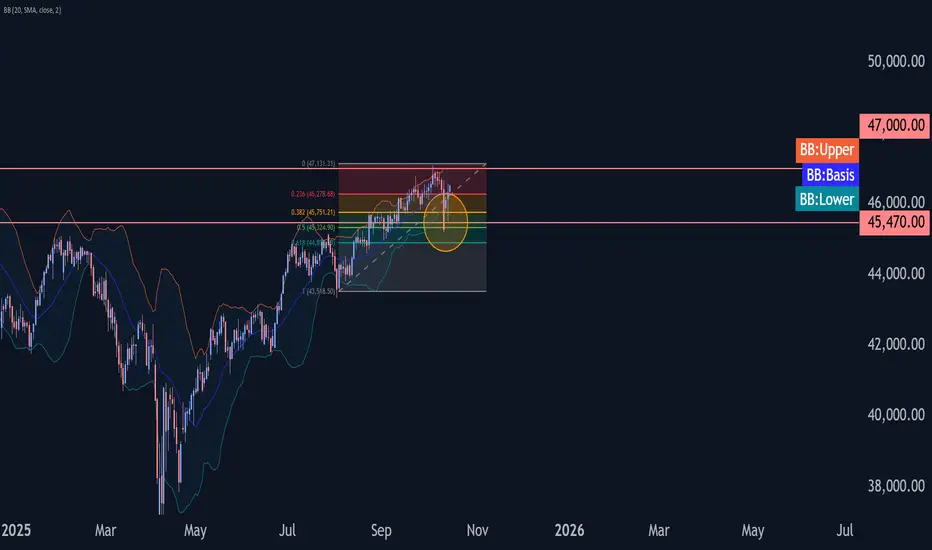
Dow Jones Wave Analysis – 15 October 2025
- Dow Jones reversed from support zone
- Likely to rise to resistance level 47000.00
Dow Jones index recently reversed up from the support zone between the key support level 45470.00 (former resistance from August), lower daily Bollinger Band and the 38.2% Fibonacci correction of the upward impulse from August.
The upward reversal from this support zone created the daily reversal pattern Hammer, which stopped earlier correction ii.
Given the strong daily uptrend, Dow Jones index can be expected to rise further to the next resistance level 47000.00 (which stopped earlier impulse wave i).
US30 LONGThis is what im looking for in NY session waiting for a candlestick engulfing or pin bar or any bullish rejection form the zone to the upsisde. This is base of the 4hr time frame analysis

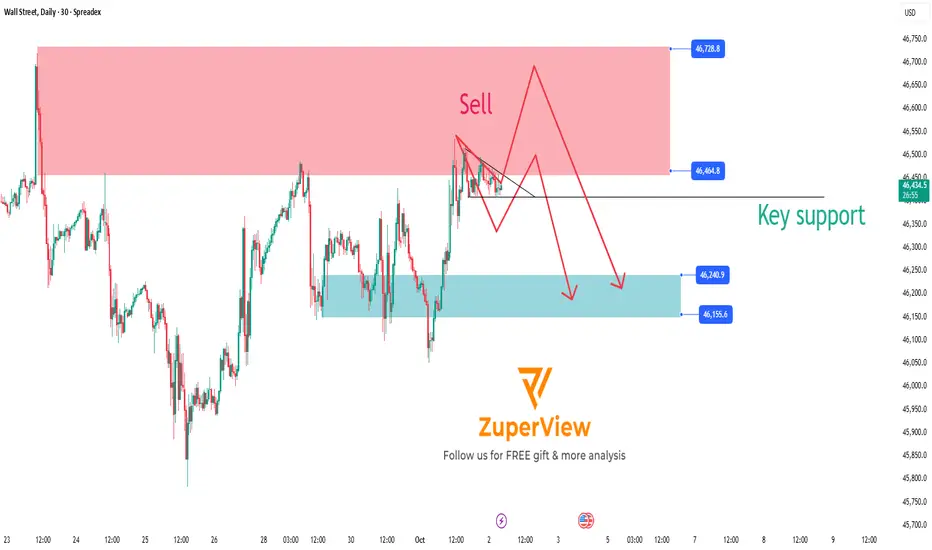
Dow Jones (US30) Analysis:The Dow Jones Index is heading toward a key resistance level at 46,550.
🔻 If the price rejects this level, it is likely to retrace back to test support at 46,250, and a break below this support could resume the bearish trend.
🔺 However, if the index breaks and holds above 46,550, this could push the price higher toward 46,700 as the first target.
📈 Best Buy Zone: After confirming a breakout above 46,550
📉 Best Sell Zone: On rejection from 46,550 or a confirmed break below 46,250
check the trendIt is expected that a trend change will form in the current resistance range and we will witness the beginning of a downward trend.
As long as the index does not stabilize above the resistance range, the continuation of the downward trend and correction will be likely.
US30 (Dow Jones) Trade UpdateTimeframe: 4-hour
Current Price: 46,385.40
Key Levels:
Resistance: 46,493 (watch for a breakout and retest for potential buy setups)
Support: 45,705.02 (watch for a breakdown and retest for potential sell setups)
Strategy:
If 46,493 is broken and price retests, I will look to add buy positions for a potential move higher, targeting resistance around 47,000.
If price fails to break above this level and breaks support at 45,705.02, I will look for sell setups on the retest, targeting lower support levels around 45,210.

MARKET RECAP-FED CHAIR POWELL SPEAKS_DOW JONES_RF+NEWS10-14-25-News-Daily Recap-Market opened up on Sunday 12, 2025. Market gapped. initally expecting gap to fill later in the week. But the market filled gap Tuesday 10/14/25/ Traded to the buyside, into higher timeframe (Daily) small FVG. Expecting some sell off, then retracement higher. News Thursday Core PPI.

Breaks Above 46,400.00 as Bulls Extend RecoveryUS30 has pushed decisively above 46,400.00, confirming strong buyer momentum after last week’s deep correction. This breakout shifts short-term sentiment firmly bullish, with price now eyeing the next resistance at 46,809.40.
Support at: 46,400.00 🔽 46,150.00 🔽
Resistance at: 46,809.40 🔼 47,000.00 🔼
🔎 Bias:
🔼 Bullish: Momentum remains with buyers while price holds above 46,400.00. A sustained move could target 46,809.40, and a break above that opens the path to 47,000.00.
🔽 Bearish: Only a drop back below 46,400.00 would weaken the current momentum and expose 46,150.00 as the next test for buyers.
📛 Disclaimer: This is not financial advice. Trade at your own risk.


Dow Jones (US30) Analysis:The Dow Jones index is seeing a decline today, currently trading near the support zone at 45,800.
🔻 If 45,800 breaks and holds below, the price is likely to retest the previous low at 45,430.
🔺 However, if the index rebounds from the current support zone, it may rise toward 46,000 initially, and a breakout above this resistance could push it further to 46,300.
📉 Best Sell Zone: Below 45,800 (after confirmation)
📈 Best Buy Zone: Upon rebound from 45,430
Us30 Bearish forminglets see if Us30 resists our recent low.. After all its thr third day US Goverment shutdown.

Us30 Trade Set Up Oct 13 2025Overall price is still bearish but today i can see price sweeping SSL, touching 50% of the 1h Gap and targeting the 4h FVG before continuing its bearish trend

There is initial projected support for Monday at 45362 and 45154This channel is not providing individualized trading or investment advice, nor is it a banking service, brokerage service, trading service, investment service or money management service

US30The Dow Jones (US30) has experienced a strong bearish move, breaking below recent consolidation levels. Currently, price is testing a key demand zone around 45,263 – 45,206, where a potential short-term reversal may occur if buyers step in.
Key Reversal Zones:
🔹 45,686.9 – Possible first reaction zone / intraday support.
🔹 46,178.6 – First bullish target if a rebound occurs.
🔹 46,769.8 – 46,996.3 – Major resistance / key reversal area to watch for rejection or continuation.
As long as the price holds above 45,200, we could see a relief rally toward the upper resistance zones. A breakdown below this level could open the way to deeper bearish continuation.
📈 Bias: Short-term bullish correction within a larger bearish structure.
🕓 Timeframe: 4H

US30 Analysis (Short Bias)Market structure continues to respect the bearish outlook. After multiple rejections near the upper resistance zone, momentum has clearly shifted in favor of sellers. I’ve been anticipating this short move for a while, and it’s finally playing out as expected.
Last week’s price action toyed with my analysis, showing temporary bullish strength, but this week is confirming the setup for a deeper correction. The short is finally coming true after a long wait and has almost reached the target. The prediction was right.