US30 Price a Bullish strong reboundThe US30 Industrial Average is consolidating near a key demand zone around 46,000, holding above a broad support region after a recent corrective drop. Price is showing early signs of accumulation, with potential scenarios mapped clearly:
US30 prices continue to hold a bullish momentum, with U.S. e

WARNING! 22 States Already In Recession.What the map is actually saying
This map claims that as of October 2025, 22 states are either:
Already in recession (red)
At high risk of recession (also red)
“Treading water” (yellow — basically flat growth)
Only the green states are shown as still expanding.
What this really means
This is a

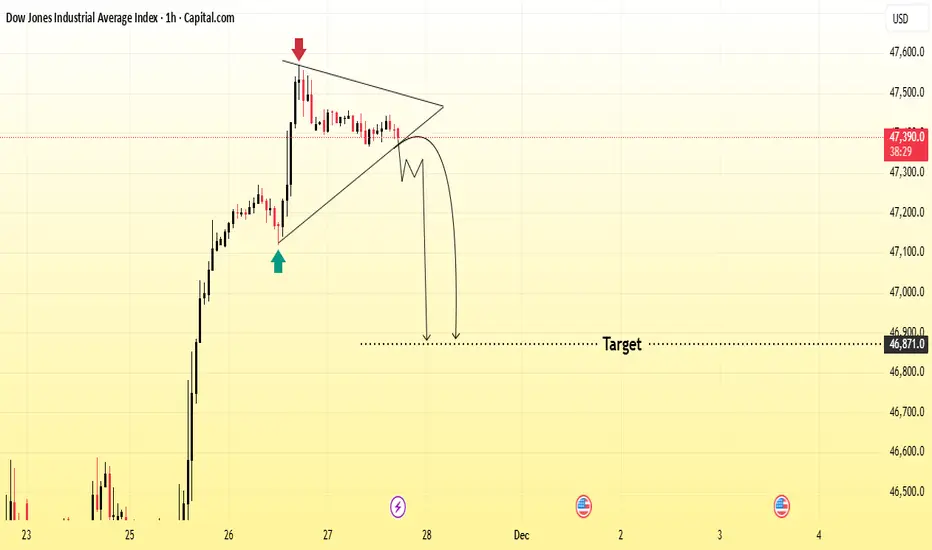
US30 Next Symmetrical Triangle Rejection AnalysisPrice is forming a symmetrical triangle after a strong bullish move. The chart shows rejection from the top (red arrow) and a possible breakdown from the triangle pattern.
If price breaks below the lower trendline, it may drop toward the marked target zone around 46,800–46,600.
Bias: Bearish below
Head & Shoulder forming to drive US30 downI trade support and resistance levels drawn from line charts and watch price action at these level depending on market direction with other confluence such as EMA,SMA,RSI and simple candle stick patterns.
Market is current bearish with minor pull back from previous drop, currently accumulating and

Us301. Higher Timeframe Bias (HTF)
Check these 4 only:
• Monthly → Bullish or Bearish?
• Weekly → Bullish or Bearish?
• Daily → Bullish or Bearish?
• 4H → Bullish or Bearish?
👉 Only trade in the direction where most timeframes agree.
⸻
2. 15-Minute Structure
• Did the 15m break structure (BOS)

US30: Rebound Extends as Markets Eye December Rate CutUS30 | Technical Overview
U.S. indices look ready to extend Friday’s strong rebound as investor sentiment improves, with markets increasingly expecting a Fed rate cut in December.
Meanwhile, geopolitical headlines continue to develop, as the U.S. and Ukraine work on a “refined peace framework” aim
DOW JONES Inverse Head and Shoulders formed. Bullish.Last week (November 19, see chart below), we caught the very bottom of the 6-month Channel Up on the 1D MA100 (green trend-line) of Dow Jones (DJI):
This time we view the price action using the 4H time-frame, where we can see that an Inverse Head and Shoulders has been formed, with its Head bei

US30 – Fake Breakout Reversal Toward 48,500 $From my market view the US30 made a fake breakout above my resistance zone
This liquidity grab trapped sellers before price quickly bounced back upward showing that buyers still control the trend
At this point I expect the market to continue pushing higher toward the 48500 $ which represents
As l

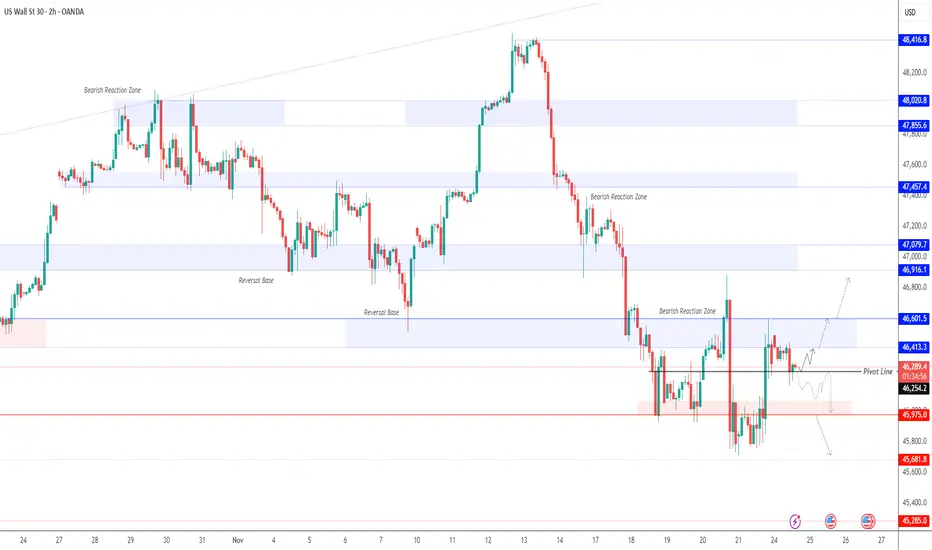
US30 BEARS ARE GAINING STRENGTH|SHORT
US30 SIGNAL
Trade Direction: short
Entry Level: 46,264.6
Target Level: 45,574.0
Stop Loss: 46,722.1
RISK PROFILE
Risk level: medium
Suggested risk: 1%
Timeframe: 4h
Disclosure: I am part of Trade Nation's Influencer program and receive a monthly fee for using their TradingView charts in my anal

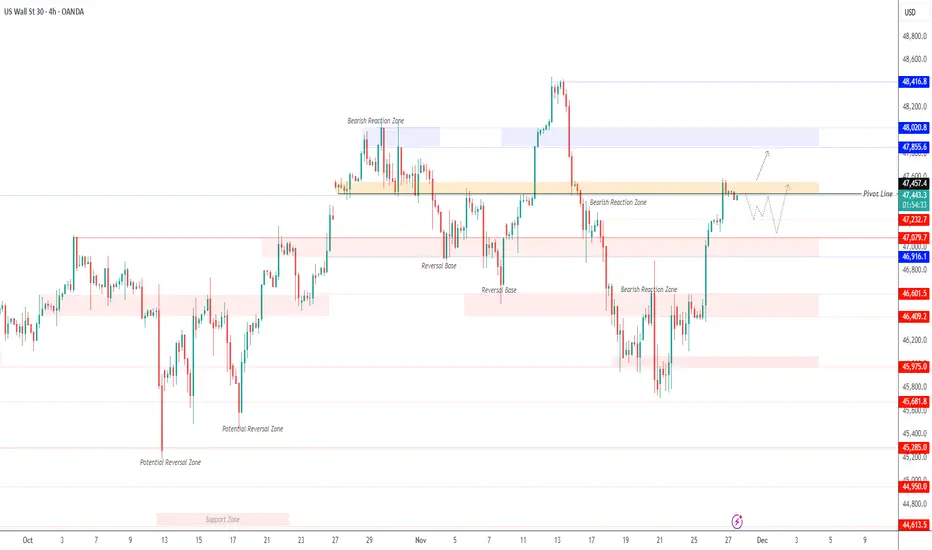
US30: Low Volatility Ahead — Watching 47460 for DirectionOANDA:US30USD pushed up exactly as expected—about 350 points.
Today and tomorrow are expected to remain low-volatility, low-liquidity sessions due to the Thanksgiving holiday in the U.S., which may limit strong directional moves.
Technical Outlook
As long as the price trades below 47460, US3
See all ideas
Displays a symbol's price movements over previous years to identify recurring trends.
Frequently Asked Questions
Dow Jones Industrial Average Index reached its highest quote on Nov 12, 2025 — 48,484.92 USD. See more data on the Dow Jones Industrial Average Index chart.
The lowest ever quote of Dow Jones Industrial Average Index is 6,469.95 USD. It was reached on May 31, 2007. See more data on the Dow Jones Industrial Average Index chart.
Dow Jones Industrial Average Index is just a number that lets you track performance of the instruments comprising the index, so you can't invest in it directly. But you can buy Dow Jones Industrial Average Index futures or funds or invest in its components.