FSLY: Going Higher!📊 Technical Analysis (TradingView Chart)
Current Price: $8.67
Key Levels:
Support zones: $8.18 – $8.44
Premium zone (short-term overextension): near $8.87–$9.07
Fibonacci extensions: $9.76 → $10.19 → $10.80 (likely upside targets)
Momentum: RSI ~63, above equilibrium but not overbought → bulli
Next report date
—
Report period
—
EPS estimate
—
Revenue estimate
—
−0.82 EUR
−152.68 M EUR
525.18 M EUR
133.88 M
About Fastly, Inc.
Sector
Industry
CEO
Charles Compton
Website
Headquarters
San Francisco
Founded
2011
ISIN
US31188V1008
FIGI
BBG00PPWKF46
Fastly, Inc. provides real-time content delivery network services. It offers edge compute, edge delivery, edge security, edge applications like load balancing and image optimization, video on demand, and managed edge delivery. The company was founded by Artur Bergman, Tyler McMullen, Simon Wistow, and Gil Penchina in March 2011 and is headquartered in San Francisco, CA.
Related stocks

FSLY: Volume cave in📊 NYSE:FSLY – Multi-Model Convergence
• WaverVanir DSS AI: Predicts +4.8% upside in 30 days → $8.91.
• Institutional Model: Neutral bias, HOLD zone. Target $8.83 (±1.2%) with 95% CI between $8.88–$10.23.
• Technical Setup: Weekly compression breakout forming after long base. Strong BOS (Break of
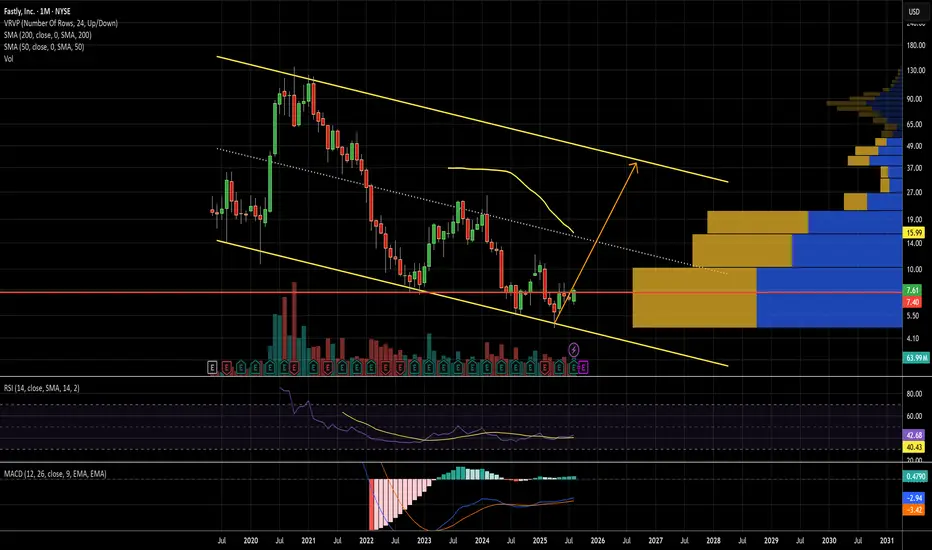
$fslyThis is the log chart. This keeps looking better and better. Only downside is the channel is descending would be even better an ascending one.
Good r vs r
$FSLYhmmm
1. volume shelf
2. broken techical resistance from Q4 last year, and retested as support
3. something is brewing that can make it fly to $10.

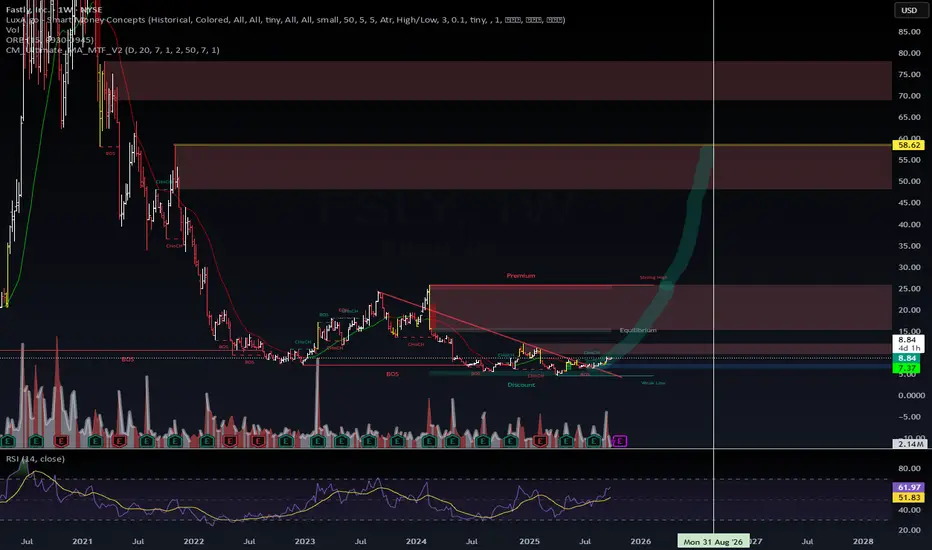
FSLY | Smart Money Concepts Outlook – Liquidity Unlock in ProgrePublished by: Wavervanir_International_LLC
Ticker: NYSE:FSLY
Timeframe: 1D
Bias: Moderately Bullish – Liquidity Hunt Confirmed
Strategy: Smart Money Concepts (SMC) + Fibonacci Confluence + Volume + ORB Break
📌 Technical Outlook:
Fastly, Inc. ( NYSE:FSLY ) is showing signs of institutional accumu

I like this setupPrice is doing an inverse HA over the 200MA that happens to cross through an important support level. First target 12, but I think is goin to 13.5. SL if the support is broken down with a daily candle.

Fastly Fills the GapWeb-acceleration company Fastly hit a record low over the summer, but now there could be signs of a rebound.
The first pattern on today’s chart is the bearish price gap in May after the release of weak guidance. FSLY is now pushing into that gap, which could make some traders see potential for more

Edge of Success!Fastly is gaining bullish momentum, with a gap forming around the $6.00 level. A breakout above the $8.00 resistance would signal further strength, positioning the stock to target the $13.66 weekly resistance. This setup offers an attractive risk-to-reward ratio, with a stop-loss at $5.66 to manage

$FSLY Recovering to Previous SupportAlso longed NYSE:FSLY this morning. Recovering to previous support.
Weekly RSI hovering around oversold.
If we can get a weekly close above $7.50, this should run to $11-13 minimum.
TP1: $13.71
TP2: $33.64

FSLY - JULY 24 MATrend Unsustainable Momentum- D1 larger trend is aligned to our bearish direction
- Gap is due to the 11 July Inflation report
- 15M, 20SMA exit
MATrend Unsustainable Momentum (Systematic) ⏪
The strategy identifies stocks (Tech sector ) that follows the larger market regime's momentum of the day and because they are unable to

See all ideas
Summarizing what the indicators are suggesting.
Neutral
SellBuy
Strong sellStrong buy
Strong sellSellNeutralBuyStrong buy
Neutral
SellBuy
Strong sellStrong buy
Strong sellSellNeutralBuyStrong buy
Neutral
SellBuy
Strong sellStrong buy
Strong sellSellNeutralBuyStrong buy
An aggregate view of professional's ratings.
Neutral
SellBuy
Strong sellStrong buy
Strong sellSellNeutralBuyStrong buy
Neutral
SellBuy
Strong sellStrong buy
Strong sellSellNeutralBuyStrong buy
Neutral
SellBuy
Strong sellStrong buy
Strong sellSellNeutralBuyStrong buy
Displays a symbol's price movements over previous years to identify recurring trends.
FSLY5954366
Fastly, Inc. 7.75% 01-JUN-2028Yield to maturity
—
Maturity date
Jun 1, 2028
FSLY5380146
Fastly, Inc. 0.0% 15-MAR-2026Yield to maturity
—
Maturity date
Mar 15, 2026
See all 2Y7 bonds
Curated watchlists where 2Y7 is featured.


Frequently Asked Questions
The current price of 2Y7 is 10.00 EUR — it has increased by 5.26% in the past 24 hours. Watch Fastly, Inc. Class A stock price performance more closely on the chart.
Depending on the exchange, the stock ticker may vary. For instance, on GETTEX exchange Fastly, Inc. Class A stocks are traded under the ticker 2Y7.
2Y7 stock has risen by 44.84% compared to the previous week, the month change is a 41.68% rise, over the last year Fastly, Inc. Class A has showed a 31.58% increase.
We've gathered analysts' opinions on Fastly, Inc. Class A future price: according to them, 2Y7 price has a max estimate of 11.26 EUR and a min estimate of 6.06 EUR. Watch 2Y7 chart and read a more detailed Fastly, Inc. Class A stock forecast: see what analysts think of Fastly, Inc. Class A and suggest that you do with its stocks.
2Y7 stock is 10.71% volatile and has beta coefficient of 1.74. Track Fastly, Inc. Class A stock price on the chart and check out the list of the most volatile stocks — is Fastly, Inc. Class A there?
Today Fastly, Inc. Class A has the market capitalization of 1.47 B, it has decreased by −1.46% over the last week.
Yes, you can track Fastly, Inc. Class A financials in yearly and quarterly reports right on TradingView.
Fastly, Inc. Class A is going to release the next earnings report on Feb 18, 2026. Keep track of upcoming events with our Earnings Calendar.
2Y7 earnings for the last quarter are 0.06 EUR per share, whereas the estimation was 0.00 EUR resulting in a 99.90 K% surprise. The estimated earnings for the next quarter are 0.04 EUR per share. See more details about Fastly, Inc. Class A earnings.
Fastly, Inc. Class A revenue for the last quarter amounts to 134.84 M EUR, despite the estimated figure of 128.71 M EUR. In the next quarter, revenue is expected to reach 138.90 M EUR.
2Y7 net income for the last quarter is −25.13 M EUR, while the quarter before that showed −31.87 M EUR of net income which accounts for 21.16% change. Track more Fastly, Inc. Class A financial stats to get the full picture.
No, 2Y7 doesn't pay any dividends to its shareholders. But don't worry, we've prepared a list of high-dividend stocks for you.
As of Nov 10, 2025, the company has 1.1 K employees. See our rating of the largest employees — is Fastly, Inc. Class A on this list?
EBITDA measures a company's operating performance, its growth signifies an improvement in the efficiency of a company. Fastly, Inc. Class A EBITDA is −33.26 M EUR, and current EBITDA margin is −11.37%. See more stats in Fastly, Inc. Class A financial statements.
Like other stocks, 2Y7 shares are traded on stock exchanges, e.g. Nasdaq, Nyse, Euronext, and the easiest way to buy them is through an online stock broker. To do this, you need to open an account and follow a broker's procedures, then start trading. You can trade Fastly, Inc. Class A stock right from TradingView charts — choose your broker and connect to your account.
Investing in stocks requires a comprehensive research: you should carefully study all the available data, e.g. company's financials, related news, and its technical analysis. So Fastly, Inc. Class A technincal analysis shows the strong buy rating today, and its 1 week rating is buy. Since market conditions are prone to changes, it's worth looking a bit further into the future — according to the 1 month rating Fastly, Inc. Class A stock shows the buy signal. See more of Fastly, Inc. Class A technicals for a more comprehensive analysis.
If you're still not sure, try looking for inspiration in our curated watchlists.
If you're still not sure, try looking for inspiration in our curated watchlists.