SOFI — Bullish Breakout with Strong VolumeSOFI has broken out to a new all-time high with strong volume, signaling strong buying pressure and renewed bullish momentum.
The stock remains in a clear uptrend, trading above the 50-day EMA. Recently, SOFI rebounded perfectly at the EMA 50, confirming it as a strong dynamic support zone. The bul
Next report date
—
Report period
—
EPS estimate
—
Revenue estimate
—
0.49 EUR
481.70 M EUR
3.64 B EUR
1.16 B
About SoFi Technologies, Inc.
Sector
Industry
CEO
Anthony J. Noto
Website
Headquarters
San Francisco
Founded
2011
ISIN
US83406F1021
FIGI
BBG0131V2V56
SoFi Technologies, Inc. is a financial service platform, which engages in the provision of student loan refinancing options to the private student loan market. It operates through the following segments: Lending, Technology Platform, and Financial Services. The Lending segment offers personal loans, student loans, home loan products, and related servicing activities. The Technology Platform segment focuses on technology products and solutions revenue. The Financial Services segment includes the SoFi Money product, SoFi Invest product, SoFi Credit Card product, SoFi Relay personal finance management product, and other financial services such as lead generation and content for other financial services institutions. The company was founded in 2011 and is headquartered in San Francisco, CA.
Related stocks

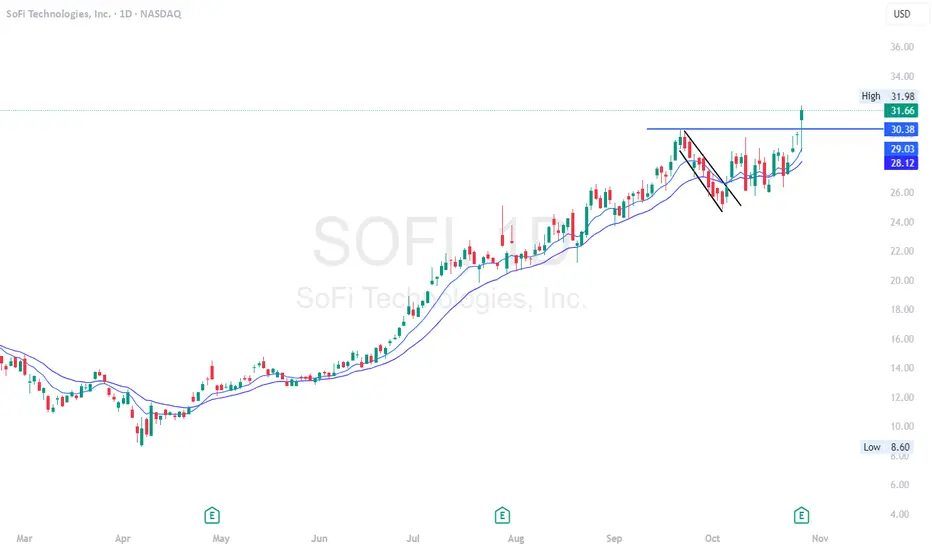
Buy when its still CHEAPClassic Cup-and-Handle Breakout NASDAQ:SOFI
The chart is showing a textbook cup-and-handle pattern, one of the strongest bullish continuation signals in technical analysis. SoFi pushed through years of long-term resistance with surging volume, then consolidated neatly at highs (the “handle”)—the

Breaking: SOFI Surges - Key Levels Signal Breakout Opportunity
Current Price: $29.68
Direction: LONG
Targets:
- T1 = $32.50
- T2 = $35.00
Stop Levels:
- S1 = $28.50
- S2 = $27.50
**Wisdom of Professional Traders:**
This analysis synthesizes insights from thousands of experienced traders and market specialists who have analyzed SOFI's rece
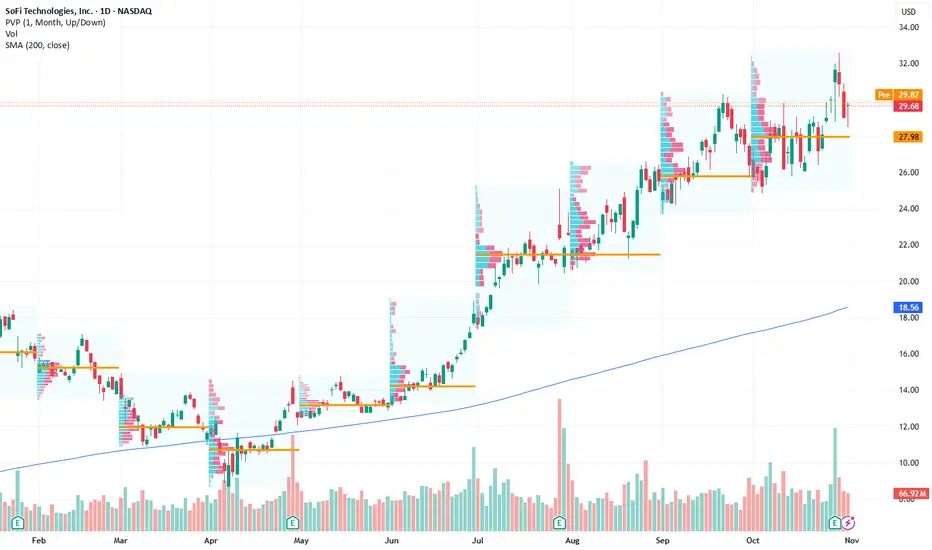
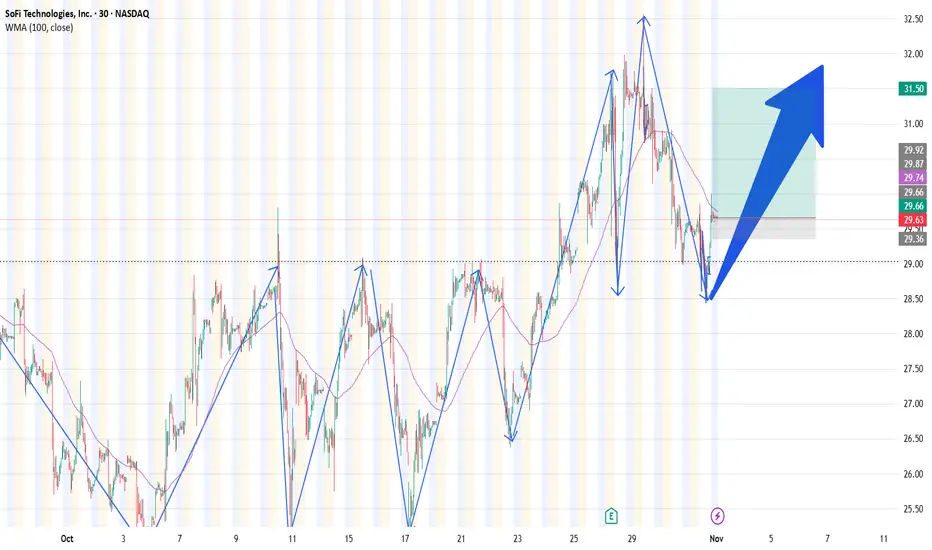
SOFI ups and lows pattern; support rejection; WMASofi has shown a clear pattern of sell-offs and investors buying the dips. Since the first sell-off on October 10, sofi has risen to its area of ATH. On Oct 1st, Sofi made a strong rebound from the previous closing day price to close above 2%, signaling a possible low.
Fundamentally, SOFI had a st
SOFI Momentum Push Near Channel Top –(Nov. 3–7)SOFI Momentum Push Near Channel Top – Liquidity Decision Zone Ahead (Nov. 3–7)🔥
WEEKLY TIMEFRAME ANALYSIS
1. Market Structure
SOFI continues to trend strongly on the weekly, printing repeated BOS confirmations as it stair-steps higher within a rising channel. Prior CHoCH signals and pullbacks were

Breaking: SoFi Technologies, Inc. (SOFI) Surge 4% In PremarketSoFi Technologies, Inc. (NASDAQ: NASDAQ:SOFI ) spike 4% in Tuesday's premarket session but sharply consolidated 2.62% .
The daily price chart shows a cup and handle pattern with eyes on the $40 resistant. As of the time of writing, NASDAQ:SOFI has an RSI of 54 giving more room to capitalize on t

$SOFI - $40 possibleSOFI - Stock breaking out and hitting all time highs. long calls printing. looking for more calls above $32 for a move towards $35 and $40. Stock looks strong on charts and indicator.
$SOFI closed at 30First time closing right at 30 today. Earnings tomorrow. around 3% up after-hours. ready to take on the next target Fib level 1.618 at 43.09.

SOFI set to rally on earningsNASDAQ:SOFI is set to rally on earnings. Here are the signs:
1. 4 Hr chart shows succecssful breakout and restest of triangle around the IPO price 28.26, followed by a continuation gap up on Monday.
2. 4 Hr chart shows the x pivot of the WXY triangle wave 2 correction at 30.09 has been overtaken.

SOFI before Earnings – TuesdayI’ve been tracking NASDAQ:SOFI closely since the last earnings report, and honestly, I like what I’m seeing.
Despite the overall market volatility, the stock has held a solid structure and stayed in a tight range, which to me signals institutional confidence, not weakness.
We haven’t seen any hea

See all ideas
Summarizing what the indicators are suggesting.
Neutral
SellBuy
Strong sellStrong buy
Strong sellSellNeutralBuyStrong buy
Neutral
SellBuy
Strong sellStrong buy
Strong sellSellNeutralBuyStrong buy
Neutral
SellBuy
Strong sellStrong buy
Strong sellSellNeutralBuyStrong buy
An aggregate view of professional's ratings.
Neutral
SellBuy
Strong sellStrong buy
Strong sellSellNeutralBuyStrong buy
Neutral
SellBuy
Strong sellStrong buy
Strong sellSellNeutralBuyStrong buy
Neutral
SellBuy
Strong sellStrong buy
Strong sellSellNeutralBuyStrong buy
Displays a symbol's price movements over previous years to identify recurring trends.
US83406FAA0
SoFi Technologies, Inc. 0.0% 15-OCT-2026Yield to maturity
—
Maturity date
Oct 15, 2026
US83406FAC6
SoFi Technologies, Inc. 1.25% 15-MAR-2029Yield to maturity
—
Maturity date
Mar 15, 2029
See all 6B0 bonds
Curated watchlists where 6B0 is featured.


Frequently Asked Questions
The current price of 6B0 is 24.58 EUR — it has decreased by −3.69% in the past 24 hours. Watch SoFi Technologies Inc stock price performance more closely on the chart.
Depending on the exchange, the stock ticker may vary. For instance, on GETTEX exchange SoFi Technologies Inc stocks are traded under the ticker 6B0.
6B0 stock has fallen by −9.97% compared to the previous week, the month change is a −6.26% fall, over the last year SoFi Technologies Inc has showed a 120.09% increase.
We've gathered analysts' opinions on SoFi Technologies Inc future price: according to them, 6B0 price has a max estimate of 32.99 EUR and a min estimate of 10.42 EUR. Watch 6B0 chart and read a more detailed SoFi Technologies Inc stock forecast: see what analysts think of SoFi Technologies Inc and suggest that you do with its stocks.
6B0 stock is 11.10% volatile and has beta coefficient of 2.36. Track SoFi Technologies Inc stock price on the chart and check out the list of the most volatile stocks — is SoFi Technologies Inc there?
Today SoFi Technologies Inc has the market capitalization of 27.88 B, it has increased by 2.92% over the last week.
Yes, you can track SoFi Technologies Inc financials in yearly and quarterly reports right on TradingView.
SoFi Technologies Inc is going to release the next earnings report on Feb 2, 2026. Keep track of upcoming events with our Earnings Calendar.
6B0 earnings for the last quarter are 0.09 EUR per share, whereas the estimation was 0.07 EUR resulting in a 32.02% surprise. The estimated earnings for the next quarter are 0.10 EUR per share. See more details about SoFi Technologies Inc earnings.
SoFi Technologies Inc revenue for the last quarter amounts to 809.27 M EUR, despite the estimated figure of 757.52 M EUR. In the next quarter, revenue is expected to reach 847.75 M EUR.
6B0 net income for the last quarter is 118.79 M EUR, while the quarter before that showed 82.57 M EUR of net income which accounts for 43.87% change. Track more SoFi Technologies Inc financial stats to get the full picture.
No, 6B0 doesn't pay any dividends to its shareholders. But don't worry, we've prepared a list of high-dividend stocks for you.
As of Nov 8, 2025, the company has 5 K employees. See our rating of the largest employees — is SoFi Technologies Inc on this list?
EBITDA measures a company's operating performance, its growth signifies an improvement in the efficiency of a company. SoFi Technologies Inc EBITDA is 893.02 M EUR, and current EBITDA margin is 16.72%. See more stats in SoFi Technologies Inc financial statements.
Like other stocks, 6B0 shares are traded on stock exchanges, e.g. Nasdaq, Nyse, Euronext, and the easiest way to buy them is through an online stock broker. To do this, you need to open an account and follow a broker's procedures, then start trading. You can trade SoFi Technologies Inc stock right from TradingView charts — choose your broker and connect to your account.
Investing in stocks requires a comprehensive research: you should carefully study all the available data, e.g. company's financials, related news, and its technical analysis. So SoFi Technologies Inc technincal analysis shows the neutral today, and its 1 week rating is buy. Since market conditions are prone to changes, it's worth looking a bit further into the future — according to the 1 month rating SoFi Technologies Inc stock shows the buy signal. See more of SoFi Technologies Inc technicals for a more comprehensive analysis.
If you're still not sure, try looking for inspiration in our curated watchlists.
If you're still not sure, try looking for inspiration in our curated watchlists.