$CCL The Best Is Yet To ComeWith Memorial Day weekend approaching, the summer season is set to kick off and in turn the cruise line season. One of the cruise line stocks that are well-positioned to become a major winner this summer season is Carnival Corporation & plc (NYSE: CCL). Over the past years, CCL stock has always made a summer run extending through June till August and this summer is no exception. Considering that the cruise line announced record bookings in Q1 in Europe and North America, this summer is shaping up to be exciting for CCL stock.
CCL Fundamentals
The summer season has always been CCL’s busiest season and the season in which CCL stock performs the best. Last year, CCL stock ran 32% from June to August, the same can be expected for its revenue as CCL’s revenues nearly doubled last year from $2.4 billion in Q2 to $4.3 billion in Q3. As CCL is starting to regain its pre-pandemic numbers and more countries start to fully open up, this summer season has the potential to be CCL’s best since the pandemic.
CCL is expecting a 4.5% increase in capacity growth this summer compared to pre-Covid in 2019. Furthermore, CCL is expanding Half Moon Cay, its private island, which has been consistently voted as the best private island, and is also developing its largest Caribbean destination yet Grand Bahama Port. All of this indicates that CCL is expecting a busier summer than usual and these actions could help CCL have an extremely successful summer season.
Earlier this year, CCL announced in its Q1 2023 earnings call that it has achieved record booking in both Europe and North America, which means that demand for cruise lines is coming back and the summer season may return record-high numbers too. In turn, customer deposits in Q1 also reached an all-time high for the quarter. That is also partially because CCL has raised its prices, but its customers do not seem bothered by it, which would mark great news for CCL.
At the same time, operations are expected to resume in Asia as cruises will start in Japan and Singapore this summer which are huge markets for CCL. As this resumption of operation is coming just in time for the summer season, CCL could be poised to report its best revenues since the pandemic this summer.
However, the only thing CCL is missing at the moment is the Chinese market as China is yet to resume its international cruise trips. China is one of CCL’s biggest markets with more than 1 million customers a year pre-pause and it will probably miss the crucial summer season. With this in mind, China is expected to fully open in the second half of 2023 which would massively boost CCL’s revenues in the latter half of the year since the Chinese market is one of the largest in the world. Meanwhile, CCL is still trying to make the best out of a bad situation as it started planning alternate deployment for its Costa fleet.
With that said, the biggest obstacle CCL will be facing is the $35 billion debt it accumulated during the pandemic. The good news is that CCL reported positive cash flow in Q1 2023 and is expecting to achieve positive cash flow for the whole year. CCL also beat its net loss estimates of $750 million – $850 million by $57 million recording $693 in net losses which shows that CCL is moving in the right direction to return to its pre-pandemic glory. In light of this, CCL stock could be a profitable buy this month ahead of the summer season.
CCL Financials
In its Q1 2023 report, CCL’s assets slightly decreased by 5% from $7.492 billion to $7.114 billion, and its cash and cash equivalents increased 36% YoY from $4.029 billion to $5.455 billion. CCL’s current liabilities saw a slight increase of 3% YoY from $10.6 billion to $11 billion.
Revenue also increased 229% YoY from $0.87 billion to $2.87 billion. Operating costs increased 48% from $3.11 billion to $4.6 billion, which contributed to its operating loss declining by almost 89% YoY from $1.49 billion to $0.172 billion, which amounted to a net loss of $693 million – a 63% improvement YoY.
Technical Analysis
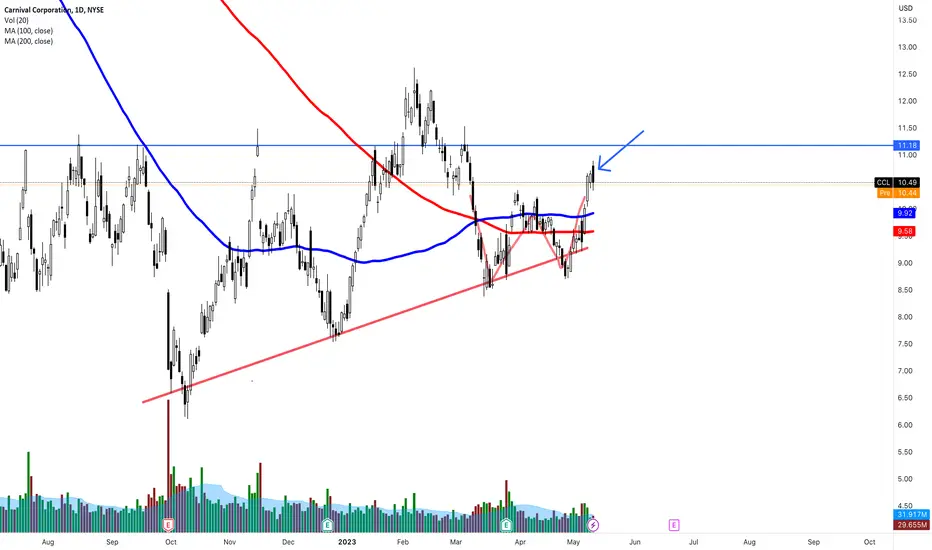
CCL Stock is in a bullish trend with the stock trading in an upward channel. Looking at the indicators, CCL is trading above the 200 MA, however, the stock is below the 50 and 21 MAs. The RSI is neutral at 41, while the MACD is approaching a bullish crossover.
As for the fundamentals, CCL is approaching a seasonal catalyst in the cruise line season which will start this summer. With the stock trading near the lower trendline, bullish investors could enter long positions on retests of the lower trendline ahead of the summer season to capitalize on CCL’s seasonal run.
CCL Forecast
CCL has shown many signs of improvement as it is recovering from the pause in operation due to the pandemic. While it still did not settle its debt situation, CCL is expected to achieve positive cash flow for the year and is close to achieving positive operating income. Furthermore, CCL achieved record booking in Q1 in both Europe and North America with the summer its busiest season approaching. For these reasons, CCL stock could be a profitable buy ahead of the summer season.
Carnival Corporation
No trades
Trade ideas


CCL: speculative tradeA price action above 9.50 supports a bullish trend direction.
Further bullish confirmation for a break above 11.00.
The upside target price is set at 13.50.
The stop-loss price is set at 9.50.
Recently crossed above its 200-day simple moving average.
It will appear that a rounding bottom pattern might be developing, which can signal upside potential.
Trade may take a while to unfold.

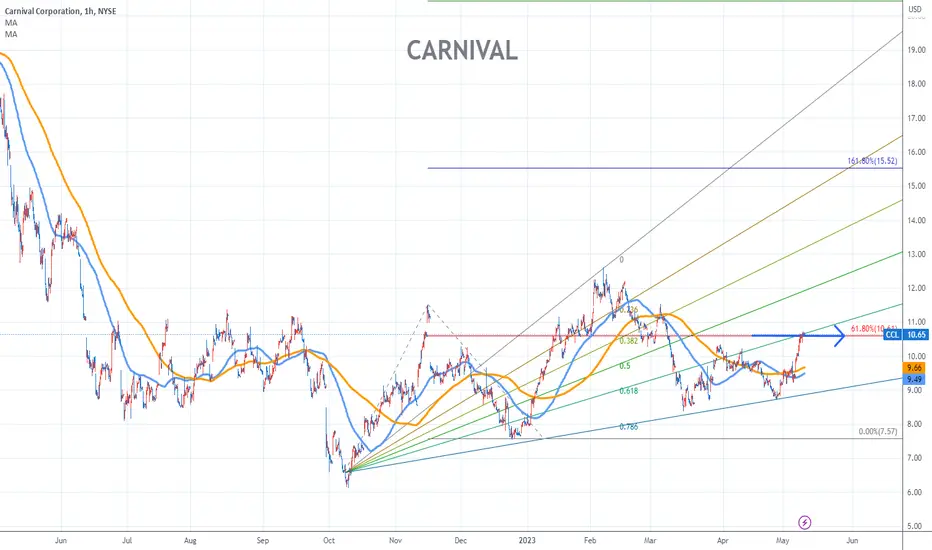
CARNIVAL Stock Chart Fibonacci Analysis 050923Trading Idea
1) Find a FIBO slingshot
2) Check FIBO 61.80% level
3) Entry Point > 10.6/61.80%
Can it hold?? $CCL #CCL Can it hold?? Is it preparing for the begging of next year?? Only time will tell?? NYSE:CCL #CCL what quarter is going to be your favorite?

CCL bullishI'm in shares. 3,600. I like this candle, I like the bounce. I'm in long. GOOD VOLUME on the stock.
Covered call prem is bleh... Buy low, sell high. I'll likely exit around $11 or $12

CCL is a long term short, expect sentiment to reverse in Q4In spite of CCL's near term revival, I believe that it is still a long term short. Look at the next few quarters as an opportunity to grab short positions for a discount.
Recession pressures will dampen earnings and the increasing cost of crude oil will deal a serious blow to CCL as it has done previously.
Personally I am looking to open a short position end of Q3, CCL tends to post strong Q3 numbers as they see some of their highest volume during the summer.
In the near term I see CCL as a potential swing trade. Definitely take advantage of the run up that seems to happen prior to each earnings, but be aware that CCL has historically dropped off the days following.

CCL - Going long to the top of the channelWe have a Paralel channel that is in the making. Coupled with the great earnings report, CCL is bound for a nice rebound.

possible flag breakout cclpossible flag breakout for CCL, even as news hit about cancelations. looking at possible 20 dollar entry. Daily Chart

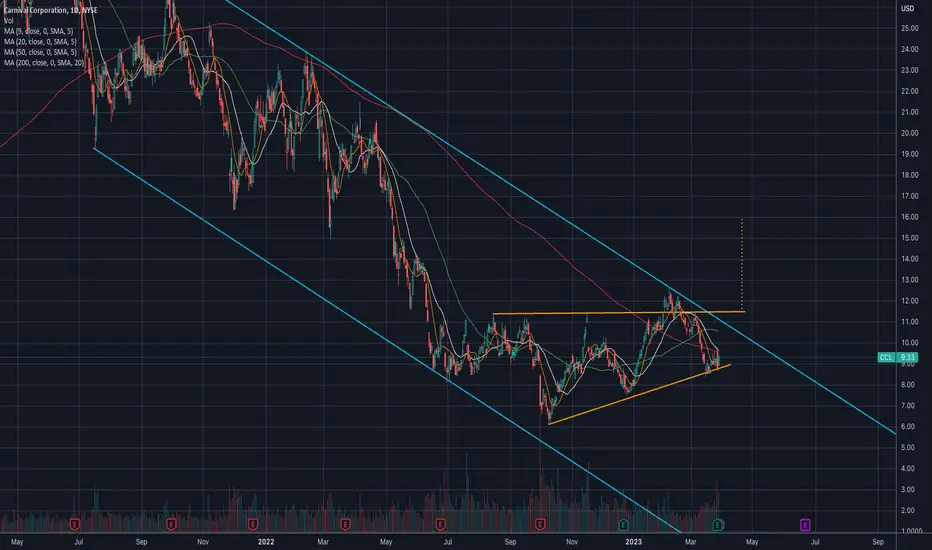
$CCL - Looking good for a ride up#CCL $CCL is again looking good for another ride up. Its currently right below 200DMA and inside an ascending triangle.
Target 1 - $10.55
Target 2 - $11.44
Risk - fall to $7.53 and below
——
Trade is done when it hit one of the target or stop loss is hit.
Disclaimer: Trading note. Not an investment advice.
CARNIVAL Stock Chart Fibonacci Analysis 032823 Trading Idea
1) Find a FIBO slingshot
2) Check FIBO 61.80% level
3) Entry Point > 9.0/61.80%

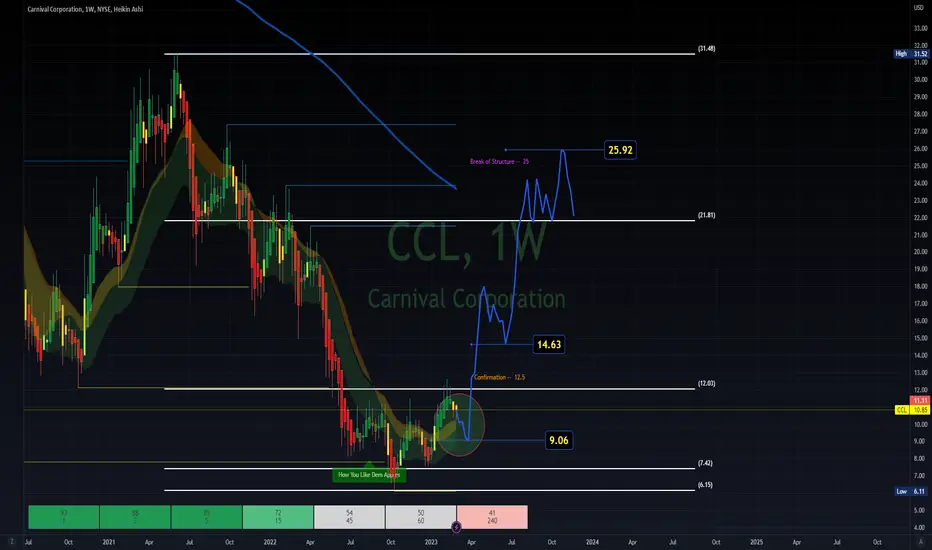
CCL Double Bottom? MACROPrice could bounce from this zone, or continue to zero, which is not very probable.

CCL CCL watching this drop. nice run up for the Shoulder Reversal for this Inverse HNS Potential Breakout. This is a long journey. watch your levels and confirmation up.
CARNIVAL Stock Chart Fibonacci Analysis 022623 Trading Idea
1) Find a FIBO slingshot
2) Check FIBO 61.80% level
3) Entry Point > 10.6/61.80%

CCL: Bullish. Long Term.Hello Traders and Investors,
CCL has finally broken out of the head and shoulder resistance after weeks of consolidating. There is also a double bottom on a monthly, suggesting the ground is pretty solid for CCL. The next major resistance dates back to 02, 08 and 09 at $16.93. This is a solid 55% gain on the stock.
Let me know what you think.

CCL Bullish. breaks out of occilationCCL broke $12 resistance yesterday and broke the occillation pattern it's been hovering on (mimicking it's early 90's stock price).
Full disclosure I am holding Jan '24 $10 LEAP options on this, looking for targets of $20 and $30 by mid year.
The cruise industry is down, but not out IMHO.

CCL covered callLast one worked! Doing it again. I got 2200 shares. This is a NICE breakout and gap. I could EASILY see CCL going a tad higher from here. Looking pretty!!!
Would not mind getting called away!

Inverted H$S. Reported record bookings for 2023 and 2024 Long!!! Reported record bookings for 2023 and 2024

ccl longvery nice set up here. Hit BV and looks like revenue forecasts may increase from here on out. Very exited to see what unfolds here.

Carnival - travel and leisureWe still have a faily bearish outlook on Travel and Leisure. This looks like a good spot to go short again on CCL. Chart looks good with good Ratio
Bearish outlook still on market.

Carnival - potential short term longCarnival, and the cruise market in general, has taken a heck of a beating since Covid. Rightfully so given their business model is dependent on cramming people into a close quarter vessel along with carrying pretty heavy amounts of debt.
It's been in a down trend losing weekly (and monthly) levels in a fairly consistent manner. However, the past 4 months or so has shown a consolidation on the weekly with a perceived bottom. What is not shown on this chart is looking back at the 95/96 year monthly / weekly pattern resembles what is currently being seen.
Both the weekly and 2d time frames show a low and a higher low with the highs slamming into the level at about $11 and being rejected which is forming an ascending triangle which is typically bullish. There are 2 things i'm watching
1) I want to see it pull back to the $9-ish area and see buyers come in (wick to the downside) after closure. This would show that the buyers are ready to break the cycle and hopefully push the price through the $11 block. If you are a risk taker, entering in that $9 pullback, if we get it, is the marker. This is risky though since this triangle is forming on a downtrend. The market could very well fall over after exhausting the buyers. (RR 2:1)
2) A close above the $11 level with the entry on the retest of that $11 area is the safer play but with less potential profit. (RR 3:1 or more)
Either trade puts the first target around $14 (especially entering at $9) with the second target at $17.50.
FWIW - I typically do not play long triangles on downtrends. However, managing exposure appropriately, this could be a pretty good trade on a short turnaround time for the stock market.

Covered call on CCL A bunch of bull candles in a row. :-) Nice bounce, nice trend. I'm in 2000 shares and I'm net positive on them. Going to sell a covered call into strength over CPI. I like this move because it gives me a WHOLE $1.20 + .15 of room and only 3 weeks with one extra day of theta next monday.
