Bullish 2From the chart, it can be seen that the price has been moving within the blue channel. Each time the price has touched the upper or lower line of the channel, it has reacted with a move either upward or downward. As shown, this has happened five times before, so there is a high probability that the
Next report date
—
Report period
—
EPS estimate
—
Revenue estimate
—
5.61 EUR
1.24 B EUR
2.05 B EUR
128.07 M
About Evolution AB
Sector
Industry
CEO
Martin Olof Carlesund
Website
Headquarters
Stockhold
Founded
2006
ISIN
SE0012673267
FIGI
BBG00Q4T9SB1
Evolution AB engages in the development, production, marketing, and licensing business to business casino solutions to gaming operators. It provides live casino studios, land-based live casino, mobile live casino, and live casino for television. The company was founded by Richard Hadida, Jens von Bahr and Fredrik Osterberg in 2006 and is headquartered in Stockholm, Sweden.
Related stocks

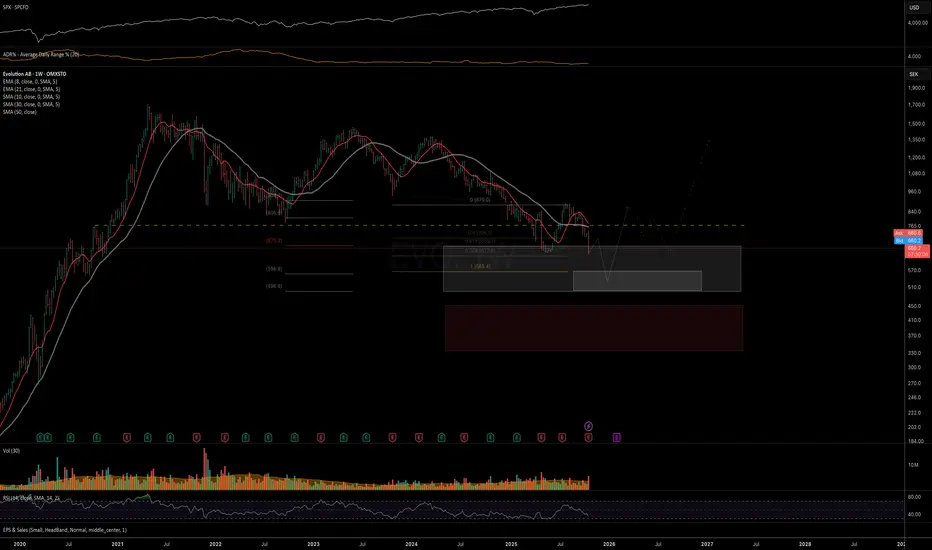
EVO: price entered macro support On the macro structure, price has approached a key macro support zone at 670–565, where at least a mid-term bottom is to be expected.
Chart:
Evolution: How to Profit from Casinos Without the Risk of LosingOMXSTO:EVO CAPITALCOM:USDSEK FOREXCOM:EURSEK
The allure of casinos has always been a double-edged sword-promising riches, but delivering some risks at the same time. Yet, for savvy investors, there’s a way to tap into this lucrative world without rolling the dice. Evolution is introducing itse
EVOLUTION A/B in demand zoneFor all those interested in the stock we seem to be at a major support. We already bounced once of this area quite a while ago. Currently there are no high-conviction signs of strength on the daily or weekly chart. What can be observed is a bull divergence on the daily on RSI. Trading volumes are tr

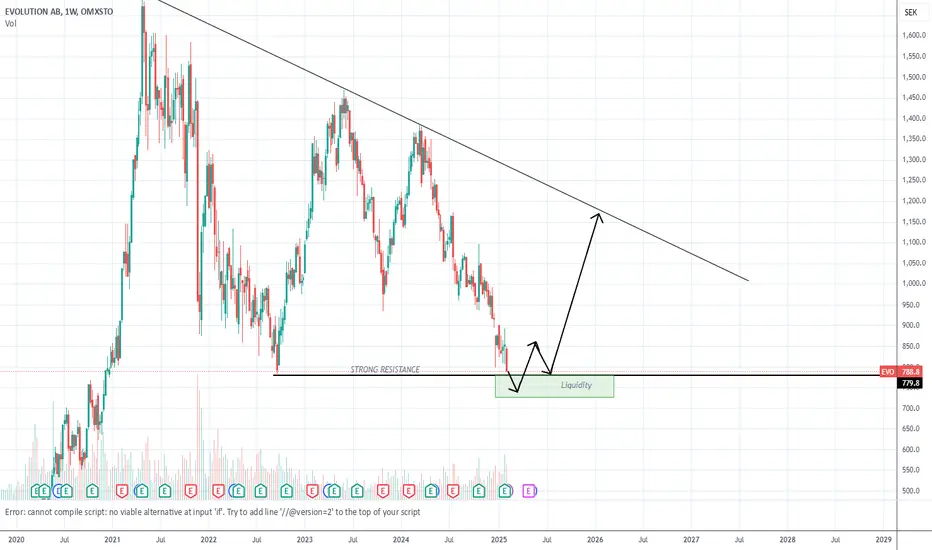
BullishEVO is going below strong resistance, then gaining liquidity and moving up. Fundamentally, it is a very good company with a ridiculous price.
EVO looking good for long termWe have a huge double bottom
Weekly bullish divergence
And oversold RSI
Looking brighter than trump's hair

12/23/24 - $evvty - Buying $75 small size on dadip12/23/24 :: VROCKSTAR :: OTC:EVVTY
Buying $75 small size on dadip
- solution (software) provider to casinos of all types. IRL, digital
- 80% GM business - like
- 70% EBITDA business - like
- nearly 10% FCF yields - like
- growing top line in teens - like
- some bonky headlines (as is par for the

EVO Elliot-Wave AnalysisDespite the very strong financials, the EVO chart is stuck in a correction since Apr '21.
I think there still is a bit more downside potential. The price should eventually find support in the green box, and ideally start forming a bottom in this area.
Potentially the price could drop even lower,

elliott wave köp evolution gamingelliot wave (5) , vol stepping up atearnings pb
buy signal at 982 sl lo of day
filled the gap from ep (shake out), rsi 50 breakout, thight between open and close!
probably it takes of after 14.00 hours but i would watch 5 min opening range high

A stories about evoThere was a little kid named ash met hun.. he lived in pallet Town and had 2 different choices. Going to be a sore loser like his dad or become Pokemon master.. something like that but with this stock

See all ideas
Summarizing what the indicators are suggesting.
Neutral
SellBuy
Strong sellStrong buy
Strong sellSellNeutralBuyStrong buy
Neutral
SellBuy
Strong sellStrong buy
Strong sellSellNeutralBuyStrong buy
Neutral
SellBuy
Strong sellStrong buy
Strong sellSellNeutralBuyStrong buy
An aggregate view of professional's ratings.
Neutral
SellBuy
Strong sellStrong buy
Strong sellSellNeutralBuyStrong buy
Neutral
SellBuy
Strong sellStrong buy
Strong sellSellNeutralBuyStrong buy
Neutral
SellBuy
Strong sellStrong buy
Strong sellSellNeutralBuyStrong buy
Displays a symbol's price movements over previous years to identify recurring trends.
Curated watchlists where E3G1 is featured.

Frequently Asked Questions
The current price of E3G1 is 58.56 EUR — it has increased by 2.28% in the past 24 hours. Watch Evolution AB stock price performance more closely on the chart.
Depending on the exchange, the stock ticker may vary. For instance, on GETTEX exchange Evolution AB stocks are traded under the ticker E3G1.
E3G1 stock has fallen by −1.91% compared to the previous week, the month change is a −12.86% fall, over the last year Evolution AB has showed a −32.24% decrease.
We've gathered analysts' opinions on Evolution AB future price: according to them, E3G1 price has a max estimate of 123.84 EUR and a min estimate of 53.10 EUR. Watch E3G1 chart and read a more detailed Evolution AB stock forecast: see what analysts think of Evolution AB and suggest that you do with its stocks.
E3G1 reached its all-time high on Apr 29, 2021 with the price of 168.16 EUR, and its all-time low was 16.90 EUR and was reached on Oct 2, 2019. View more price dynamics on E3G1 chart.
See other stocks reaching their highest and lowest prices.
See other stocks reaching their highest and lowest prices.
E3G1 stock is 0.48% volatile and has beta coefficient of 0.30. Track Evolution AB stock price on the chart and check out the list of the most volatile stocks — is Evolution AB there?
Today Evolution AB has the market capitalization of 11.51 B, it has decreased by −5.93% over the last week.
Yes, you can track Evolution AB financials in yearly and quarterly reports right on TradingView.
Evolution AB is going to release the next earnings report on Feb 5, 2026. Keep track of upcoming events with our Earnings Calendar.
E3G1 earnings for the last quarter are 1.25 EUR per share, whereas the estimation was 1.33 EUR resulting in a −6.04% surprise. The estimated earnings for the next quarter are 1.31 EUR per share. See more details about Evolution AB earnings.
Evolution AB revenue for the last quarter amounts to 507.12 M EUR, despite the estimated figure of 535.50 M EUR. In the next quarter, revenue is expected to reach 524.91 M EUR.
E3G1 net income for the last quarter is 253.26 M EUR, while the quarter before that showed 243.02 M EUR of net income which accounts for 4.22% change. Track more Evolution AB financial stats to get the full picture.
Yes, E3G1 dividends are paid annually. The last dividend per share was 2.79 EUR. As of today, Dividend Yield (TTM)% is 4.81%. Tracking Evolution AB dividends might help you take more informed decisions.
Evolution AB dividend yield was 3.58% in 2024, and payout ratio reached 44.91%. The year before the numbers were 2.58% and 53.92% correspondingly. See high-dividend stocks and find more opportunities for your portfolio.
As of Nov 10, 2025, the company has 15.38 K employees. See our rating of the largest employees — is Evolution AB on this list?
EBITDA measures a company's operating performance, its growth signifies an improvement in the efficiency of a company. Evolution AB EBITDA is 1.40 B EUR, and current EBITDA margin is 68.38%. See more stats in Evolution AB financial statements.
Like other stocks, E3G1 shares are traded on stock exchanges, e.g. Nasdaq, Nyse, Euronext, and the easiest way to buy them is through an online stock broker. To do this, you need to open an account and follow a broker's procedures, then start trading. You can trade Evolution AB stock right from TradingView charts — choose your broker and connect to your account.
Investing in stocks requires a comprehensive research: you should carefully study all the available data, e.g. company's financials, related news, and its technical analysis. So Evolution AB technincal analysis shows the sell today, and its 1 week rating is sell. Since market conditions are prone to changes, it's worth looking a bit further into the future — according to the 1 month rating Evolution AB stock shows the strong sell signal. See more of Evolution AB technicals for a more comprehensive analysis.
If you're still not sure, try looking for inspiration in our curated watchlists.
If you're still not sure, try looking for inspiration in our curated watchlists.