AER | Bull Flag Breakout With Relative Strength as SPY Fades🚀 AER — Bull Flag Breakout | Daily Trade Idea (Nov 5 2025)
Ticker: NYSE:AER (AerCap Holdings N.V.)
Sector: Aircraft Leasing / Aerospace Finance
📊 Technical Setup
Pattern: Bull flag + intraday flat-base handle breakout
Structure: Held earnings-gap gains → formed 4 days tight → let the 5 EMA (≈
AerCap Holdings NV
No trades
Next report date
—
Report period
—
EPS estimate
—
Revenue estimate
—
18.41 EUR
2.03 B EUR
6.80 B EUR
167.67 M
About AerCap Holdings N.V.
Sector
Industry
CEO
Aengus Kelly
Website
Headquarters
Dublin
Founded
2006
IPO date
Nov 20, 2006
Identifiers
2
ISIN NL0000687663
AerCap Holdings NV engages in the leasing, financing, sales, and management of commercial flight equipment. It offers passenger and cargo aircraft. The company was founded in 1995 and is headquartered in Dublin, Ireland.
Related stocks

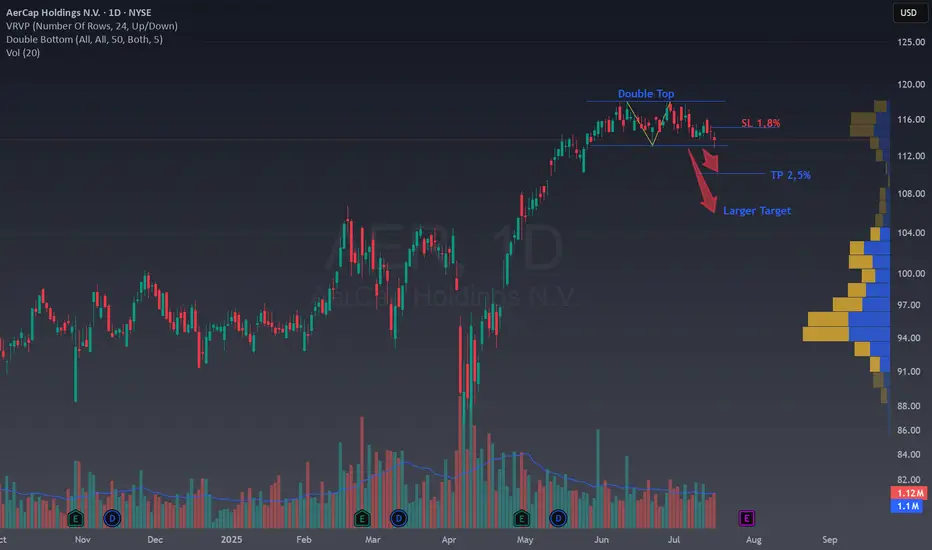
Double Top Breakdown on AER 🧠 Double Top Breakdown on NYSE:AER
Ticker : AerCap Holdings N.V. (AER)
Timeframe : 1D (Daily Chart)
Pattern : Double Top
Strategy : Bearish Reversal
✍️ Analysis
We’ve got a textbook Double Top forming after a strong bullish rally. Price failed to break above the $118 resistance twice,
$AER broke out and successfully held above supportNYSE:AER broke out and successfully held above a base. This is a good time to enter a trade with a stop loss below the support at $99.

6/4/2022 NYSE (AER)Short (Entry Price) within the sell zone area and exit (Stop Loss) above the red line. Can take profit at the suggested Target Price.
Entry Price: $49.45 / $50.27
Target Price: $48.18 / $49.50
Stop Loss: $51.57


$AER can rise in the next daysContextual immersion trading strategy idea.
AerCap Holdings N.V., an aircraft leasing company, engages in the lease, financing, sale, and management of commercial aircraft and engines in Mainland China, Hong Kong, Macau, the United States, Ireland, and internationally.
The demand for shares of th

AERCAP HOLDINGS N.V. PlanHey my friends, AERCAP HOLDINGS N.V. is in a fake bearish movement with low purchase volume and a shadow of the top more imposing than the bottom. On the TIMEFRAME M1 we see a marubozu with a return of sales volume issued at the end of the session and just before too. It's going to make a trend reve

AER is setting up for the growthAER had crossed the 200-day moving average and now is located above. Today was a green day, and, supposedly, the price will resume moving higher. One may build a long trade here with a stop-loss at 38.25

Symmetric Triangle Falling WedgeS Triangles can break either way.
Bollinger bands are tight. Looks like it will break one way or the other soon
Falling wedges can be bullish at the bottom and can signal a reversal..but not always
SPR has virtually the same patterns as AER
Happy Trading

GET A HOLD OF THIS ONE $AERPrice has crossed the 50 EMA which is a positive sign for upward trend. The 10 EMA HAS crossed the 50 EMA. The other indicators show that an upward trend is in play. Enjoy.

See all ideas
Summarizing what the indicators are suggesting.
Neutral
SellBuy
Strong sellStrong buy
Strong sellSellNeutralBuyStrong buy
Neutral
SellBuy
Strong sellStrong buy
Strong sellSellNeutralBuyStrong buy
Neutral
SellBuy
Strong sellStrong buy
Strong sellSellNeutralBuyStrong buy
An aggregate view of professional's ratings.
Neutral
SellBuy
Strong sellStrong buy
Strong sellSellNeutralBuyStrong buy
Neutral
SellBuy
Strong sellStrong buy
Strong sellSellNeutralBuyStrong buy
Neutral
SellBuy
Strong sellStrong buy
Strong sellSellNeutralBuyStrong buy
Displays a symbol's price movements over previous years to identify recurring trends.
AER5707655
AerCap Ireland Capital Designated Activity Company 6.45% 15-APR-2027Yield to maturity
5.68%
Maturity date
Apr 15, 2027
AER5286247
AerCap Ireland Capital Designated Activity Company 3.85% 29-OCT-2041Yield to maturity
5.58%
Maturity date
Oct 29, 2041
AER6183528
AerCap Ireland Capital Designated Activity Company 5.0% 15-NOV-2035Yield to maturity
5.18%
Maturity date
Nov 15, 2035
AER5885594
AerCap Ireland Capital Designated Activity Company 4.95% 10-SEP-2034Yield to maturity
5.01%
Maturity date
Sep 10, 2034
AER5729532
AerCap Ireland Capital Designated Activity Company 5.3% 19-JAN-2034Yield to maturity
4.96%
Maturity date
Jan 19, 2034
AER5286242
AerCap Ireland Capital Designated Activity Company 3.4% 29-OCT-2033Yield to maturity
4.96%
Maturity date
Oct 29, 2033
AER6276534
AerCap Ireland Capital Designated Activity Company 4.75% 15-JAN-2033Yield to maturity
4.91%
Maturity date
Jan 15, 2033
AER5286241
AerCap Ireland Capital Designated Activity Company 3.3% 30-JAN-2032Yield to maturity
4.77%
Maturity date
Jan 30, 2032
AER5974990
AerCap Ireland Capital Designated Activity Company 5.375% 15-DEC-2031Yield to maturity
4.71%
Maturity date
Dec 15, 2031
AER5654199
AerCap Ireland Capital Designated Activity Company 6.15% 30-SEP-2030Yield to maturity
4.58%
Maturity date
Sep 30, 2030
AER6183527
AerCap Ireland Capital Designated Activity Company 4.375% 15-NOV-2030Yield to maturity
4.50%
Maturity date
Nov 15, 2030
See all R1D bonds
EEUD
iShares IV PLC - iShares MSCI Europe CTB Enhanced ESG UCITS ETF Unhedged EURWeight
0.56%
Market value
40.63 M
USD
EDM6
iShares IV PLC - iShares MSCI Europe CTB Enhanced ESG UCITS ETF Accum Shs Unhedged EURWeight
0.56%
Market value
40.63 M
USD
Explore more ETFs
Frequently Asked Questions
The current price of R1D is 120.55 EUR — it has increased by 0.25% in the past 24 hours. Watch AerCap Holdings NV stock price performance more closely on the chart.
Depending on the exchange, the stock ticker may vary. For instance, on GETTEX exchange AerCap Holdings NV stocks are traded under the ticker R1D.
R1D stock has fallen by −1.61% compared to the previous week, the month change is a −2.45% fall, over the last year AerCap Holdings NV has showed a 31.43% increase.
We've gathered analysts' opinions on AerCap Holdings NV future price: according to them, R1D price has a max estimate of 136.96 EUR and a min estimate of 119.21 EUR. Watch R1D chart and read a more detailed AerCap Holdings NV stock forecast: see what analysts think of AerCap Holdings NV and suggest that you do with its stocks.
R1D stock is 2.53% volatile and has beta coefficient of 0.78. Track AerCap Holdings NV stock price on the chart and check out the list of the most volatile stocks — is AerCap Holdings NV there?
Today AerCap Holdings NV has the market capitalization of 21.07 B, it has decreased by −2.55% over the last week.
Yes, you can track AerCap Holdings NV financials in yearly and quarterly reports right on TradingView.
AerCap Holdings NV is going to release the next earnings report on Feb 6, 2026. Keep track of upcoming events with our Earnings Calendar.
R1D earnings for the last quarter are 4.24 EUR per share, whereas the estimation was 2.65 EUR resulting in a 60.09% surprise. The estimated earnings for the next quarter are 2.86 EUR per share. See more details about AerCap Holdings NV earnings.
AerCap Holdings NV revenue for the last quarter amounts to 1.97 B EUR, despite the estimated figure of 1.69 B EUR. In the next quarter, revenue is expected to reach 1.77 B EUR.
R1D net income for the last quarter is 1.04 B EUR, while the quarter before that showed 1.07 B EUR of net income which accounts for −3.08% change. Track more AerCap Holdings NV financial stats to get the full picture.
Yes, R1D dividends are paid quarterly. The last dividend per share was 0.23 EUR. As of today, Dividend Yield (TTM)% is 0.76%. Tracking AerCap Holdings NV dividends might help you take more informed decisions.
AerCap Holdings NV dividend yield was 0.78% in 2024, and payout ratio reached 6.78%. The year before the numbers were 0.00% and 0.00% correspondingly. See high-dividend stocks and find more opportunities for your portfolio.
As of Jan 29, 2026, the company has 699 employees. See our rating of the largest employees — is AerCap Holdings NV on this list?
EBITDA measures a company's operating performance, its growth signifies an improvement in the efficiency of a company. AerCap Holdings NV EBITDA is 5.64 B EUR, and current EBITDA margin is 81.55%. See more stats in AerCap Holdings NV financial statements.
Like other stocks, R1D shares are traded on stock exchanges, e.g. Nasdaq, Nyse, Euronext, and the easiest way to buy them is through an online stock broker. To do this, you need to open an account and follow a broker's procedures, then start trading. You can trade AerCap Holdings NV stock right from TradingView charts — choose your broker and connect to your account.
Investing in stocks requires a comprehensive research: you should carefully study all the available data, e.g. company's financials, related news, and its technical analysis. So AerCap Holdings NV technincal analysis shows the neutral today, and its 1 week rating is buy. Since market conditions are prone to changes, it's worth looking a bit further into the future — according to the 1 month rating AerCap Holdings NV stock shows the buy signal. See more of AerCap Holdings NV technicals for a more comprehensive analysis.
If you're still not sure, try looking for inspiration in our curated watchlists.
If you're still not sure, try looking for inspiration in our curated watchlists.