600% print for Aavegotchi (GHST) NFT Gaming protocol?The above 11 day chart (don’t ask) tells us someone somewhere bought this token at $3.85 in March of 2024 before watching a 92% collapse in price action. The marketplace is now gripped by fear. Are sellers today correct, get out now before the remaining -8% to zero strikes? It certainly appears that
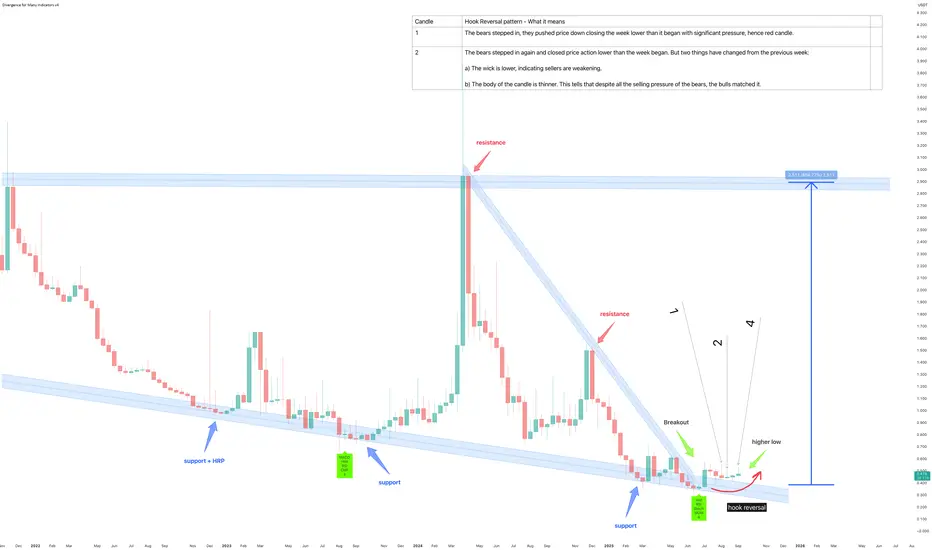
GHSTUSDT 1D#GHST is moving within a descending channel on the daily chart. It was recently rejected from the channel resistance and the daily EMA200. Consider buying #GHST near the support levels highlighted on the chart. If it breaks out above the channel resistance and the EMA200, the potential targets are:

GHST / USDT : Near to breakoutGHST/USDT Chart Analysis: Bullish Breakout Potential
Looking at the daily chart, we can see a clear upward momentum after a period of consolidation. The price has recently broken above a long-standing downward trendline, signaling a potential bullish breakout.
Trendline Break: The price has succes

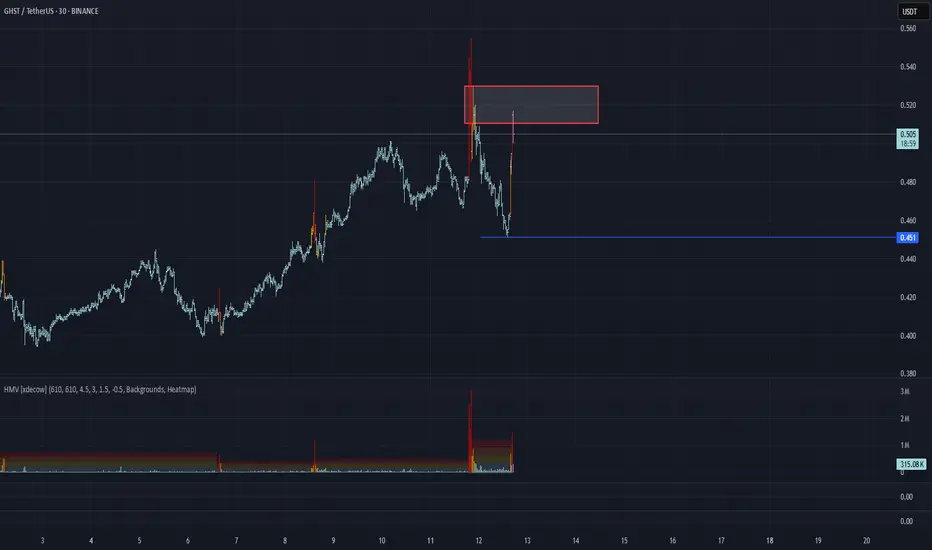
GHST/USDT Analysis — High Probability of Correction
On the hourly chart, we can see a clear break in trend to the downside. At the moment, the price has reached a key volume zone at $0.51–$0.53, showing volume divergence. We are considering a short position with potential to retest and break the local low at $0.45.
This publication is not financi
GHSTUSDTIf its breakdown the uppertrend not good
We have 2 supply zones below this trend.
Maybe bounce happen from this 2 zones.

GHST Bullish DivergenceBINANCE:GHSTUSDT
Trade Setup:
Target 1: 0.455 (0.786 Fibonnaci Golden Zone).
Target 2: 0.481 (0.618 Fibonnaci Golden Zone).
Target 3: 0.500 (0.786 Fibonnaci Golden Zone).
Target 4: 0.578 (0 Fibonnaci).
Stop Loss: 0.379 (1.272 Fibonnaci).
RSI Analysis: The RSI is showing a bullish divergence, su

GHST/USDT +100%GHST/USDT is looking strong on the daily time frame after successfully reclaiming the key $0.39 zone a major structural level. This reclaim signals a clear shift in momentum, with strong buyer interest stepping in to support the move.
The price structure is showing early signs of a bullish reversa

Bullish Rounding Bottom!📈 GHST Update – Bullish Rounding Bottom! 🚀
👀 GHST has formed a bullish rounding bottom. If breakout red resistance zone target green line level.
🔑 We are waiting for a breakout above the red resistance zone to target the green line level.
Keep a close eye on GHST!


GHSTUSDT %95 DAILY VOLUME INCREASE There is currently a 95% increase in daily volume for $BINANCE:GHSTUSDT. However, I prefer not to rush into evaluating this volume increase just yet.
I will closely monitor the blue box areas, which can be evaluated with a stop at 0.789.
It’s worth noting that buyers are starting to step into

See all ideas
Summarizing what the indicators are suggesting.
Oscillators
Neutral
SellBuy
Strong sellStrong buy
Strong sellSellNeutralBuyStrong buy
Oscillators
Neutral
SellBuy
Strong sellStrong buy
Strong sellSellNeutralBuyStrong buy
Summary
Neutral
SellBuy
Strong sellStrong buy
Strong sellSellNeutralBuyStrong buy
Summary
Neutral
SellBuy
Strong sellStrong buy
Strong sellSellNeutralBuyStrong buy
Summary
Neutral
SellBuy
Strong sellStrong buy
Strong sellSellNeutralBuyStrong buy
Moving Averages
Neutral
SellBuy
Strong sellStrong buy
Strong sellSellNeutralBuyStrong buy
Moving Averages
Neutral
SellBuy
Strong sellStrong buy
Strong sellSellNeutralBuyStrong buy
Displays a symbol's price movements over previous years to identify recurring trends.