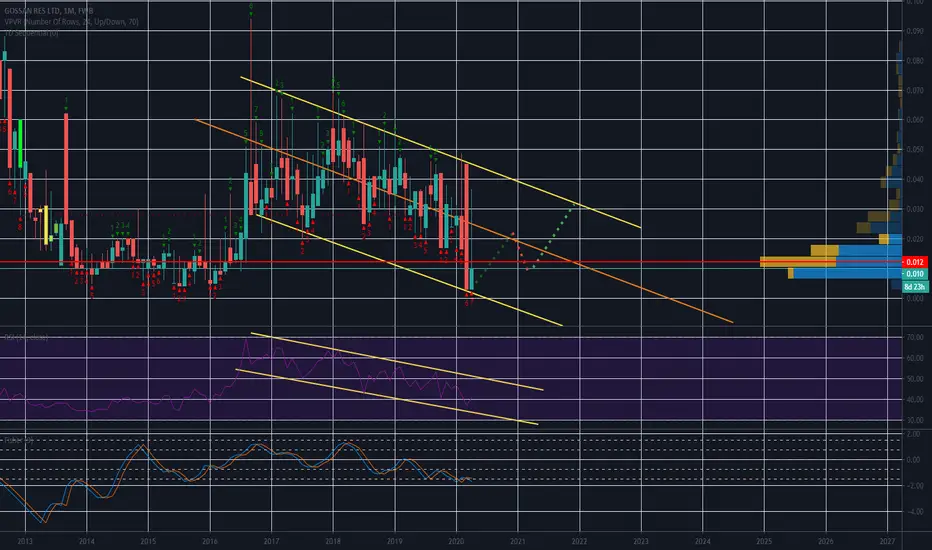
GOSSAN Trading Decending Channel, No Break out expected. Gossan Res LTD could be a great short when we get back up to the top of the channel. This is not trading advice. Be careful as this stock is down 40%
Gossan Resources Ltd.
No trades
−0.0018 USD
−350.94 K USD
0.00 USD
56.41 M
About Gossan Resources Limited
Sector
Industry
CEO
Samuel Pelaez
Website
Headquarters
Winnipeg
Founded
1980
IPO date
Feb 7, 1983
Identifiers
3
ISIN CA3834151068
Gossan Resources Ltd. engages in the exploration and development of mineral resources. Its property portfolio includes, Sturgeon Lake Zinc, Inwood Dolomite, Pipestone Lake, Bird River, Separation Rapids, and Silica Frac Sand. The company was founded on June 16, 1980 and is headquartered in Winnipeg, Canada.
Related stocks
Summarizing what the indicators are suggesting.
Oscillators
Neutral
SellBuy
Strong sellStrong buy
Strong sellSellNeutralBuyStrong buy
Oscillators
Neutral
SellBuy
Strong sellStrong buy
Strong sellSellNeutralBuyStrong buy
Summary
Neutral
SellBuy
Strong sellStrong buy
Strong sellSellNeutralBuyStrong buy
Summary
Neutral
SellBuy
Strong sellStrong buy
Strong sellSellNeutralBuyStrong buy
Summary
Neutral
SellBuy
Strong sellStrong buy
Strong sellSellNeutralBuyStrong buy
Moving Averages
Neutral
SellBuy
Strong sellStrong buy
Strong sellSellNeutralBuyStrong buy
Moving Averages
Neutral
SellBuy
Strong sellStrong buy
Strong sellSellNeutralBuyStrong buy
Displays a symbol's price movements over previous years to identify recurring trends.
Frequently Asked Questions
The current price of GSSRF is 0.0310 USD — it has increased by 10.71% in the past 24 hours. Watch Gossan Resources Ltd. stock price performance more closely on the chart.
Depending on the exchange, the stock ticker may vary. For instance, on OTC exchange Gossan Resources Ltd. stocks are traded under the ticker GSSRF.
GSSRF reached its all-time high on Dec 17, 2003 with the price of 0.6500 USD, and its all-time low was 0.0012 USD and was reached on Sep 26, 2025. View more price dynamics on GSSRF chart.
See other stocks reaching their highest and lowest prices.
See other stocks reaching their highest and lowest prices.
GSSRF stock is 9.68% volatile and has beta coefficient of −1.07. Track Gossan Resources Ltd. stock price on the chart and check out the list of the most volatile stocks — is Gossan Resources Ltd. there?
Today Gossan Resources Ltd. has the market capitalization of 1.73 M, it has decreased by −13.18% over the last week.
Yes, you can track Gossan Resources Ltd. financials in yearly and quarterly reports right on TradingView.
GSSRF net income for the last quarter is 67.20 K USD, while the quarter before that showed 26.34 K USD of net income which accounts for 155.17% change. Track more Gossan Resources Ltd. financial stats to get the full picture.
No, GSSRF doesn't pay any dividends to its shareholders. But don't worry, we've prepared a list of high-dividend stocks for you.
Like other stocks, GSSRF shares are traded on stock exchanges, e.g. Nasdaq, Nyse, Euronext, and the easiest way to buy them is through an online stock broker. To do this, you need to open an account and follow a broker's procedures, then start trading. You can trade Gossan Resources Ltd. stock right from TradingView charts — choose your broker and connect to your account.
Investing in stocks requires a comprehensive research: you should carefully study all the available data, e.g. company's financials, related news, and its technical analysis. So Gossan Resources Ltd. technincal analysis shows the buy rating today, and its 1 week rating is buy. Since market conditions are prone to changes, it's worth looking a bit further into the future — according to the 1 month rating Gossan Resources Ltd. stock shows the buy signal. See more of Gossan Resources Ltd. technicals for a more comprehensive analysis.
If you're still not sure, try looking for inspiration in our curated watchlists.
If you're still not sure, try looking for inspiration in our curated watchlists.