Bitcoin Explodes to $116,000 After Fed Speech SignalBitcoin Surges Past $116,000 as Federal Reserve Signals Historic Policy Shift
The cryptocurrency market experienced a dramatic reversal of fortune as Bitcoin rocketed past $116,000, recovering from a challenging period that had seen the digital asset touch six-week lows. The catalyst for this remarkable turnaround came from an unlikely source: Federal Reserve Chair Jerome Powell, whose dovish remarks at the prestigious Jackson Hole Economic Symposium sent ripple effects through global financial markets, fundamentally altering the trajectory for risk assets and digital currencies alike.
The Jackson Hole Moment That Changed Everything
In what many market observers are calling a pivotal moment for monetary policy, Jerome Powell delivered a speech that effectively cemented market expectations for an interest rate cut in September. The immediate reaction was nothing short of spectacular. Within minutes of Powell's comments hitting the wires, Bitcoin surged over 2%, climbing from approximately $114,200 to breach the psychologically significant $116,000 level. This rapid appreciation represented not just a technical bounce, but a fundamental reassessment of the cryptocurrency's near-term prospects in a changing monetary environment.
The significance of Powell's speech cannot be overstated. The Jackson Hole Economic Symposium has historically served as a platform for Federal Reserve chairs to signal major policy shifts, and this year proved no exception. Powell's carefully calibrated remarks suggested that the Federal Reserve's aggressive rate-hiking cycle, which had been implemented to combat persistent inflation, might finally be approaching its conclusion. For Bitcoin and the broader cryptocurrency ecosystem, which had struggled under the weight of tighter monetary conditions for much of the past two years, this represented a potential game-changer.
The market's interpretation was unambiguous. Federal funds futures immediately repriced to reflect a 90% probability of a rate cut at the September Federal Open Market Committee meeting, up from roughly 70% before Powell's speech. This dramatic shift in expectations triggered an immediate reallocation of capital across asset classes, with risk assets being the primary beneficiaries and the US dollar experiencing notable weakness.
A Broader Market Rally Takes Shape
While Bitcoin's surge captured headlines, the positive sentiment extended far beyond the cryptocurrency market. Ethereum, the second-largest cryptocurrency by market capitalization, staged an even more impressive recovery, rebounding 8% after having endured a painful 12% correction in the preceding sessions. This outperformance by Ethereum suggested that investors were not merely buying Bitcoin as a hedge against monetary policy uncertainty, but were expressing renewed confidence in the broader digital asset ecosystem.
Traditional financial markets also responded enthusiastically to Powell's dovish pivot. US equity indices gained approximately 1%, with technology stocks leading the advance. The yield on benchmark Treasury securities dropped to 4.27%, reflecting bond traders' expectations for a less restrictive monetary policy stance going forward. Gold, that traditional safe-haven asset and frequent competitor to Bitcoin for investor attention, rose 0.6%, demonstrating that the appetite for alternative stores of value remained robust even as risk sentiment improved.
This synchronized movement across asset classes highlighted an important dynamic that has become increasingly evident in recent years: the growing correlation between cryptocurrency markets and traditional financial assets during periods of significant monetary policy shifts. While Bitcoin was originally conceived as an uncorrelated asset that would provide portfolio diversification benefits, its behavior during major macro events has increasingly mirrored that of other risk assets, particularly growth-oriented technology stocks.
Understanding the Whale Dynamics
Beneath the surface of the price action, on-chain data revealed fascinating insights into how different market participants positioned themselves ahead of Powell's speech. Most notably, Bitcoin whales – entities holding large quantities of the cryptocurrency – had been quietly accumulating during the recent downtrend. According to blockchain analytics, these major holders added approximately 16,000 BTC to their positions during the period of price weakness, suggesting that sophisticated investors saw value at lower levels and were positioning for exactly the type of policy-driven rally that ultimately materialized.
This accumulation pattern by whales deserves closer examination, as it often serves as a leading indicator for future price movements. The fact that these large holders were adding to positions while retail investors were capitulating speaks to a divergence in market sentiment that often precedes significant trend changes. The 16,000 BTC accumulation represents over $1.8 billion at current prices, demonstrating serious conviction among institutional and high-net-worth investors about Bitcoin's medium-term prospects.
The whale accumulation also highlights the maturation of Bitcoin markets. Unlike the wild speculation that characterized earlier cycles, current market dynamics show signs of more sophisticated trading strategies and longer-term investment horizons. These large holders appear to be treating Bitcoin less as a speculative vehicle and more as a legitimate asset class worthy of strategic allocation within diversified portfolios.
The Federal Reserve's Delicate Balancing Act
The enthusiasm surrounding Powell's dovish turn must be tempered with an understanding of the complex challenges facing the Federal Reserve. Some cryptocurrency strategists have sounded alarm bells, warning that a significant Bitcoin surge could potentially clash with the Fed's broader economic goals. If cryptocurrency markets experience excessive speculation leading to wealth effects that stimulate consumer spending, this could complicate the Fed's efforts to bring inflation back to its 2% target.
This concern is not without merit. The cryptocurrency market's total capitalization now exceeds $2.5 trillion, making it large enough to have meaningful macroeconomic impacts. A sustained rally in digital assets could create wealth effects that filter through to the real economy, potentially reigniting inflationary pressures just as the Fed believes it has gained the upper hand in its fight against rising prices. This dynamic creates a fascinating feedback loop where the very monetary policy easing that benefits Bitcoin could ultimately be constrained by Bitcoin's success.
Furthermore, the Federal Reserve must consider the international implications of its policy decisions. A weaker dollar resulting from rate cuts could have significant consequences for global trade and financial stability. Many emerging market economies have dollar-denominated debt, and a rapidly weakening dollar could create challenges for these nations. Additionally, other major central banks might be forced to adjust their own policies in response to Fed actions, potentially triggering a global easing cycle with unpredictable consequences.
Technical Analysis and Market Structure
From a technical perspective, Bitcoin's surge past $116,000 represents a significant development in market structure. The cryptocurrency had been trading in a descending channel for several weeks, with each rally attempt meeting selling pressure at lower highs. The Powell-induced breakout decisively violated this bearish pattern, suggesting a potential trend reversal is underway.
However, technical indicators present a mixed picture that warrants careful consideration. The Bitcoin Bull Score Index, a composite metric that aggregates various momentum and sentiment indicators, has been signaling fading momentum despite the recent price surge. This divergence between price action and underlying momentum suggests that while the immediate reaction to Powell's speech was strongly positive, questions remain about the sustainability of the current rally.
Volume patterns also deserve attention. The surge past $116,000 occurred on elevated but not exceptional volume, suggesting that while there was genuine buying interest, we haven't yet seen the kind of capitulation from bears or FOMO from sidelined buyers that typically characterizes major trend changes. This could mean that the market is still in the early stages of processing the implications of the Fed's policy shift, with more significant moves potentially ahead as participants fully digest the changing macro landscape.
Support and resistance levels have also shifted following the breakout. The $114,000-$115,000 zone, which previously acted as resistance, should now serve as support on any pullbacks. Above current levels, the next major resistance lies around $120,000, which represents both a psychological level and the site of significant selling during previous rallies. How Bitcoin behaves around these key levels in coming sessions will provide important clues about the strength of the current uptrend.
The Broader Implications for Cryptocurrency Adoption
Beyond the immediate price implications, the Federal Reserve's policy shift could have profound effects on cryptocurrency adoption and development. Lower interest rates reduce the opportunity cost of holding non-yielding assets like Bitcoin, making them relatively more attractive compared to traditional fixed-income investments. This dynamic could accelerate institutional adoption of cryptocurrencies as portfolio diversifiers.
Moreover, a more accommodative monetary policy environment could reignite interest in decentralized finance (DeFi) protocols, which had seen diminished activity during the period of rising rates. Lower rates in traditional finance make the yields available in DeFi more competitive, potentially driving renewed capital flows into these innovative financial platforms. This could create a virtuous cycle where increased DeFi activity drives demand for cryptocurrencies like Ethereum, which serves as the backbone for most DeFi applications.
The changing monetary landscape also has implications for central bank digital currency (CBDC) initiatives. As traditional monetary policy tools become less effective in a low-rate environment, central banks might accelerate their exploration of CBDCs as alternative mechanisms for implementing monetary policy. While CBDCs could potentially compete with cryptocurrencies in some use cases, they might also serve to legitimize digital currencies more broadly, ultimately benefiting the entire ecosystem.
Risk Factors and Considerations
Despite the current optimism, several risk factors could derail Bitcoin's bullish momentum. First, the Federal Reserve's commitment to rate cuts is contingent on continued progress in reducing inflation. Any resurgence in price pressures could force the Fed to maintain or even increase rates, potentially triggering another leg down in cryptocurrency markets.
Regulatory risks also remain omnipresent. While the regulatory environment for cryptocurrencies has generally improved in recent years, with the approval of Bitcoin ETFs and growing institutional participation, the potential for adverse regulatory actions remains. Any major regulatory crackdown, particularly in the United States or European Union, could quickly reverse current gains.
Geopolitical tensions represent another wildcard. While Bitcoin has sometimes benefited from geopolitical uncertainty as investors seek alternatives to traditional financial systems, extreme events could trigger broad-based risk aversion that negatively impacts all speculative assets, including cryptocurrencies. The ongoing conflicts in various regions and tensions between major powers create an environment where sudden shocks remain possible.
Technical vulnerabilities within the cryptocurrency ecosystem itself also warrant consideration. While Bitcoin's network has proven remarkably resilient over its history, the broader cryptocurrency space has experienced numerous hacks, exploits, and technical failures. Any major security breach or technical failure could undermine confidence and trigger selling pressure across digital assets.
Market Psychology and Sentiment Dynamics
The psychological aspect of the current rally deserves special attention. After months of ranging price action and failed breakout attempts, many market participants had grown pessimistic about Bitcoin's near-term prospects. The sudden reversal triggered by Powell's speech has likely caught many traders off-guard, potentially setting up a powerful short squeeze as bearishly positioned traders scramble to cover their positions.
This shift in sentiment is already visible in various metrics. Funding rates in perpetual futures markets have turned positive, indicating that traders are willing to pay premiums to maintain long positions. Social media sentiment, as measured by various analytical tools, has shifted from predominantly bearish to cautiously optimistic. The fear and greed index, which had been mired in "fear" territory for weeks, has begun moving toward neutral readings.
However, this rapid shift in sentiment also creates vulnerabilities. Markets that move too far, too fast often experience sharp pullbacks as early buyers take profits and late entrants get shaken out. The key for sustained upward movement will be whether the current rally can attract new capital from investors who have been waiting on the sidelines, rather than simply representing a reshuffling of existing positions.
The International Perspective
The Federal Reserve's policy shift has global implications that extend far beyond US borders. Other major central banks, including the European Central Bank and the Bank of Japan, will need to carefully consider their own policy stances in light of the Fed's dovish turn. This could potentially trigger a synchronized global easing cycle, which would likely be highly supportive for risk assets including cryptocurrencies.
For Bitcoin specifically, international dynamics are particularly important given its global nature. Demand from regions experiencing currency devaluation or financial instability has historically been a significant driver of Bitcoin adoption. If the Fed's rate cuts lead to dollar weakness, this could accelerate Bitcoin adoption in emerging markets as a hedge against local currency depreciation.
The Asian markets, particularly China despite its official ban on cryptocurrency trading, remain influential in Bitcoin price dynamics. Any shifts in Chinese policy toward cryptocurrencies, or changes in how Chinese investors access Bitcoin through offshore channels, could have significant impacts on global prices. The recent rally has already seen increased activity from Asian trading hours, suggesting renewed interest from this important region.
Looking Ahead: The Path Forward
As markets digest the implications of Powell's Jackson Hole speech, the path forward for Bitcoin appears more constructive than it has in months. The combination of potential monetary easing, continued institutional adoption, and improving regulatory clarity creates a favorable backdrop for digital assets. However, the journey is unlikely to be smooth, with volatility remaining a defining characteristic of cryptocurrency markets.
The September Federal Open Market Committee meeting looms large on the horizon. While markets have largely priced in a rate cut, the magnitude of the cut and the Fed's forward guidance will be crucial in determining whether the current rally has legs. A more aggressive easing stance than currently expected could propel Bitcoin toward new all-time highs, while a more cautious approach might lead to some near-term disappointment.
Beyond monetary policy, several other catalysts could influence Bitcoin's trajectory in coming months. The continued development of the Lightning Network and other scaling solutions could enhance Bitcoin's utility as a payment method. Growing environmental consciousness and Bitcoin mining's increasing use of renewable energy could address one of the persistent criticisms of the cryptocurrency. Additionally, further institutional adoption, particularly from major corporations adding Bitcoin to their treasury reserves, could provide fundamental support for prices.
Conclusion: A Pivotal Moment in Bitcoin's Evolution
The surge past $116,000 following Jerome Powell's dovish signals represents more than just another rally in Bitcoin's volatile history. It potentially marks a pivotal moment in the cryptocurrency's evolution from speculative asset to recognized component of the global financial system. The fact that Federal Reserve policy now has such direct and immediate impacts on Bitcoin prices underscores how integrated cryptocurrencies have become with traditional financial markets.
For investors and observers, the current environment presents both opportunities and challenges. The potential for significant gains exists, particularly if the Federal Reserve follows through with monetary easing and the global economy achieves the sought-after "soft landing." However, the risks remain substantial, and the cryptocurrency market's inherent volatility means that dramatic reversals remain possible.
What seems clear is that Bitcoin has successfully weathered another period of adversity and emerged with renewed momentum. The quiet accumulation by whales during the recent downturn, followed by the explosive response to Powell's speech, demonstrates that demand for digital assets remains robust among sophisticated investors. As the financial world continues to evolve and adapt to technological innovation, Bitcoin's role appears increasingly assured, even if its exact price trajectory remains uncertain.
The coming weeks and months will be crucial in determining whether this latest surge represents the beginning of a new bull cycle or merely another rally within a broader consolidation phase. What is certain is that Bitcoin continues to capture the imagination of investors worldwide, and its correlation with macro policy decisions ensures it will remain at the center of financial market discussions for the foreseeable future. As traditional monetary policy reaches its limits and financial innovation accelerates, Bitcoin stands ready to play an increasingly important role in the global financial ecosystem, with the $116,000 level potentially representing just another milestone on a much longer journey.
BTCUSD03V2025 trade ideas


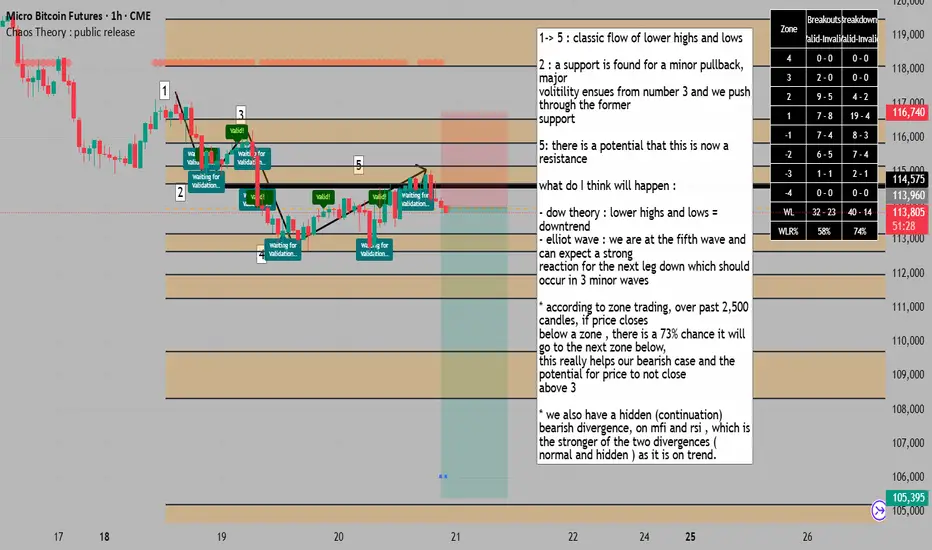
a second attempt at entering the downtrend, SL above solid=SELLs1-> 5 : classic flow of lower highs and lows
2 : a support is found for a minor pullback, major
volitility ensues from number 3 and we push through the former
support
5: there is a potential that this is now a resistance
what do I think will happen :
- dow theory : lower highs and lows = downtrend
- elliot wave : we are at the fifth wave and can expect a strong
reaction for the next leg down which should occur in 3 minor waves
* according to zone trading, over past 2,500 candles, if price closes
below a zone , there is a 73% chance it will go to the next zone below,
this really helps our bearish case and the potential for price to not close
above 3
* we also have a hidden (continuation) bearish divergence, on mfi and rsi , which is the stronger of the two divergences ( normal and hidden ) as it is on trend.
a return to resistance provides a good rr opportunity for = SELL1-> 5 : classic flow of lower highs and lows
2 : a support is found for a minor pullback, major
volitility ensues from number 3 and we push through the former
support
5: there is a potential that this is now a resistance
what do I think will happen :
- dow theory : lower highs and lows = downtrend
- elliot wave : we are at the fifth wave and can expect a strong
reaction for the next leg down which should occur in 3 minor waves
* according to zone trading, over past 2,500 candles, if price closes
below a zone , there is a 65% chance it will go to the next zone below,
this really helps our bearish case and the potential for price to not close
above 5, a stop in the zone with a SL behind the number 5 and target the
next zone would provide a good RR
* we also have a hidden (continuation) bearish divergence, on mfi and rsi , which is the stronger of the two divergences ( normal and hidden ) as it is on trend.

Bitcoin Goes Bullish · Altcoins Market Resumes GrowingBitcoin and the altcoins market is about to perform one of those surprise moves that it really loves, a huge major advance; we are going up.
How are you feeling in this wonderful new week my friend?
I am happy to have your attention. Please, continue reading below and let me know in the comments what you think about this analysis.
The markets are open, people are trading, buying and selling while prices are rising. Bitcoin is no longer going down and the retrace was very small. The total drop so far amounts to less than 10%, but it is wise to consider that the current range is not $110,000 to $120,000 but $100,000 to $120,000. It is a wide range.
The new all-time high is not a major new level but instead a double-top compared to mid-July. Seeing how a double-top made no impression on the bears, seeing how the market continues super strong, we can easily predict that the bull market is not over and Bitcoin will continue to grow. What about Litecoin?
Chainlink is no longer trading at bottom prices but it has plenty of room available for growth. It is not at the bottom but certainly not a new all-time high either. The same for Cardano. Will it stop growing and enter a bear market when it was already doing so great? No, it will continue growing long-term.
Hedera also grew nicely and a small portion of the market is in the same boat. The bigger part though is still trading near support but not for long. August is the last chance to get those still behind while prices are still low. The fact that many projects are ahead, high up, confirms where the market is headed.
If you think a few years back, everything was down including Bitcoin.
If you think last year, everything was down but Bitcoin.
If you see how the market is doing now, many projects are very strong and growing. This reveals what is coming to the rest of the market.
First one, then two, then six, then twenty and then everything grows.
Bitcoin is about to make a surprise move... The entire market is set to grow.
Namaste.

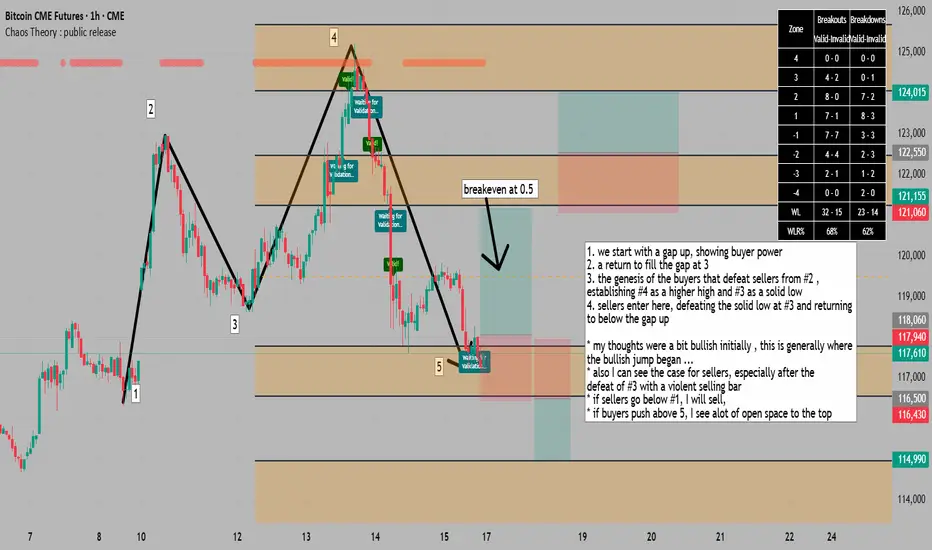
strong sellers return to origin of strong buyers gap, 2 cases...1. we start with a gap up, showing buyer power
2. a return to fill the gap at 3
3. the genesis of the buyers that defeat sellers from #2 ,
establishing #4 as a higher high and #3 as a solid low
4. sellers enter here, defeating the solid low at #3 and returning
to below the gap up
* my thoughts were a bit bullish initially , this is generally where
the bullish jump began ...
* also I can see the case for sellers, especially after the
defeat of #3 with a violent selling bar
* if sellers go below #1, I will sell,
* if buyers push above 5, I see alot of open space to the top
* indicator used is a free chaos theory indicator available on my scripts
a return to proven sellers signals the next leg up = BUY1. a strong uptrend with little to no activity by
buyers resulted in the peak at #1 , exhausted
and unable to go up further due to a lack of interest
by sellers to take the opposing positon, sellers
find this a 'cheap' entry and take us down to 2
2. we can see to the left of 2 a gap up, this is where
buyers were very agressive, and again they find
this a 'cheap'' entry and push us up to 3
3. notice the hard selling activity here, lack of structure
really, I don't think this is a downtrend but a
PROFIT TAKE , one thing to also note, 3 is a higher
high than 1 , logically if you think about it , that means
the buyers at 2 are stronger than the sellers at 1 ,
therefore this is a SOLID LOW , because the buyers have
PROVEN themselves stronger than the former dominant sellers
4. returning to a SOLID low with PROVEN buyers, we have
an opportunity to enter for the next leg up, using
simple logic is makes sense that the buyers are in control,
these are the facts, not emotions or feelings.
* What do I think will happen ?
* we going up , that's my humble opinion
* we have a hidden bullish divergence too if that matters to you,
it adds another set of traders to bump us up a little at least.
* we happen to be at a zone end in chaos theory zones (target reached) , with RSI and MFI
oversold ( zone end reversal)
* we have a 80% follow through rate over the past 2,500 candles, if a candle closes out of an
orange zone then it has a 80% chance over past
2,500 candles to follow through to the next, you can reduce the lookback period and verify for yourself.
* it would make sense to go long, then brekeven once we pass 1st orange zone target and TP at second.

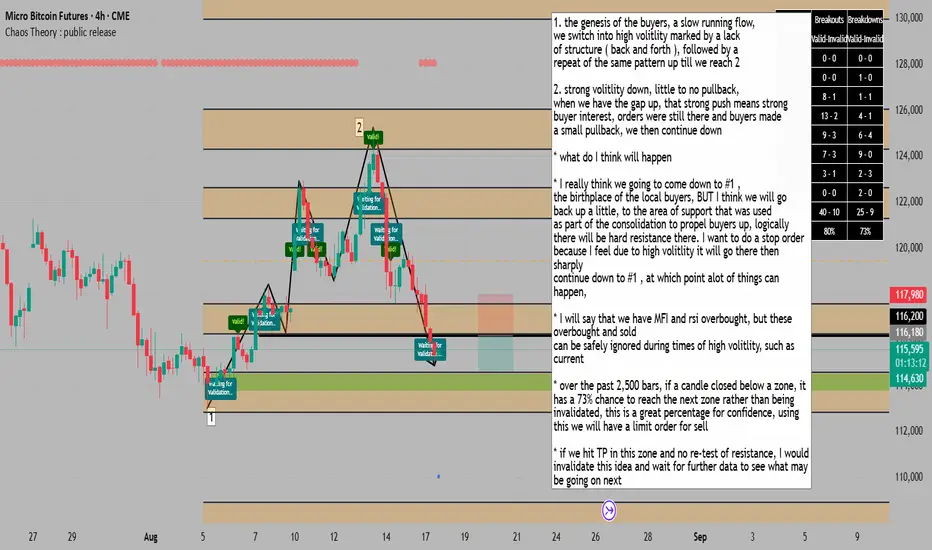
small pullback to resistance, then continue to support=SELL1. the genesis of the buyers, a slow running flow,
we switch into high volitlity marked by a lack
of structure ( back and forth ), followed by a
repeat of the same pattern up till we reach 2
2. strong volitlity down, little to no pullback,
when we have the gap up, that strong push means strong
buyer interest, orders were still there and buyers made
a small pullback, we then continue down
* what do I think will happen
* I really think we going to come down to #1 ,
the birthplace of the local buyers, BUT I think we will go
back up a little, to the area of support that was used
as part of the consolidation to propel buyers up, logically
there will be hard resistance there. I want to do a stop order
because I feel due to high volitlity it will go there then sharply
continue down to #1 , at which point alot of things can happen,
* I will say that we have MFI and rsi overbought, but these overbought and sold
can be safely ignored during times of high volitlity, such as current
* over the past 2,500 bars, if a candle closed below a zone, it has a 73% chance to reach the next zone rather than being invalidated, this is a great percentage for confidence, using this we will have a limit order for sell
* if we hit TP in this zone and no re-test of resistance, I would invalidate this idea and wait for further data to see what may be going on next
BTC CME: Volume is the storyThe key level is $110,000 (Value Area High). Breaking that could see price quickly at $97,500 (Point of Control).
If that level fails, a move toward the $90,000 gap and the major support at $84,000 is likely. The current volatility suggests a larger move is brewing.
Confluence:
@ Bearish divergence between price and Cumulative Delta on the Daily.
@ Unfilled CME and volume gaps below.
@ Seasonality: Watching for historical headwinds as the DXY tends to strengthen (from August onwards) while SPX and BTC enter their weakest period of the year (Aug/Sept).

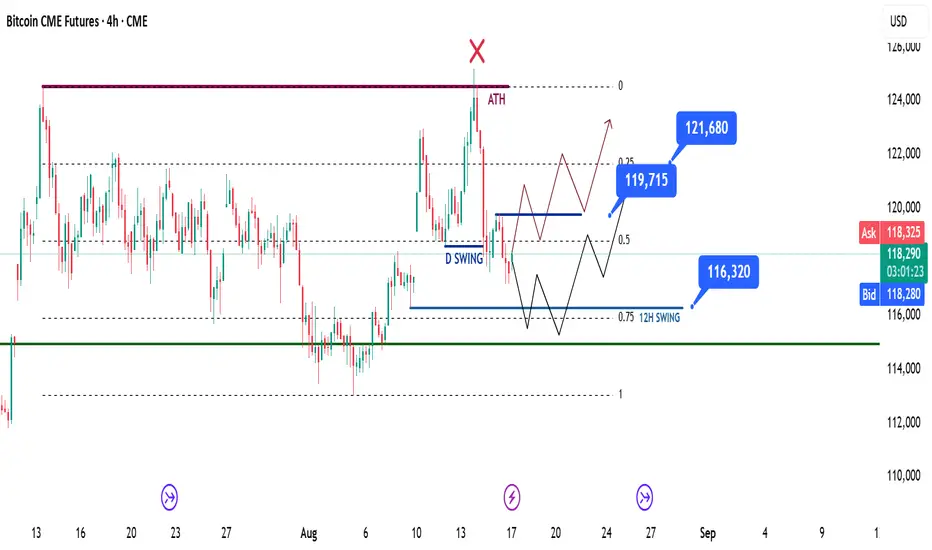
BTC Weekly Recap & Game Plan 17.08.2025BTC Weekly Recap & Game Plan 17.08.2025
📊 Market Sentiment
Overall sentiment remains bullish, supported by expectations of a 0.25% rate cut in the upcoming FOMC meeting. A weakening USD and increasing global risk appetite are creating favorable conditions for further upside in crypto assets.
📈 Technical Analysis
Price ran the daily swing liquidity but couldn’t close above it.
Additionally, price has tapped into the equilibrium level, which makes this a discount zone in my view.
📌 Game Plan
There are two possible scenarios to watch:
First scenario (red):
→ Price closes above 119,725$, then I’ll be looking for entries around 118,750$.
Second scenario (black):
→ Price may retrace further to 116,310$, marked by 12H swing liquidity.
→ This level also aligns with the 0.75 Fibonacci retracement, which is my max discount zone.
🎯 Setup Trigger
I’ll be watching for a 4H–1H break of structure (BOS) to initiate entries.
📋 Trade Management
Stoploss: 4H–1H swing low confirming the BOS
Targets:
TP1: 121,680$
TP2: 124,500$
💬 Like, follow, and comment if you find this setup valuable!
⚠️ Disclaimer: This content is for informational and educational purposes only and does not constitute financial, investment, or trading advice. Always do your own research before making any financial decisions.
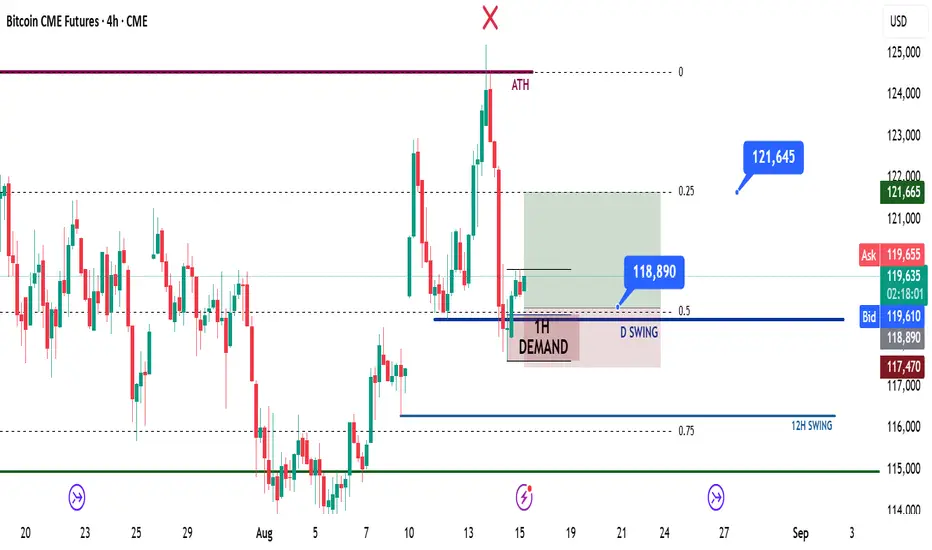
BTC Daily Recap & Game Plan – 15.08.2025BTC Daily Recap & Game Plan – 15.08.2025
📊 Market Sentiment
Overall sentiment remains bullish, supported by expectations of a 0.25% rate cut in the upcoming FOMC meeting. A weakening USD and increasing global risk appetite are creating favorable conditions for further upside in crypto assets.
📈 Technical Analysis
Price has started retracing into the daily swing level and the 0.5 Fibonacci zone, as anticipated in my previous Bitcoin daily update post (linked in the attachment, please check).
We have now seen a 1H break of structure following liquidity grabs.
📌 Game Plan
I will be looking for an entry around the $118,800 level, as there is a 1H demand zone that could support a move higher.
📋 Trade Management
Entry: $118,800
SL: $117,000
TP: $121,600
💬 Like, follow, and comment if you find this setup valuable!
Disclaimer: This content is for informational and educational purposes only and does not constitute financial, investment, or trading advice. Always do your own research before making any financial decisions.
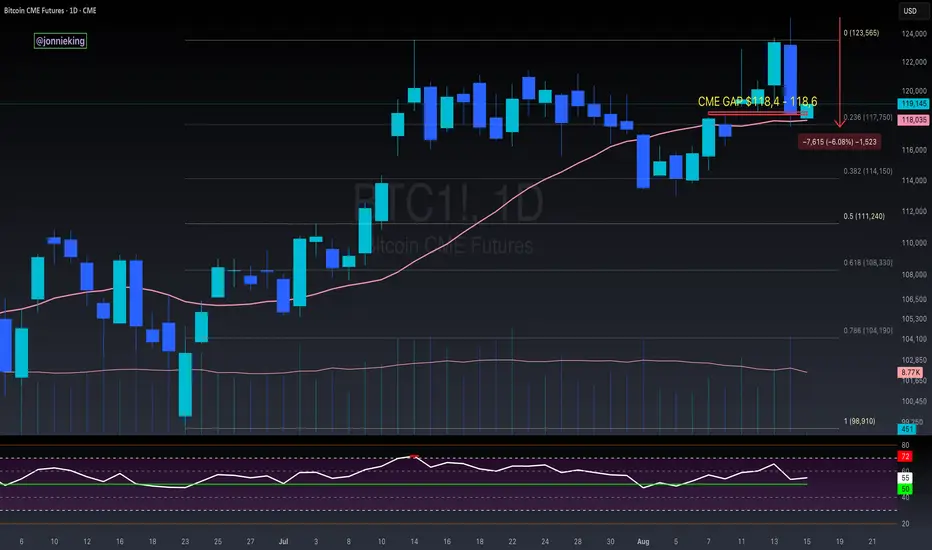
$BTC Bearish Engulfing Candle AlertGOOD NEWS:
-CME Gap was completely filled.
-PA is still above the 20DMA.
BAD NEWS:
-Very concerning Bearish Engulfing candle on the Daily Close.
-Volume confirms the change in trend.
MY TAKE: I wouldn't be surprised to see the market rally into a low liquidity weekend and dump hard on Monday.
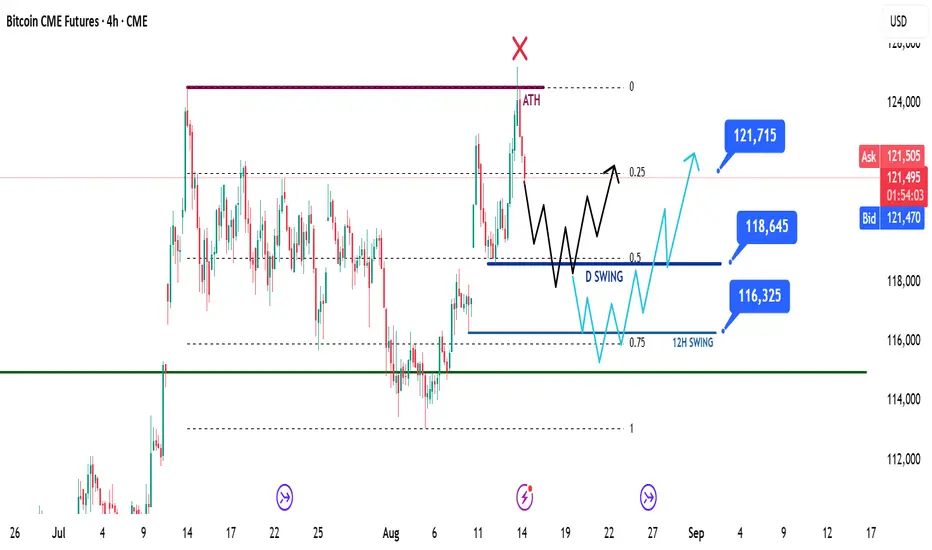
BTC Daily Recap & Game Plan 14.08.2025BTC Daily Recap & Game Plan 14.08.2025
📊 Market Sentiment
Overall sentiment remains bullish, supported by expectations of a 0.25% rate cut in the upcoming FOMC meeting. A weakening USD and increasing global risk appetite are providing favorable conditions for further upside in crypto assets.
📈 Technical Analysis
Price ran to all-time highs and faced rejection there.
The close below the all-time high level indicates that price may now seek opposite-side liquidity (buyers).
Historically, Bitcoin often consolidates within a range after running all-time highs, collecting more liquidity before continuing upward.
📌 Game Plan
I expect two possible scenarios:
1️⃣ Run the daily swing low and hit the equilibrium of the range at $118,645, then bounce and move up towards $121,750.
2️⃣ Run the 12H swing low and hit the 0.75 level of the max discount range at $116,325, then bounce and move up.
🎯 Setup Trigger
I will be watching for a 4H break of structure when either scenario occurs.
📋 Trade Management
Stop-loss: Below the 4H swing low that confirms the break of structure.
Target: TP1 at $121,750 and possible new highs. Targets will be updated depending on structure.
💬 Like, follow, and comment if you find this setup valuable!
Disclaimer: This is not financial advice. The content is for informational and educational purposes only and reflects personal opinions.
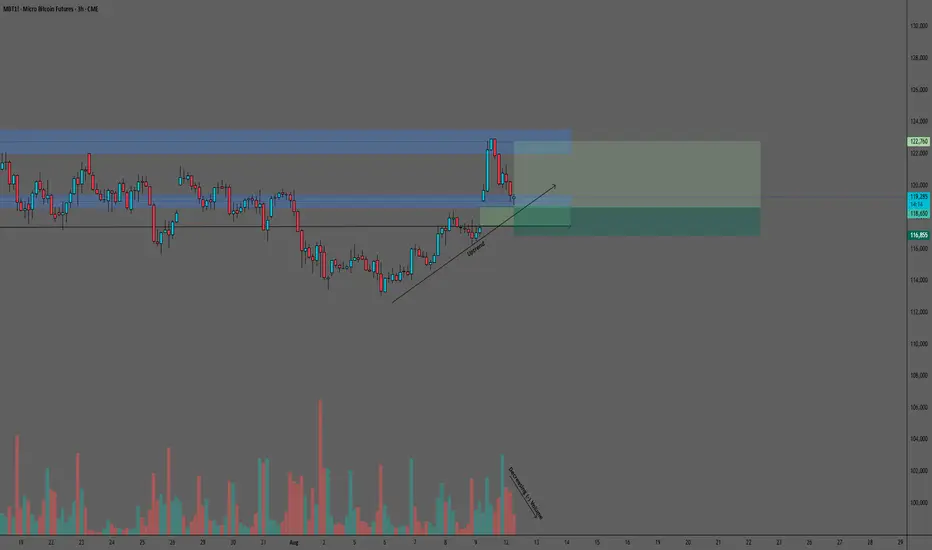
MBT (Micro Bitcoin Futures) Trade Setup – 3H TimeframeBullish Setup at Key Support Level with Declining Selling Pressure
MBT has recently encountered resistance at the 122000-123500 zone, which previously marked its all-time high on July 14, 2025. The subsequent pullback to the 118650-119400 support area presents an intriguing bullish opportunity, particularly given the declining negative volume that suggests waning selling pressure.
The 3-hour chart reveals a compelling technical setup, with the current price action testing a crucial support zone. What makes this setup particularly interesting is the moderate but decreasing negative volume during the recent decline. This volume characteristic often indicates accumulation and suggests that buyers are defending this support level.
Illustrative Setup: A Buy Limit order positioned at 118650 capitalizes on the bottom of the current support zone. The Stop Loss at 116855 is strategically placed below both the August 9 price gap and the prevailing uptrend line, which would clearly invalidate the bullish thesis if breached conjointly. A Take Profit target at 122765, representing the midpoint of the recent high zone (122000-123500), offers an attractive 2.29:1 reward-risk ratio.
Key considerations: The combination of declining selling volume, clear support zone, and the presence of an upward trendline since August 6 provides multiple technical confirmations for this bullish setup. However, traders should remain vigilant of broader market conditions and consider implementing partial profit-taking strategies given the significant distance to the target.
This analysis is provided solely for educational and entertainment purposes and does not constitute any form of financial or investment advice. Always manage your risk and trade responsibly.
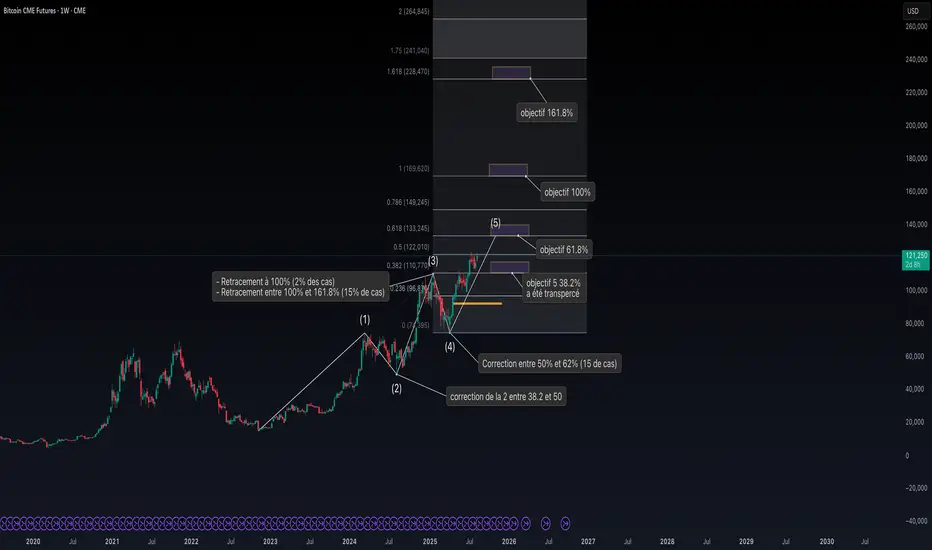
Bitcoin – wave 5 Targets (Elliott Wave + Fibonacci)
Bitcoin appears to be in the final wave 5 of the current bullish cycle. After breaking the 38.2% Fibonacci extension target, focus shifts to the next major levels:
61.8% extension ≈ $133,245
100% extension ≈ $169,620
161.8% extension ≈ $228,470
Historically, wave 5 often tops between 61.8% and 100% extensions, but strong parabolic runs can push to 161.8%.
Key watch: a sustained break above $133K would significantly increase odds of exploring $170K+
Bitcoin Technical Update It’s been nearly a month since our last look at CRYPTOCAP:BTC , and the uptrend from April is still firmly in place. 📈
🔹 Price recently bounced sharply from the trendline, supported by the 55-day MA (blue line).
🔹 Immediate upside focus: 123,615 (July high)
🔹 Fibonacci checkpoints: approx. 127K & 134K
🔹 Longer-term target: 145,000
The weekly chart suggests this is a “midpoint” move — using the flagpole measurement from the breakout, we’re eyeing that 145,000 level. Stops? I’d now raise them to just under the uptrend at 115,000
Trend intact. Momentum alive.
Disclaimer:
The information posted on Trading View is for informative purposes and is not intended to constitute advice in any form, including but not limited to investment, accounting, tax, legal or regulatory advice. The information therefore has no regard to the specific investment objectives, financial situation or particular needs of any specific recipient. Opinions expressed are our current opinions as of the date appearing on Trading View only. All illustrations, forecasts or hypothetical data are for illustrative purposes only. The Society of Technical Analysts Ltd does not make representation that the information provided is appropriate for use in all jurisdictions or by all Investors or other potential Investors. Parties are therefore responsible for compliance with applicable local laws and regulations. The Society of Technical Analysts will not be held liable for any loss or damage resulting directly or indirectly from the use of any information on this site.

Bitcoin CME Closing Price: The Key to Next Week’s TrendIn this video I cover the CME closing price and go through a plan which includes a gap to the upside and a short squeeze before gravitating to the downside for lower targets .
I also give a bias for higher prices if the VAH is claimed .
This idea is modelled on the daily time frame and can play out over the course of the following week or more .
I also look at the Eth/Btc pair and the Btc dominance chart and marry whats happening on those charts with this idea .
When looking at BTC I use order flow software to further support my bias and the confluences I present in the chart.
If you have any questions then leave them below .
Support my work with a boost and Safe trading

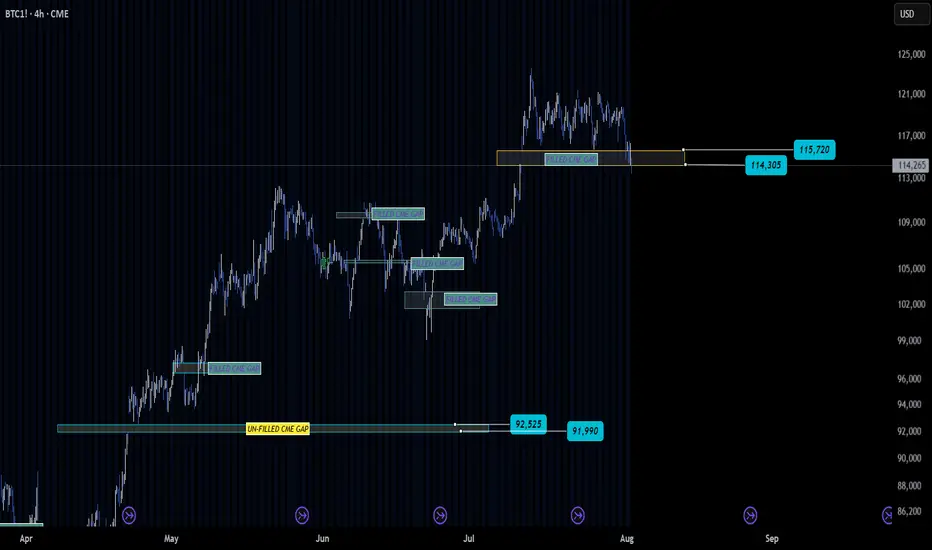
BTC Fills Key CME Gap — Eyes Now on What’s Next✅ The CME gap between 115700–114300 has officially been filled — a level many traders were watching closely.
What happens here could shape BTC’s next major move 🎯
Will we see consolidation, reversal, or continuation? Price action at this level deserves attention.
🕵️ Worth noting: one more unfilled gap remains at 92500–91900 📉
While CME gaps aren’t guaranteed to fill, history shows they often do — and traders are tracking that lower level.
👀 Watch this zone closely — market memory is strong around gap fills.
What’s your bias from here?
Not financial advice.
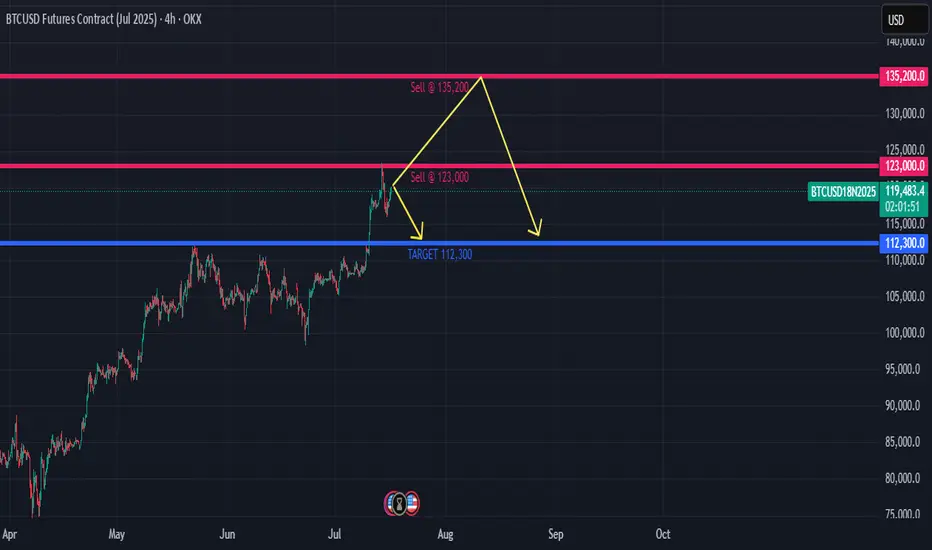
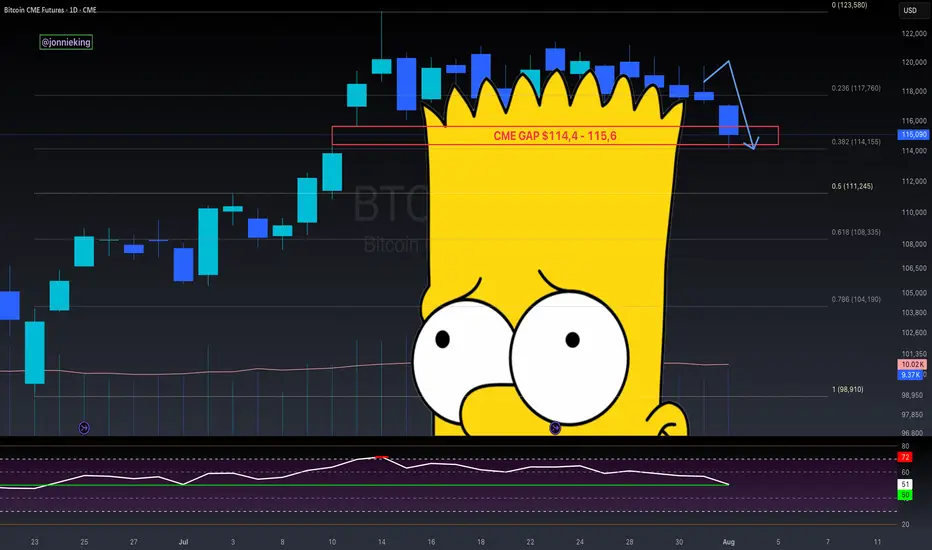
$BTC CME Gap + Bad Bart = Easiest Short EverCME Gap + Bad Bart is like taking candy from a baby 👨🏻🍼
Look at that textbook bounce off the .382 Fib 🤓
Pain ain’t over folks.
RSI still shows room on the downside 📉
Global Liquidity drain on the 4th.
Looking like the 50% Gann Level is next ~$111k
Get those bids in 😎
And never forget the BullTards who were telling you about the “Bollinger Band Squeeze” and UpOnly season 🫠
BITCOIN CME GAP IS FILLING RIGHT NOW!#Bitcoin CME Futures
Bitcoin is dipping — and all signs point to the CME gap getting filled.
Historically, these dips have been aggressively bought, so a strong bounce from here looks likely.

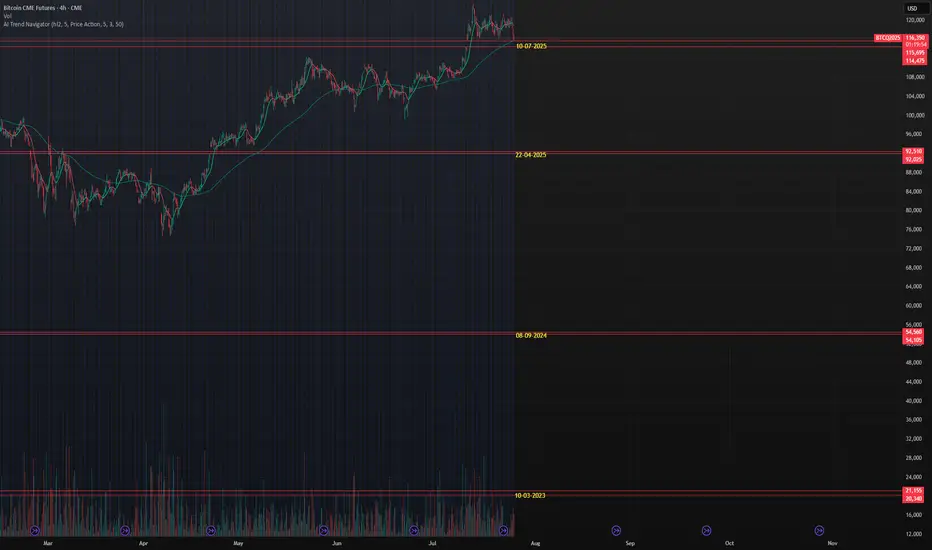
CME Gaps, which will be filled?Currently 4 gaps in the CME futures chart, running back till 2023 (march). What gap will be filled at some point in the future or will some remain open....
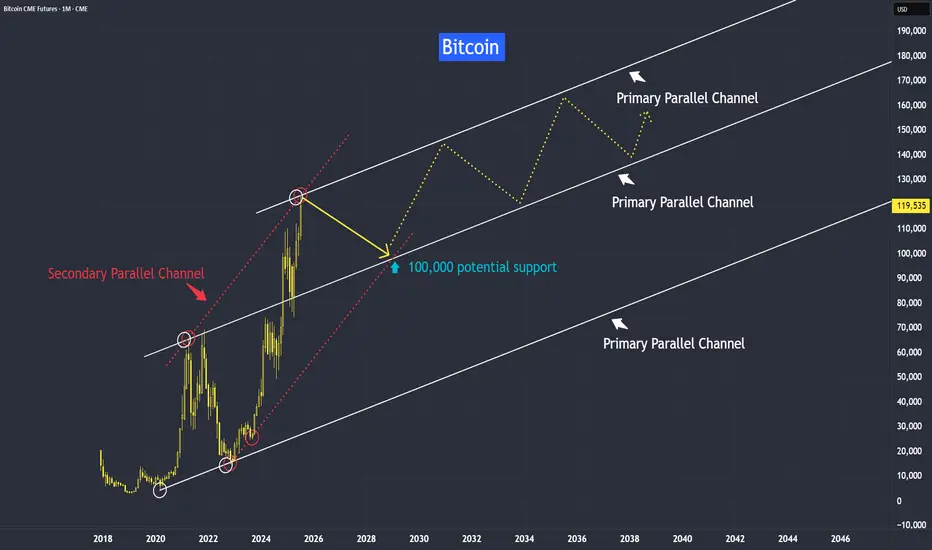
Bitcoin New Support at 100,000Bitcoin’s trend has been growing from strength to strength — and it’s likely to stay that way. Why?
This trend isn’t driven purely by speculation; it’s supported by strong fundamental reasons.
One of the most widely debated topics in finance today is the comparison between Bitcoin and gold. While both are viewed as stores of value, their long-term roles may diverge significantly.
Yes, gold and bitcoin have been moving up in near perfect synchronization with inflation.
Gold is traditionally seen as an inflation hedge, and since June 2022 — when inflation peaked at 9% — we’ve seen both gold and Bitcoin trend higher up to the present day.
Instead of asking why the Fed isn’t cutting interest rates despite the decline in CPI, perhaps we should ask: why the Fed prefers to maintain rates at the current level. What are they seeing with the data and the developments?
When both gold and Bitcoin hold steady at these elevated levels, it suggests that investors still believe the threat of rising inflation remains valid.
In all bull markets, the path is never straightforward — it’s often jagged along with volatility.
What distinguishes a continuing bull market - is the formation of higher lows along its timeline.
However, like gold which we recently discussed, Bitcoin may be approaching a medium-term resistance.
In this first week of this year tutorial, we observed an inverted hammer in the last month of 2024, suggesting a potential correction in Bitcoin, but yet seeing support at around 82,000 level.
As anticipated, the inverted hammer was followed by a correction here toward our support level at around 82,000, with some false breaks along. From that point, the market resumed its upward climb.
Now, it appears to be encountering resistance again.
Still, as long as the market continues to form higher lows, and the threat of rising inflation still remain, the bull trend should remain intact.
This is how the projection might look when mapped with a trendline.
We observed that the primary parallel trendline is reacting in relationship to each other. Next I would like to explore its secondary channel.
Please don’t interpret this as a literal path. Instead, I hope it serves as a guideline to help you form your own projections as the market evolves.
Gold is preferred by older generations, central banks, and conservative investors. Deeply entrenched in traditional finance and cultural value systems.
Cryptocurrency has a rapid adoption by younger investors, tech-native users, and institutions. Millennials and Gen Z are more likely to trust cryptographic assets than governments or fiat systems.
I will keep an open mind to both inflation hedge asset and their instruments.
Its video version for this tutorial:
Disclaimer This analysis is based on technical studies and does not constitute financial advice. Please consult your licensed broker before investing.
Mirco Bitcoin Futures and Options
Ticker: MBT
Minimum fluctuation:
$5.00 per bitcoin = $0.50 per contract
CME Real-time Market Data help identify trading set-ups in real-time and express my market views. If you have futures in your trading portfolio, you can check out on CME Group data plans available that suit your trading needs www.tradingview.com