NATGAS What Next? SELL!
My dear friends,
NATGAS looks like it will make a good move, and here are the details:
The market is trading on 5.337 pivot level.
Bias - Bearish
Technical Indicators: Supper Trend generates a clear short signal while Pivot Point HL is currently determining the overall Bearish trend of the mar
Dutch TTF Natural Gas Futures
No trades
Contract highlights
Related commodities

Natural Gas MCX Future - Intraday Analysis - 4th Dec., 2025MCX:NATURALGAS1!
Natural Gas MCX Futures — Chart Pathik Intraday Levels for 04-Dec-2025 (15m Framework)
(If these levels add value to your trades, a quick boost or comment goes a long way in supporting this free content and keeping our trading community thriving!)
Natural Gas Futures are tradin

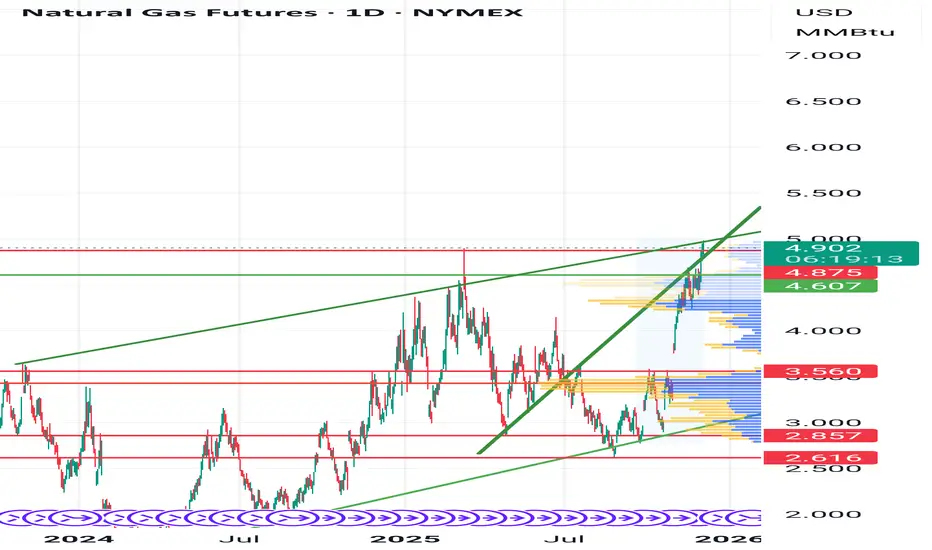
NATURAL GAS broke parabolically and the rise won't stop here.Back in late August (see chart below), we gave a bold strong buy signal on Natural Gas (NG), right at the very bottom of its Higher Lows structure:
As you can see, it is well on its way to hitting our 6.400 Target as it rose parabolically.
This time, we revisit NG's multi-year Cycles, a chart

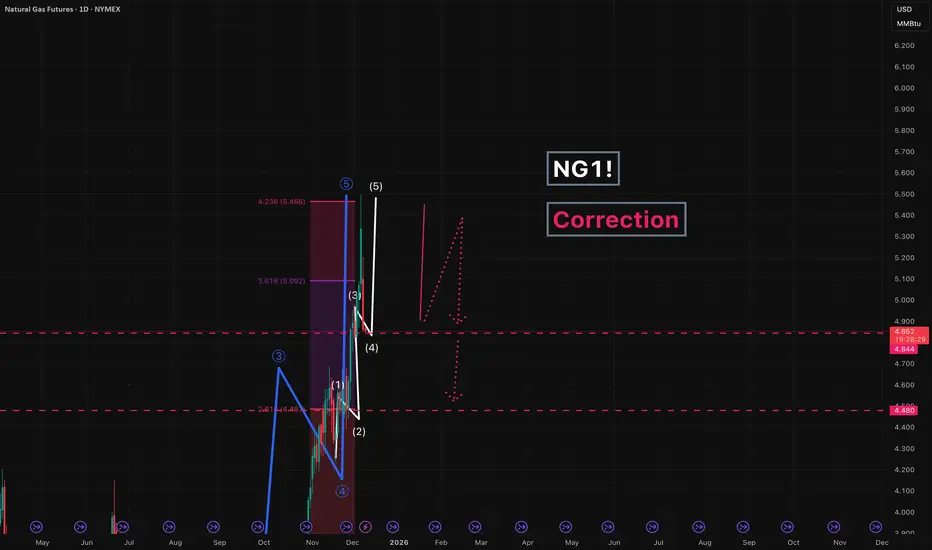
NG1! - correctionWe are currently correcting the impulsive move in Natural Gas.
First, we expect a pullback toward 4.850 (a move that is already in progress), followed by a continuation down into the 4.480 area.
---
Please subscribe and leave a comment.
You’ll get new information faster than anyone else.
---
Natural Gas Stock Forecast | Oil | Dollar | Silver | GoldNatural Gas Stock Forecast | Oil | Dollar | Silver | Gold
NYMEX:NG1! NYMEX:CL1! COMEX:GC1! COMEX:SI1!

At the resistance primed for reversal At the top of the channel, if reverses from here and is confirmed, can go back to the support lvl in next few months
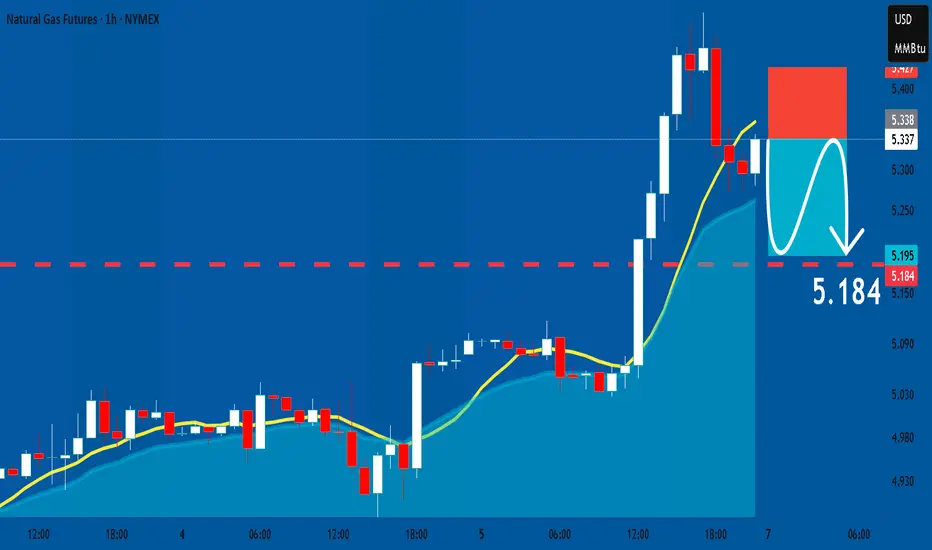
NATGAS: Short Signal with Entry/SL/TP
NATGAS
- Classic bearish formation
- Our team expects fall
SUGGESTED TRADE:
Swing Trade
Sell NATGAS
Entry Level - 5.338
Sl - 5.427
Tp - 5.184
Our Risk - 1%
Start protection of your profits from lower levels
Disclosure: I am part of Trade Nation's Influencer program and receive a month
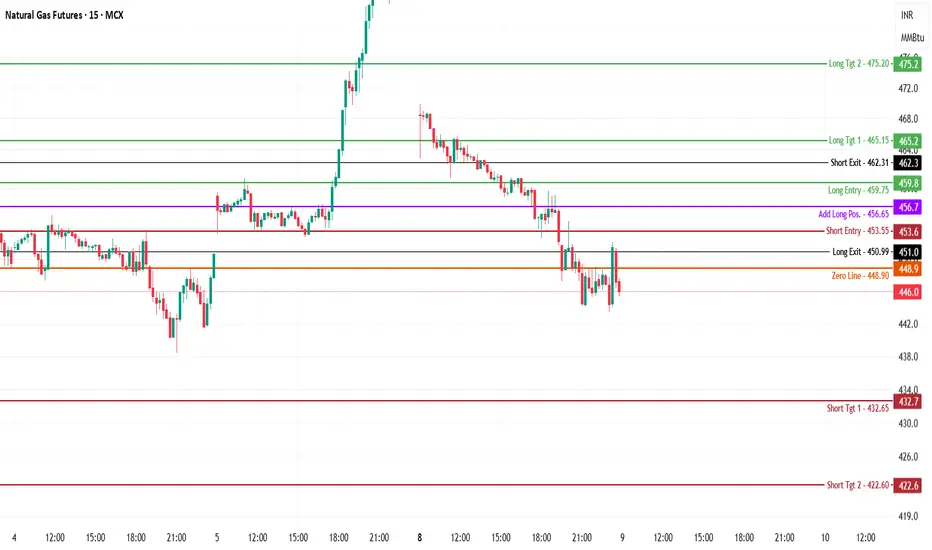
Natural Gas MCX Futures — Intraday Technical Analysis - 9 Dec.MCX:NATURALGAS1!
Natural Gas MCX Futures — Chart Pathik Intraday Levels for 09-Dec-2025
(If these levels add value to your trades, a quick boost or comment goes a long way in supporting this free content and keeping our trading community thriving!)
Natural Gas Futures are trading near 446, slid
NATGAS Free Signal! Sell!
Hello,Traders!
NATGAS price is reacting from a clear horizontal supply area after an aggressive displacement down, suggesting smart-money orderflow remains bearish. A retest into the imbalance aligns with premium pricing before continuation lower.
--------------------
Stop Loss: 4.724$
Take Profi

NATGAS Under Pressure! SELL!
My dear friends,
My technical analysis for NATGAS is below:
The market is trading on 4.862 pivot level.
Bias - Bearish
Technical Indicators: Both Super Trend & Pivot HL indicate a highly probable Bearish continuation.
Target - 4.675
About Used Indicators:
A pivot point is a technical analysis

See all ideas
Summarizing what the indicators are suggesting.
Neutral
SellBuy
Strong sellStrong buy
Strong sellSellNeutralBuyStrong buy
Neutral
SellBuy
Strong sellStrong buy
Strong sellSellNeutralBuyStrong buy
Neutral
SellBuy
Strong sellStrong buy
Strong sellSellNeutralBuyStrong buy
A representation of what an asset is worth today and what the market thinks it will be worth in the future.
Displays a symbol's price movements over previous years to identify recurring trends.
Frequently Asked Questions
The current price of Dutch TTF Natural Gas Futures is 24.396 EUR / MWH — it has risen 0.12% in the past 24 hours. Watch Dutch TTF Natural Gas Futures price in more detail on the chart.
Track more important stats on the Dutch TTF Natural Gas Futures chart.
The nearest expiration date for Dutch TTF Natural Gas Futures is Dec 29, 2033.
Traders prefer to sell futures contracts when they've already made money on the investment, but still have plenty of time left before the expiration date. Thus, many consider it a good option to sell Dutch TTF Natural Gas Futures before Dec 29, 2033.
Open interest is the number of contracts held by traders in active positions — they're not closed or expired. For Dutch TTF Natural Gas Futures this number is 0.00. You can use it to track a prevailing market trend and adjust your own strategy: declining open interest for Dutch TTF Natural Gas Futures shows that traders are closing their positions, which means a weakening trend.
Buying or selling futures contracts depends on many factors: season, underlying commodity, your own trading strategy. So mostly it's up to you, but if you look for some certain calculations to take into account, you can study technical analysis for Dutch TTF Natural Gas Futures. Today its technical rating is strong sell, but remember that market conditions change all the time, so it's always crucial to do your own research. See more of Dutch TTF Natural Gas Futures technicals for a more comprehensive analysis.