NATGAS Technical Analysis! BUY!
My dear subscribers,
NATGAS looks like it will make a good move, and here are the details:
The market is trading on 3.462 pivot level.
Bias - Bullish
Technical Indicators: Both Super Trend & Pivot HL indicate a highly probable Bullish continuation.
Target - 3.497
About Used Indicators:
The average true range (ATR) plays an important role in 'Supertrend' as the indicator uses ATR to calculate its value. The ATR indicator signals the degree of price volatility.
Disclosure: I am part of Trade Nation's Influencer program and receive a monthly fee for using their TradingView charts in my analysis.
———————————
WISH YOU ALL LUCK
Trade ideas

NATGAS WILL GROW|LONG|
✅NZD_USD fell again to retest the support of 3.40$
But it is a strong key level
So I think that there is a high chance
That we will see a bullish rebound and a move up
LONG🚀
✅Like and subscribe to never miss a new idea!✅
Disclosure: I am part of Trade Nation's Influencer program and receive a monthly fee for using their TradingView charts in my analysis.

Natural Gas | Oil | Dollar | Silver | Gold Price ForecastNatural Gas | Oil | Dollar | Silver | Gold Price Forecast
NYMEX:NG1! NYMEX:CL1! COMEX:GC1! COMEX:SI1!

NG1! BEARS ARE STRONG HERE|SHORT
NG1! SIGNAL
Trade Direction: short
Entry Level: 3.461
Target Level: 3.044
Stop Loss: 3.737
RISK PROFILE
Risk level: medium
Suggested risk: 1%
Timeframe: 12h
Disclosure: I am part of Trade Nation's Influencer program and receive a monthly fee for using their TradingView charts in my analysis.
✅LIKE AND COMMENT MY IDEAS✅

NATGAS: Forecast & Technical Analysis
The recent price action on the NATGAS pair was keeping me on the fence, however, my bias is slowly but surely changing into the bullish one and I think we will see the price go up.
Disclosure: I am part of Trade Nation's Influencer program and receive a monthly fee for using their TradingView charts in my analysis.
❤️ Please, support our work with like & comment! ❤️

Natural Gas can be short Natural Gas can be short for while target are marked let see the target will be achieved or not.

Natgas - good risk reward for short term longs at CMP. Natgas MCX at 302.7
Expect one wave higher is pending that should take it above 330 towards 336 or 355.
Long with SL at 295

Natural Gas | Oil | Dollar | Silver | Gold Price ForecastNatural Gas | Oil | Dollar | Silver | Gold Price Forecast
COMEX:GC1! COMEX:SI1! TVC:DXY NYMEX:CL1!

NATURALGAS - BEARISH Trend/ D cup formation confirmed?NATURALGAS – Weekly Update
Timeframe: 1HR | Symbol: NATURALGAS1! (MCX)
Pattern : D Cup Formation Completed
Natural Gas has formed a textbook "D Cup" pattern, indicating a rounded top reversal structure. After a parabolic rise in late April, prices have gradually given up gains, confirming the pattern with a breakdown toward 270.
Resistance Zone: 295 – 298
Immediate Support: 284 → 278.9 (EMA 55)
Breakdown below ₹283.9 can accelerate selling pressure.
Weekly View:
Bearish momentum increasing post pattern completion
Volume spike adds confirmation to recent breakdown
Watch for EMA resistance retests or breakdown below ₹283 for next short opportunity
Strategy:
Sell on rise below 292–295
#NaturalGas #MCXNG #CupFormation #TrendReversal #CommodityTrading #PriceAction #NGFutures

NG 5/22/25 - Re-engaging the Short side!Here is an update on NG (Natural Gas Futures) via analyzing Cumulative Delta Volume (CDV), divergence between price and the Money Flow Index (MFI), and the 4h and D McGinley Moving Averages!
Happy trading, and I hope the video was helpful!

NATGAS LOCAL SHORT|
✅NATGAS has retested a key resistance level of 3.50$
And as the pair is already making a bearish pullback
A move down to retest the demand level below at 3.30$ is likely
SHORT🔥
✅Like and subscribe to never miss a new idea!✅
Disclosure: I am part of Trade Nation's Influencer program and receive a monthly fee for using their TradingView charts in my analysis.

We may still move lower , lets check the weekly closeThis channel is not providing individualized trading or investment advice, nor is it a banking service, brokerage service, trading service, investment service or money management service

NG1! BEARS ARE STRONG HERE|SHORT
NG1! SIGNAL
Trade Direction: short
Entry Level: 3.790
Target Level: 3.302
Stop Loss: 4.116
RISK PROFILE
Risk level: medium
Suggested risk: 1%
Timeframe: 1D
Disclosure: I am part of Trade Nation's Influencer program and receive a monthly fee for using their TradingView charts in my analysis.
✅LIKE AND COMMENT MY IDEAS✅

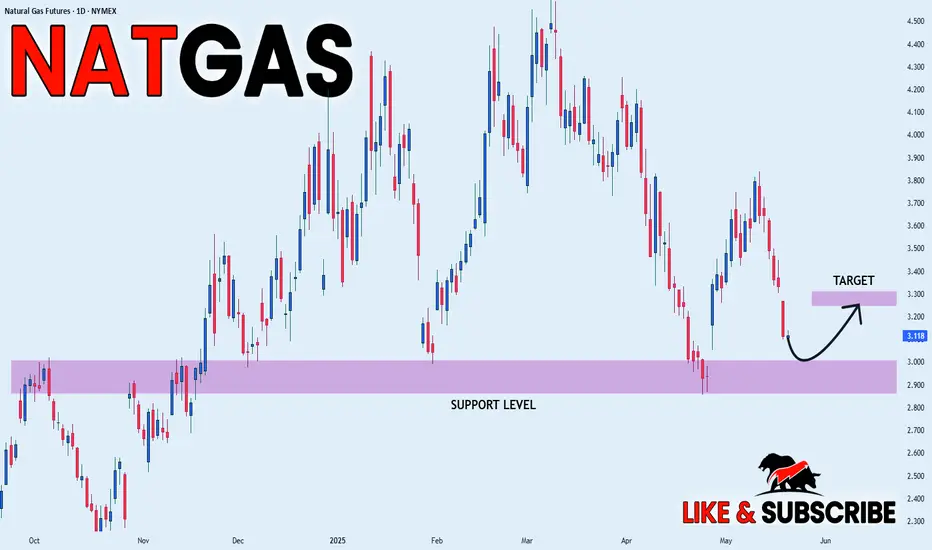
NATGAS SWING LONG|
✅NATGAS is set to retest a
Strong support level below at 2.90$
After trading in a local downtrend from some time
Which makes a bullish rebound a likely scenario
With the target being a local resistance above at 3.26$
LONG🚀
✅Like and subscribe to never miss a new idea!✅
Disclosure: I am part of Trade Nation's Influencer program and receive a monthly fee for using their TradingView charts in my analysis.
Natural Gas | Oil | Dollar | Silver | Gold Price ForecastNatural Gas | Oil | Dollar | Silver | Gold Price Forecast
NYMEX:NG1! CAPITALCOM:NATURALGAS COMEX:GC1! COMEX:SI1!

NATGAS: Long Trade Explained
NATGAS
- Classic bullish pattern
- Our team expects retracement
SUGGESTED TRADE:
Swing Trade
Buy NATGAS
Entry - 3.325
Stop - 3.206
Take - 3.559
Our Risk - 1%
Start protection of your profits from lower levels
Disclosure: I am part of Trade Nation's Influencer program and receive a monthly fee for using their TradingView charts in my analysis.
❤️ Please, support our work with like & comment! ❤️

Natural Gas Price Rejected at Resistance – Bears in Control
The current price ($3.692) is trading below the 20-day simple moving average (middle Bollinger Band), indicating short-term weakness. This often suggests bearish momentum when combined with a failure to close above the mid-band.
In early May, price touched or neared the upper Bollinger Band and was rejected. This indicates strong selling pressure and the inability of bulls to sustain higher prices.
Volume appears higher on red (down) days, while up days have relatively lower volume, suggesting distribution and lack of bullish conviction.
Recent daily candles show long upper wicks, further confirming selling pressure.

NATGAS Will Collapse! SELL!
My dear friends,
My technical analysis for NATGAS is below:
The market is trading on 3.787 pivot level.
Bias - Bearish
Technical Indicators: Both Super Trend & Pivot HL indicate a highly probable Bearish continuation.
Target - 3.487
Recommended Stop Loss - 3.956
About Used Indicators:
A pivot point is a technical analysis indicator, or calculations, used to determine the overall trend of the market over different time frames.
Disclosure: I am part of Trade Nation's Influencer program and receive a monthly fee for using their TradingView charts in my analysis.
———————————
WISH YOU ALL LUCK

Keep Your Confidence with CDV!!!Using Cumulative Delta Volume (CDV) in your analysis can help you remain confident that you are on the RIGHT side of your trade. Here is a video describing how I use CDV in my analysis as well as an example of how I've used it to enter a trade I've recently taken on Natural Gas Futures! (NG)
I hope this has been helpful. Happy trading!

Naturalgas short term Selling Opportunity NaturalGas May Future!
Naturalgas shorting will see Level of Rs 260-250 from CMP Rs302. With SL of Rs320 in upcoming weeks. Sellers will dominate from Rs310 level. If Price sustain below cmp will see downside rally till Rs260-Rs250.

Gas is about to move upThis channel is not providing individualized trading or investment advice, nor is it a banking service, brokerage service, trading service, investment service or money management service

NaturalGas BreakoutBreakout of Naturalgas on 4h timeframe
Dow theory has changed from downtrend to uptrend
Price has now broken above the resistance line

Nat Gas-Holding PatternNat gas is currently still in its long term H&S pattern and it might be forming the right shoulder. As we speak it is holding a bullish Trendline and above the monthly pivot of $3.58 and it rejected the PWH of $3.82 so it seems stuck between support and resistance waiting to see will take charge. I will be looking for long positions on closes above $3.82 and short on closes below $3.58. If we break the PWL or PWH this week that should make way for a 10-15% move to find new support or resistance($4.12 resistance and $3.03 support).
