Cotton price will increaseHere are some recent information that have increased cotton prices:
Drought in Texas: The US state of Texas is a major cotton producer, and the ongoing drought in the state is expected to reduce cotton production by 2.5 million bales in the 2023/24 season.
Reduced cotton production in China: China is the world's largest cotton producer, but the country is also facing challenges in cotton production, including climate change and water scarcity. The Chinese government has forecast a 10% decline in cotton production in the 2023/24 season.
Increased demand for cotton: The global demand for cotton is expected to increase in the coming years, driven by growing demand for apparel and textiles in developing countries.
Weaker US dollar: The US dollar has been weakening against other currencies in recent months, making cotton exports from the US more affordable for buyers in other countries.
COTTON - BUY
Entry: 86.70 - 87.00
TP1: 87.60
TP2: 88.14
SL: 86.25
Cotton No. 2 Futures
No trades
Market insights

CT (Cotton) - 9 months SYMMETRICAL TRIANGLE══════════════════════════════
Since 2014, my markets approach is to spot
trading opportunities based solely on the
development of
CLASSICAL CHART PATTERNS
🤝Let’s learn and grow together 🤝
══════════════════════════════
Hello Traders ✌
After a careful consideration I came to the conclusion that:
- it is crucial to be quick in alerting you with all the opportunities I spot and often I don't post a good pattern because I don't have the opportunity to write down a proper didactical comment;
- since my parameters to identify a Classical Pattern and its scenario are very well defined, many of my comments were and would be redundant;
- the information that I think is important is very simple and can easily be understood just by looking at charts;
For these reasons and hoping to give you a better help, I decided to write comments only when something very specific or interesting shows up, otherwise all the information is shown on the chart.
Thank you all for your support
🔎🔎🔎 ALWAYS REMEMBER
"A pattern IS NOT a Pattern until the breakout is completed. Before that moment it is just a bunch of colorful candlesticks on a chart of your watchlist"
═════════════════════════════
⚠ DISCLAIMER ⚠
The content is The Art Of Charting's personal opinion and it is posted purely for educational purpose and therefore it must not be taken as a direct or indirect investing recommendations or advices. Any action taken upon these information is at your own risk.

we have an new analysis There a new support and resistence line . if candlesticks test support line number is 1 , It would go to 2 resistence area ,

Resistence and Support analysisIf trend go across 89.08 lining , this trend will be bullish and it should test resistance line .
if trend pass 76.90 line ,it would test this 76.90 level . it will be reversed bear trend

cotton about to go Higher in coming weekscotton is on the brink of a significant price increase, poised to break out of its current consolidation phase. The trading contract for July 2023 is currently being traded at a higher rate than the nearby contracts, indicating a premium price in itself. Notably, commercials are accumulating net long positions in the COT (Commitment of Traders) data, reflecting the most bullish sentiment seen since 2020.
These compelling factors, combined with robust fundamental data, lead me to anticipate a notable upward movement in the price of cotton within the next few days or weeks. However, it is important to acknowledge that predicting market movements carries inherent risks, as market conditions can swiftly change, and multiple factors can influence commodity prices

$CT1! Cotton... ICEUS:CT1! Cotton!
Bless ya cotton socks, they say! I been checking the commodity index and things may get funky...
Now I went through sugar, that's looking like it's little over extended, now here's a beautiful chart of cotton!
Let's dive into technicals:
Pattern: Wedge
Highs: 90.15 Lows: 72
Now if we break the lows of 72, I expect 67.55 and then 62.25 areas. However, if we break above the highs of 90.15, I expect 95 and then 105 areas. Now, there are certain things to keep in mind, everyone is discussing it and I've started it since start of the year that key words: Stagflation....and there's another one recession! The market is forward looking...Those that understand economic cycles saw this coming and I well recommending researching into that, as much as technicals are important but it's really important to understand the type of cycle we are in and I had mentioned a little in my past week ahead videos!
Have a great weekend, it's long one for some of us! 🌞
Trade Journal


CT1! Potential For Bearish DropLooking at the H4 chart, my overall bias for CT1! is bearish due to the current price being below the Ichimoku cloud, indicating a bearish market.
Looking for a sell entry at 85.49, where the 23.6% Fibonacci line and overlap resistance is.
Stop loss will be at 88.88, where the recent high is. Take profit will be at 77.50, where the previous swing low is.
Please be advised that the information presented on TradingView is provided to Vantage (‘Vantage Global Limited’, ‘we’) by a third-party provider (‘Everest Fortune Group’). Please be reminded that you are solely responsible for the trading decisions on your account. There is a very high degree of risk involved in trading. Any information and/or content is intended entirely for research, educational and informational purposes only and does not constitute investment or consultation advice or investment strategy. The information is not tailored to the investment needs of any specific person and therefore does not involve a consideration of any of the investment objectives, financial situation or needs of any viewer that may receive it. Kindly also note that past performance is not a reliable indicator of future results. Actual results may differ materially from those anticipated in forward-looking or past performance statements. We assume no liability as to the accuracy or completeness of any of the information and/or content provided herein and the Company cannot be held responsible for any omission, mistake nor for any loss or damage including without limitation to any loss of profit which may arise from reliance on any information supplied by Everest Fortune Group.

COTTON Ascending TriangleICEUS:CT1! reaches the resistance level the third time, reluctant to go down comparing the last two times.

Cotton prices on the stepping stone?As described here - I see the signs are right for a bullish move in cotton.

Trading Week #3, 2023: Cotton Futures Expected to be UPThis is Trading Week #3 (Jan 16-20) 2023.
Data from the past 10 years (2012-2022) shows that Cotton Futures was up 9 years (90%) of time.
Get ready to LONG on Monday!

Cotton Possible Long I m haven't traded in Cotton before but based on my analysis I reckon there is a possibility of long with an entry price between 80-81 with a stop loss at 78.50 and a take profit above the moving avergae at preferably 87-87.50.
Do share your thoughts on this

Cotton Futures ( CT1! ), H4 Potential for Bullish RiseTitle: Cotton Futures ( CT1! ), H4 Potential for Bullish Rise
Type: Bullish Rise
Resistance: 87.97
Pivot: 82.36
Support: 80.37
Preferred case: Looking at the H4 chart, my overall bias for CL1! is bullish due to the current price crossing above the Ichimoku cloud , indicating a bullish market. If this bullish momentum continues, expect price to continue heading towards the resistance at 87.97, where the recent high is.
Alternative scenario: Price may head back down to retest the pivot at 82.36, where the 23.6% Fibonacci line is.
Fundamentals: There are no major news.

CT1! Potential For Bearish DropLooking at the H4 chart, my overall bias for CT1! is bearish due to the current price being below the Ichimoku cloud, indicating a bearish market. Looking for a sell entry at 84.58, where the 23.6% Fibonacci line is. Stop loss will be at 87.97, where the 78.6% Fibonacci line is. Take profit will be at 79.78, where the 50% Fibonacci line and liquidity hotspots are.
Please be advised that the information presented on TradingView is provided to Vantage (‘Vantage Global Limited’, ‘we’) by a third-party provider (‘Everest Fortune Group’). Please be reminded that you are solely responsible for the trading decisions on your account. There is a very high degree of risk involved in trading. Any information and/or content is intended entirely for research, educational and informational purposes only and does not constitute investment or consultation advice or investment strategy. The information is not tailored to the investment needs of any specific person and therefore does not involve a consideration of any of the investment objectives, financial situation or needs of any viewer that may receive it. Kindly also note that past performance is not a reliable indicator of future results. Actual results may differ materially from those anticipated in forward-looking or past performance statements. We assume no liability as to the accuracy or completeness of any of the information and/or content provided herein and the Company cannot be held responsible for any omission, mistake nor for any loss or damage including without limitation to any loss of profit which may arise from reliance on any information supplied by Everest Fortune Group.

Cotton Futures ( CT1! ), H4 Potential for Bullish RiseTitle: Cotton Futures ( CT1! ), H4 Potential for Bullish Rise
Type: Bullish Rise
Resistance: 87.97
Pivot: 82.36
Support: 80.37
Preferred case: Looking at the H4 chart, my overall bias for CL1! is bullish due to the current price crossing above the Ichimoku cloud, indicating a bullish market. If this bullish momentum continues, expect price to continue heading towards the resistance at 87.97, where the recent high is.
Alternative scenario: Price may head back down to retest the pivot at 82.36, where the 23.6% Fibonacci line is.
Fundamentals: There are no major news.

COTTON // rangebound martketThe market made a nice impulse up on the daily, and the correction of this long impulse brought the market into a range.
A break from this range may take the price higher into correction or deeper in the direction of the primary trend, but I would take profit on the short trades at the start of the daily corrective impulse, and wait for a countertrend to target the fibo target zones and the weekly north breakout.
Trade safe! ⚪️⚫️
--------------------------------------------------------------------------------
ANYWAY, a lot of Qs about the direction of the price. But it doesn't matter.
WE JUST REACT!
Remember that trading is a business.
SIZE your TRADES according to your risk aversion!
----------------------------------------------------------

Cotton coats for the winterHello friends.
The price of cotton has been shaved in half by 2 key factors:
1) Largest cotton consumer China closing down with the zero-covid policy
2) Expectations that a recession will reduce cotton demand
Looking at the current price, we think that it's very cheap and that a substantial move to the upside is on the cards. One thing I don't think the market is pricing in is the potential for China to reopen sooner than markets are anticipating. Obviously, this shutdown in China cannot be permanent and will end eventually. It's more a matter of when. And when it does, cotton should print a candle of +10% or even more in a single day.
The other thing that is being ignored by cotton speculators is the potential for producers to cycle through crops. Cotton producers do not have to exclusively be cotton producers -- in particular, they can and will replace their cotton crops with corn crops. This is because corn has only fallen a mere 17% while cotton is down 52%. If farming corn is more profitable, all rational cotton farmers who are able to make the switch will. When they do this, the supply of fresh cotton being created will be reduced.
Another factor impacting cotton is that it might not even be profitable to produce at this price -- the breakeven value is something like 70 cents on average based on what I'm seeing, but many producers are already drowning underwater. If it costs you $0.80 to make cotton, and cotton is trading at $0.75, you would save $0.05 by simply buying cotton rather than producing it -- so you will be forced to either pivot to the production of corn/other crops or to close down your farm for good. The lower the price goes, the more producers go underwater and are forced out of the business. Only the most efficient cotton producers who have the best land and technology will be able to keep going at these prices.
I also think that climate change will be a much longer-term driver of cotton prices in the coming years. A material example of this occurring is that cotton production in Brazil declined by 30 percent due to drought and heatwave. This lower yield and lower production puts a chokehold on supply and will only get worse as extreme weather and heat become increasingly more common and increasingly destructive to crops.
To be clear, we do think demand will decline somewhat due to a recession. People are going to be wasting less money on pointless consumption like clothes they don't need and will throw away, and will be more conscious of how they spend money. But the demand will still be there. The cotton must flow.

Cotton shortPrimary trend changed recently, supporting the short side. All other comments are on the chart.

COTTON // short idea in a nice short trendCOTTON is going south. There was a stop at a weekly technical zone, but it was broken badly, so I assume price is heading south towards the next weekly zone.
Trade safe! ⚪️⚫️
--------------------------------------------------------------------------------
ANYWAY, a lot of Qs about the direction of the price. But it doesn't matter.
WE JUST REACT!
Remember that trading is a business.
SIZE your TRADES according to your risk aversion!
----------------------------------------------------------


COTTON // sideways after reaching weekly local lowHi✋🏽
Price has reached a weekly low from May '21, and buyers made it go 1-2 from the 1-2-3 wave. We are in the 3rd wave moving up, but price can easily go sideways for some time before breaking out of this zone.
The long and the short trigger zone marks the sideways channel.
What do you think???
Trade safe! ⚪️⚫️
--------------------------------------------------------------------------------
ANYWAY, a lot of Qs about the direction of the price. But it doesn't matter.
I JUST REACT!
Thanks for reading my analysis!🤘🏽
Remember that trading is a business.
SIZE your TRADES according to your risk aversion!
----------------------------------------------------------

cotton
double bottom formation
after double bottom formation we can expect to increase the price till 143 dolars

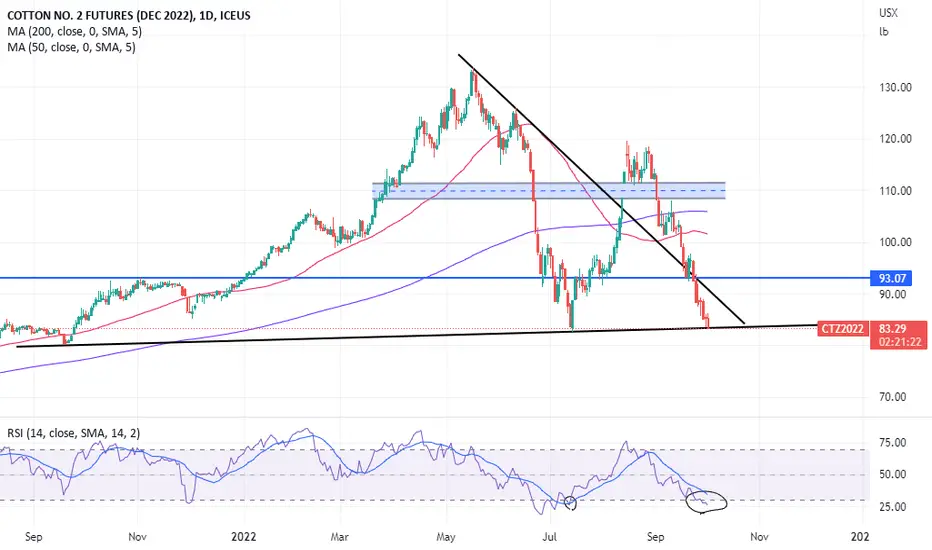
Cotton Testing SupportCotton has been extremely volatile since the May 17th highs with recession fears and weather conditions driving the market lower. The market accelerates its pace lower after the breakdown point on September 1st and is now testing trendline support going back to September of 2021. As we are trading near support and in oversold territory, we could see another bounce to the upside as we saw the last time the market was in this oversold territory, but a close below 82.75 could be a catalyst for more sellers.