Sugar Potential Long as we realize we have divergence on fund managers in red
commercials are at their highest and price went up heavily before when they were at this level
retailers in green super bearish
we see and impulsive move on daily chart and a gap created
waiting for this gap to be filled and entry on lower timeframe backed up by bullish seasonality
Trade Safe
Trade ideas

Fundamentally Setup Markets For This WeekI have identified the following markets are "set-up" for moves of some significance.
This video goes into the fundamental reasons for these trade ideas.
NOTE: I am not looking to go long/short these markets immediately. I will wait for a change in trend on the Daily to get involved with these markets. The tools used to identify these trade setups are not timing tools. The tools do give us an idea of how market participants with significant size and intelligence (commercials) are positioning themselves. The tools also give us an idea of sentiment, valuation, seasonality, and also an idea of what the (usually wrong) public/small traders are doing.
LONGS:
HEATING OIL (HO)
GASOLINE (RBOB)
MEXICAN PESO (6M)
SOYBEANS (ZS)
COTTON (CT)
SUGAR (SB)
SHORTS:
EURO CURRENY (6E)
JAPANESE YEN (6J)
SWISS FRANC (6S)
GOLD (GC)
30 YEAR TREASURIES (ZB)
Good Luck & Good Trading.

Sugar heading for multi-year lowsIs easy to see that the $20 zone is key for sugar, the price broke below it in April and it has not been able to come back above
The price has dropped more than 36% since it peaked in November of 2023 and this week just made a new 52-week low
The next key level is at $17.50, the daily chart already gave a sell or short signal
A follow through below this level could lead to a good gain in the short side
Also, could lower sugar prices lead to higher oil prices?
Remember that oil prices tends to be inversely correlated with the price of sugar, primarily due to its impact on ethanol production and the competing use of sugarcane for fuel versus food.

SBV2024 - Sugar No 11 Futures Long position
Buy limit at 17.88 - 18.38, stoploss 17.70. take profit 19.88

Sugar (sb) macro BULLISHHHWe broke bullish market structure on higher time frame. Price is making higher highs and we are currently at the best risk rewards area. Previous low of $17.20 must remain untapped for bullish continuation. If we do break $17 then most than likely we’ll be expecting a retrace towards the $14 price range but for now it looks great.
From a lower timeframe:
Price is holding well so far but ideally $18.8 must hold.
If we lose this level then $18.4 should be the next area of interest.
As long as we DO NOT break below $18.30, bullish momentum should continue.

Buy Sugar market on open. Stop at: 18.41, tgt at 20.36Looking for a short term reversal to the upside on Sugar. Buy Sugar market on open. Stop at: 18.41, tgt at 20.36


Sugar Futures Falling WedgeI think that the indicator I have developed is working really well in sugar futures. From this point of view and due to the fact that sugar futures have a wedge, I think that there is an initial upside potential of 7% and then if the wedge is broken, I think that sugar futures can go up to $23.

Sell July Sugar market on open, stop 19.09, tgt TBDDowntrend in Sugar picking up steam. Sell July Sugar market on open, stop 19.09, tgt TBD


sugar monthlySugar losing some more ground on the monthly chart.
The correction is deepening...
momentum breakdown

SB ShortSB has sell signal based on COT report. Also seasonal trend is down. Weekly trend changed from up to down trend. The daily trend is in a down trend. Currently we see correction. My plan is to use this correction to open a shot position. Usually I risk 2% per trade, but in a Drawdown to reduce the emotional pressure I reduce the risk to 1%.

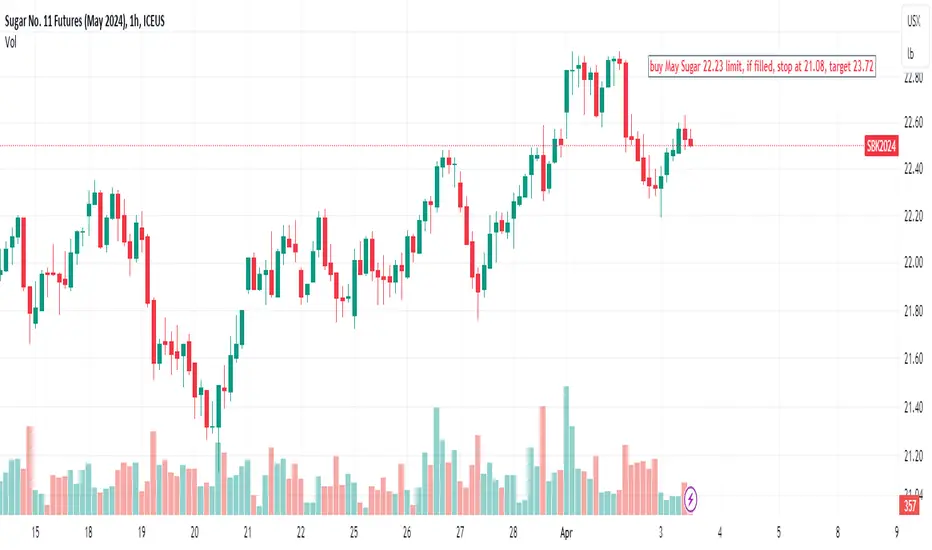
Buy May Sugar 22.23 limit, if filled, stop at 21.08, target 23.7Based on AI technical analysis, buy May Sugar 22.23 limit, if filled, stop at 21.08, target 23.72
Looking to buy May Sugar at 22.13, stop 21.54, tgt at 23.23Sugar is showing some recent strength and with Cocoa prices soaring we are looking for technicals to fuel short term rally. Looking to buy May Sugar at 22.13, stop 21.54, tgt at 23.23

SUGAR: Jan 30, 2024Returning to the current price action, I see an upward movement from the low of 20.01 to the current high of 24.59, unfolding in Three waves. The price action doesn't seem quite favorable; what I mean is that there appears to be one of the Fibonacci Multiple Relationships that is not clearly defined, and it doesn't follow the common Multiple ratios. However, in the Commodity market, as well as Metals, markets experience strong and rapid fluctuations.
Bottom line: Sugar may decline to a level lower before rising in wave 5. However, pay attention to the alternative wave count.
The big context suggests a Bear market, and the short-term outlook may rise higher, while the price remains above 22.50-22.98. A drop below this level indicates that the Bear market might be resuming.

SUGAR: Feb 7, 2024Analyst: Shane Hua (CEWA - Master Candidate),
Hi traders, today's forecast is on commodities. Well, commodities tend to experience rapid fluctuations, some of which bear similarities to Gold.
Previously, I forecasted that Sugar would decrease to a lower level, and it turned out to be accurate. If I remember correctly, my initial target was 22.98.
Now, I believe Sugar may have completed the fourth wave (blue), you know, the common retracement target for the fourth wave is 0.382. At least it seems to have a solid basis for completion, and I am expecting a rally to higher levels in the market. Yes, the low at 23.01 needs to hold firm; what I mean is that prices must consistently stay above it for my bullish view on Sugar to remain intact. Conversely, a drop below it indicates I was wrong, and then I will return to update my latest forecasts.
So, that's my forecast. Have a great time, goodbye my friends.

Sugar looks goodSugar looks good for a swing long, it bounced from a 5 year R1 level and untested demand zone.
I expect a retracement to R2 ( middle of range)

Sugar Futures Technical AnalysisSugar should find a temporary bottom around here as it comes into an upward trend line of support and runs into the 200-day EMA. If it were to bounce, there is some minor resistance at the $26.48 area. Otherwise, if that were to break, sugar would likely make a run to return to the highs. Now, if the 200-day EMA and the upward trend line were to break, there would be some minor support at $23.31, which most likely would lead to a small countertrend rally. Otherwise, the more significant support levels are down at $21.81 and $20.35.

Sugar futures Gan square on the price action and rsi. It’s really cool to see the fibs and gans get respected on the time part of the chart. (Any angle or verticals line= time)

Sugar: Knock Knock🚪The sugar price has now reached the upper border of the pink trend channel. It should now break through this line, as it should continue to rise significantly with the yellow wave b. We expect the high to be in the green target zone between USX 28.72 and USX 30.84, which will then allow for new declines.

Sugar, Silver and InflationIt really doesn't get more EPIC than this 50 year chart patterns!
We will see eventually see these in classical chart trading books...
Else, I'll have to write my own book!
#silver #sugar #inflation

Long March Sugar at Market, Sell Stop Loss 24.93; Target 26.97Technicals and chart patterns indicate a slow steady move higher in soft commodity March Sugar for duration 2 days-2 weeks.

NEW YORK SUGAR FUTURES: ST DOWNSIDE CORRECTION IS TAKING PLACEThe New York Sugar Futures continues performing as anticipated. The expected ST downside correction is taking place .
