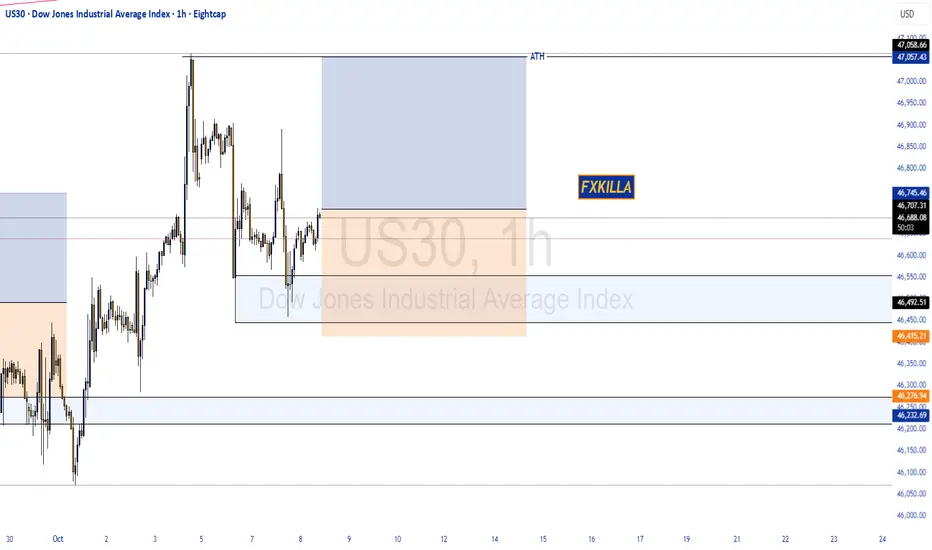
DOW JONES HIGH PROBABILITY SETUP SOON!!!🚨 DOW30 HIGH PROBABILITY BUY SETUP 🚨
* Here We Can See Clearly The Next Potential Move For US30 Coming Hours/Days.
* Keep Your Eyes Close On Your Trading Positions.
* Happy PIP Hunting Traders.
FXKILLA.
Trade ideas
US30: Consecutive breakouts signal an emerging downtrend
SPREADEX:DJI – When price rejects the high, the market begins to shift
On the 30-minute chart, price action is clearly signaling a loss of bullish momentum and a transition toward a bearish structure.
________________________________________
🧠 Price Action Analysis
1. First Failed Breakout
Price initially broke above the ascending trendline that had held since early October — but failed to hold the breakout.
➤ A classic early warning of buyer exhaustion, often seen during distribution phases.
2. Multi-Layered Resistance Zone
The 46,725 – 46,779 region has become a clustered resistance zone, rejecting price repeatedly.
➤ Multiple rejections here suggest dominant selling pressure, with strong supply overhead.
3. Second False Breakout
A more subtle second breakout attempt followed — but again, price was swiftly rejected.
➤ Consecutive failed breakouts typically indicate a lack of conviction and precede sharp reversals.
________________________________________
📉 Trend Structure Has Shifted Bearish
• Lower highs and lower lows now visible
• Price broke below the previous trendline
• Pullback attempts failed to reclaim broken support
• Market is respecting resistance instead of support
➡ These are clear signs of a short-term downtrend emerging.
________________________________________
🔻 Trading Strategy: Favoring Sell Setups in the New Bearish Context
✴️ Scenario 1: Sell at Retest of Proven Resistance Zone
• Optimal Sell Zone: 46,700 – 46,750
• This area has already triggered two failed breakouts — a third touch could be the ideal trap for late buyers
• Watch for bearish rejection candles (pin bars, bearish engulfing, etc.)
Suggested Sell Limit Order:
→ Entry: 46,730
→ Stop Loss: 46,830 (above prior swing high)
→ TP1: 46,500
→ TP2: 46,300
→ Risk-Reward: At least 1:2
_______________________________________
✴️ Scenario 2: Momentum Sell on Breakdown of Local Support
• Trigger Level: 46,580 — if price breaks below with strong momentum (long red candle, increased volume)
• Confirms trend continuation after consolidation
Suggested Sell Breakout Order:
→ Entry: 46,580
→ Stop Loss: 46,680
→ Target: 46,350 – 46,200
→ Tip: Use smaller position size if breakout appears weak to avoid getting trapped in a fakeout
________________________________________
🎯 Trade Management
• Only enter trades with clear price rejection or momentum confirmation
• Move SL to breakeven after TP1 is hit to lock in safety
• Exit the trade if price closes above 46,830 — that would invalidate the bearish thesis
________________________________________
False breakouts leave a trail — for those who know how to read it. It's not a failure. It’s the market whispering that direction has changed.
Please like and comment below to support our traders. Your reactions will motivate us to do more analysis in the future 🙏✨
Harry Andrew @ ZuperView

US30 - Potential BuyHi traders,
We are looking to BUY CMCMARKETS:US30
Stay tuned :)
Price Action:
Short-term sell bias toward 41,700 zone based on lower high and projected weakness.
Watch reaction at 41,700—if buyers return strong with a new higher low, it resumes uptrend.
Invalidation: If price breaks above 42,800 with strength and closes above, sellers are overwhelmed—trend continues.
Good Luck :)
Study, Study, Study! Lorenzo Tarati


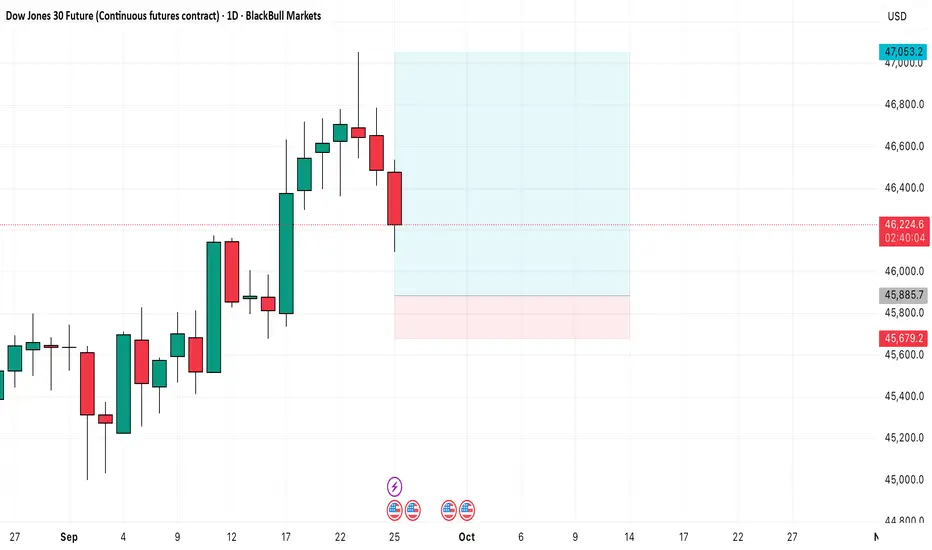
DOWFUT long setupDOWFUT long setup
Entry - 45885.7
Stop loss - 45679.2
Target - 47053.2
Risk Reward - 1:5.65
US30: Next Move Is Up! Long!
My dear friends,
Today we will analyse US30 together☺️
The recent price action suggests a shift in mid-term momentum. A break above the current local range around 46,689.60 will confirm the new direction upwards with the target being the next key level of 46,759.66 and a reconvened placement of a stop-loss beyond the range.
❤️Sending you lots of Love and Hugs❤️
DowJones pre US Open key trading levelsKey Support and Resistance Levels
Resistance Level 1: 46908
Resistance Level 2: 47014
Resistance Level 3: 47210
Support Level 1: 46493
Support Level 2: 46409
Support Level 3: 46270
This communication is for informational purposes only and should not be viewed as any form of recommendation as to a particular course of action or as investment advice. It is not intended as an offer or solicitation for the purchase or sale of any financial instrument or as an official confirmation of any transaction. Opinions, estimates and assumptions expressed herein are made as of the date of this communication and are subject to change without notice. This communication has been prepared based upon information, including market prices, data and other information, believed to be reliable; however, Trade Nation does not warrant its completeness or accuracy. All market prices and market data contained in or attached to this communication are indicative and subject to change without notice.

Us30 Trade Set Up Oct 7 2025Price is approaching a 4h FVG, if price respects it i will take sells to SSL but if price trades through it i will wait for PDH to be swept before looking for sells
www.tradingview.com

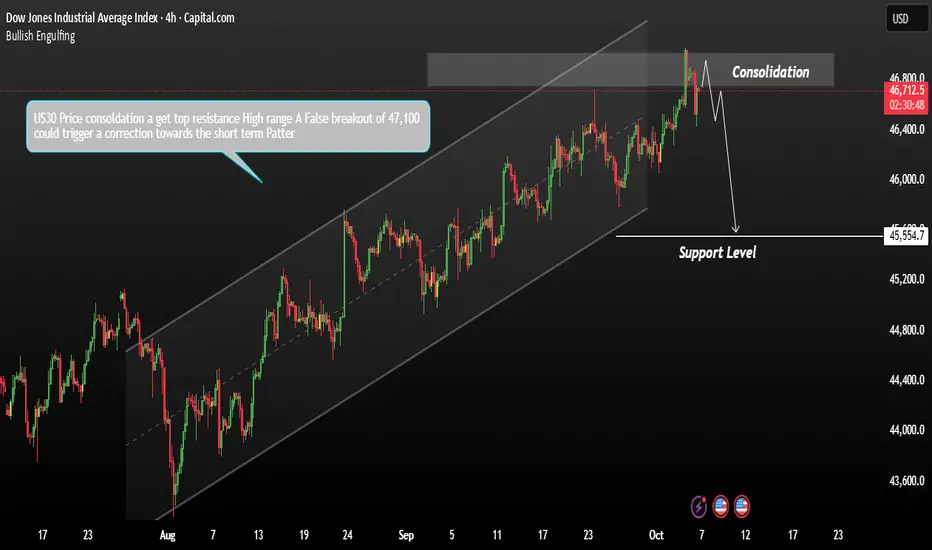
US30 Possible False Breakout and Short-Term The US30 has recently shown strong consolidation near its top resistance zone, forming a new record high around 47,100. However, the breakout above this level appears to be losing momentum, raising the possibility of a false breakout.
If price fails to hold above 47,100 and shows signs of rejection, this could trigger a short-term corrective move each key support and resistance zone highlighted on the chart remains critical to watch. The market’s reaction — whether a clean breakout or a rejection — will likely determine the next directional move should the index respect the current resistance and reverse, the next significant short-term support to monitor is located near 45,500.
You may find more details in the chart.
Trade wisely best of luck.
Ps; Support with like and comments for better analysis Thanks for Supporting.
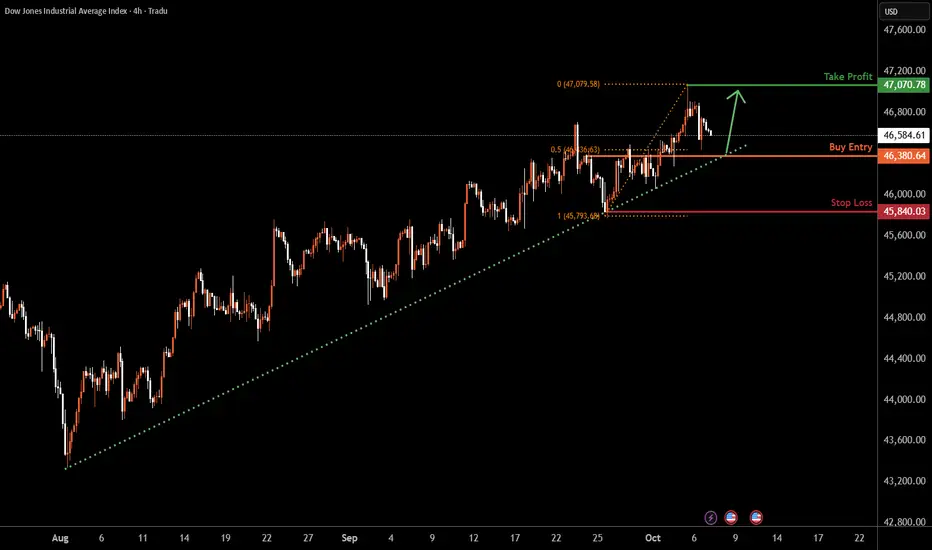
US30 H4 | Continuation Of Bullish MomentumBased on the H4 chart analysis, we could see the price fall to the buy entry at 46,380.64, whichis a pullback support that aligns with the 50% Fibonacci retracement and could bounce from this level to the upside.
Stop loss is at 45,840.03, which is a pullback support.
Tak eporfit is at 47,070.78, which is a swing high resistance.
High Risk Investment Warning
Trading Forex/CFDs on margin carries a high level of risk and may not be suitable for all investors. Leverage can work against you.
Stratos Markets Limited (tradu.com ):
CFDs are complex instruments and come with a high risk of losing money rapidly due to leverage. 65% of retail investor accounts lose money when trading CFDs with this provider. You should consider whether you understand how CFDs work and whether you can afford to take the high risk of losing your money.
Stratos Europe Ltd (tradu.com ):
CFDs are complex instruments and come with a high risk of losing money rapidly due to leverage. 66% of retail investor accounts lose money when trading CFDs with this provider. You should consider whether you understand how CFDs work and whether you can afford to take the high risk of losing your money.
Stratos Global LLC (tradu.com ):
Losses can exceed deposits.
Please be advised that the information presented on TradingView is provided to Tradu (‘Company’, ‘we’) by a third-party provider (‘TFA Global Pte Ltd’). Please be reminded that you are solely responsible for the trading decisions on your account. There is a very high degree of risk involved in trading. Any information and/or content is intended entirely for research, educational and informational purposes only and does not constitute investment or consultation advice or investment strategy. The information is not tailored to the investment needs of any specific person and therefore does not involve a consideration of any of the investment objectives, financial situation or needs of any viewer that may receive it. Kindly also note that past performance is not a reliable indicator of future results. Actual results may differ materially from those anticipated in forward-looking or past performance statements. We assume no liability as to the accuracy or completeness of any of the information and/or content provided herein and the Company cannot be held responsible for any omission, mistake nor for any loss or damage including without limitation to any loss of profit which may arise from reliance on any information supplied by TFA Global Pte Ltd.
The speaker(s) is neither an employee, agent nor representative of Tradu and is therefore acting independently. The opinions given are their own, constitute general market commentary, and do not constitute the opinion or advice of Tradu or any form of personal or investment advice. Tradu neither endorses nor guarantees offerings of third-party speakers, nor is Tradu responsible for the content, veracity or opinions of third-party speakers, presenters or participants.
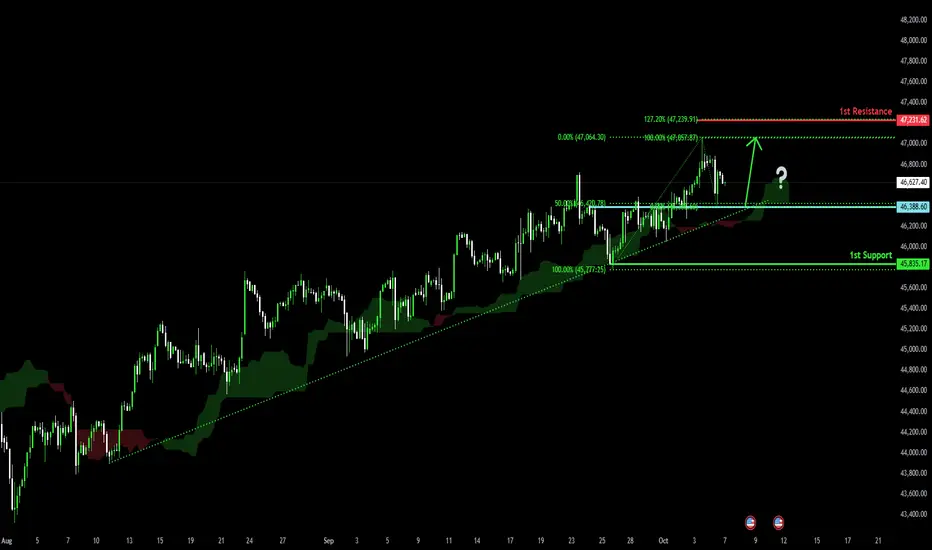
Bullish continuation?Dow Jones (US30) is reacting off the pivot and could bounce to the 1st resistance.
Pivot: 46,388.60
1st Support: 45,835.17
1st Resistance: 47,231.62
Disclaimer:
The above opinions given constitute general market commentary, and do not constitute the opinion or advice of IC Markets or any form of personal or investment advice.
Any opinions, news, research, analyses, prices, other information, or links to third-party sites contained on this website are provided on an "as-is" basis, are intended only to be informative, is not an advice nor a recommendation, nor research, or a record of our trading prices, or an offer of, or solicitation for a transaction in any financial instrument and thus should not be treated as such. The information provided does not involve any specific investment objectives, financial situation and needs of any specific person who may receive it. Please be aware, that past performance is not a reliable indicator of future performance and/or results. Past Performance or Forward-looking scenarios based upon the reasonable beliefs of the third-party provider are not a guarantee of future performance. Actual results may differ materially from those anticipated in forward-looking or past performance statements. IC Markets makes no representation or warranty and assumes no liability as to the accuracy or completeness of the information provided, nor any loss arising from any investment based on a recommendation, forecast or any information supplied by any third-party.

ANALYSIS OF THE CURRENT 5-YEAR BULL CYCLEWe would look at the 20 year cycle in the stock market, there are two individual 20-year cycles running together at a time. One cycle defines tops and the other identifies the major market lows. We would also look at the 20- year periodicity of repeating market fractals and the 5-year bull cycle that commences at the beginning of each 20-year cycle.
In subsequent updates we will identify the 8 - 13 subdivision of the 20-year cycle. To make the chart clean we have only indicated the cycle that defines bottoms. Top cycles will be identified in the description and both cycles combined on one linear scale to see how they relate to the 5-year bull cycle.
Our pivot point is taken at the 22nd August 1921 low.
First Cycle duration:
22/08/1921 - 27/04/1942 = (7553 days /1079 weeks /248.2 months)
= 20 years, 08 months, 05 days.
Cycle 2:
27/04/1942 - 25/06/1962 = (7364 days / 1052 weeks / 242 months)
= 20 years, 01 month, 29 days.
Cycle 3:
25/06/1962 - 16/08/1982 = (7357 days / 1051 weeks / 241.7 months)
= 20 years, 01 months, 22 days
Cycle 4:
16/08/1982 - 07/10/2002 = (7352 days / 1051 weeks / 241.7 months)
= 20 years, 01 month, 21 days
Cycle 5:
07/10/2002 - 10/10/2022 = (7308 days / 1044 weeks / 240.1 months)
= 20 years, 0 month, 03 days
By observation, cycle 3 and 4 have the same duration 7357 days while cycle 2 is (+7 days) off 7357 days, i.e 1 candle on the weekly timeframe. Now, looking at the beginning points of each cycle, within the identified ellipses we see a striking fractal that has been consistent in all 5 cycles.
Cycle 1 and 2
Cycle 3 and 4
Cycle 5 and 6
The 20-year cycle that defines tops are on :
27th May 1946
7th February 1966
24th August 1987
8th October 2007
XX - XX - 2027
Cycle 1 origin point is on 22/08/1921 but has a split focus at two points, one on the 1921 pivot and the other on the much popular May 1924 low.
Representing both cycles (Bottoms and tops)
This shows that between the two origin points is approximately a 5-year cycle
This cycle is actually an astrocycle and varies according to the changing speed.
By observation, Fractal 1 is very much identical to fractal 4 and fracal 2 very much identical to 5. A time span of 60 years averagely separate fractals 1 and 4 as well as 2 and 5. This leaves the 1962 - 1966 cycle, 60 years from 1962 puts the origin for the new identical fractal at the October 2022 low.
The above justifies that if the cycle is not inverted then a point on the current price action should not be broken. Also it negates the numerous calls for a crash that has been chanted since the 2020 low and never materialized.
HOWEVER, there is the 101-year cycle which alternate tops for bottoms and vice versa after its completion, and considering the pivot from 22/08/1921 the 101 years ended at the October 2022 low.
Interesting... check back as we would go through the numerical expansions that shed more light on what to expect forward, price levels, and time resistances.
Thanks for your time, all opinions are much appreciated, questions would be answered too.
Good luck.

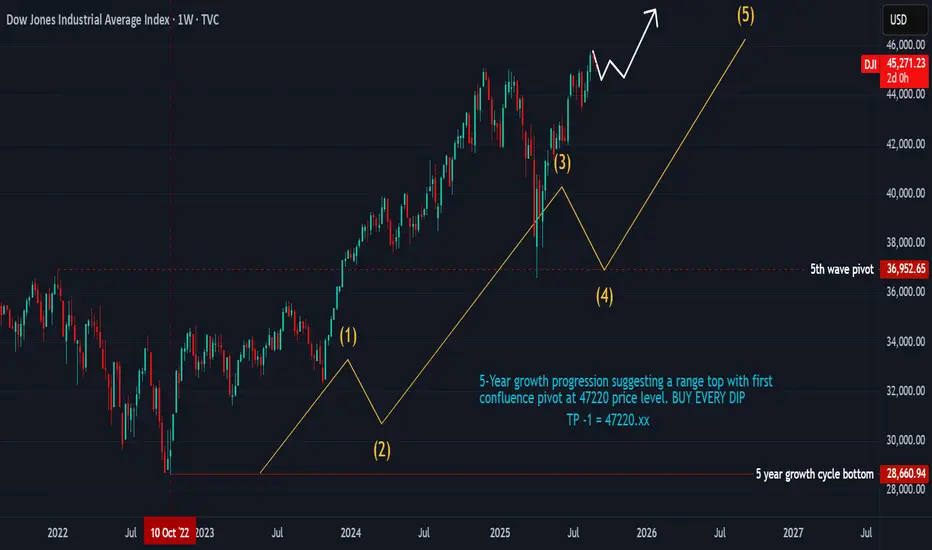
BUY EVERY DIP, HOLD FOR THE NEXT 7-MONTH CYCLE UNTIL OCTOBERThere are the current turmoil by tariffs and perceived recession, yet, the cycles strongly support a further advance from the March lows until October 2025. The bottom in March 2020 formed the base for the 5 year bull cycle nested within the larger 13 year cycle.
PRICE
The 2020 crash low formed at 18213.65, the decline in 2022 formed a bottom at 28660.94. We would have a price range Low - Low of (+10447.29 pts)
(28660.94 - 18213.65) = 10447.29 units
By projection if the range between the first two bottoms is 10447.29 we would expect the third bottom connecting three expanding points to be at 1.618 of 10447.29 points from 28660.94
28660.94 + (10447.29 x 1.618) = 45564.66
This makes the current top at 45073.63 through 45564.66 level a major support whereas its also a minor resistance for some correction and we expect price to move through this level.
TIME
Time connecting the three points 23/03/2020 - 03/01/2022 - 10/10/2022 with March 2020 as starting point would give us a time count (0.0 - 651 days - 931 days).
We find that between the two bottoms the top in Jan 2022 came in at 651 days. By projection we expect the next bottom to be at least 209 weeks or 1463 days from 10/10/2022 with a top located at a Phi variation of 651.
We would project a time range 1064 - 1099 days for a top and a decline into the third bottom 1463 days from 10/10/2022 and 2394 days from 23/03/2020. Trade safe, good luck.

THE BIG TOP ... THE MID-CYCLE CORRECTION COMES SOONTHE BULL IS NOT DEAD YET...
Alternate Cycle progression puts 1942 - 1947, 1982 - 1987. and 2022 - 2027 on the same phase of a larger 20-year cycle. This is the smallest growth cycle that completes in approximately five (5) years. It forms the first section of every alternate 20-year cycle and carves out a very identical fractal. This fractal remerges every 40 to 43 years. This is the basis of Gann's 43-year cycle repetition.
1942 - 1947 5-year cycle
1982 - 1987 Cycle
2022 - 2027 Cycle in progression
Putting the price and time advances into a cumulative progression suggests that we are getting closer to a first correction at 47200 level. It also suggests that the next time and price for the current cycle is measurable and quantifiable with a very slim margin for error.
27th October is a major timeline to watch
Beyond that we have March 2026
TRADE PLAN:
We will close all buy entries in October
We will buy again in May 2026 for another 2-year bull cycle.
Follow for more updates
Believe or not, it's not TrumpThis is where all your dollars are about to be made or lost depending on your faith. Watch and learn.

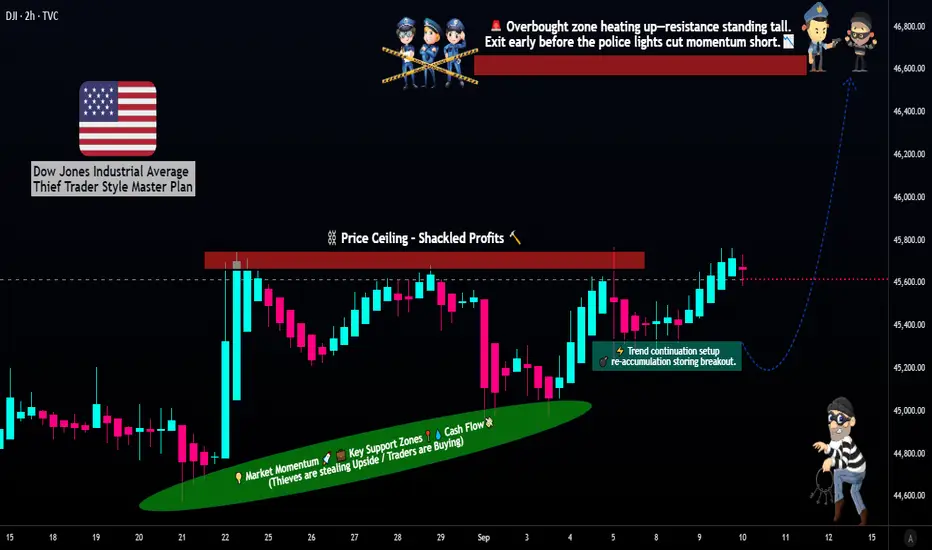
Can the DJIA Maintain Its Momentum? A Strategic Long Setup📈 DJIA Money-Making Plan: Thief Strategy (Swing/Day Trade) 🕵️♂️
🚀 Swing/Day Trade Setup for Dow Jones Industrial Average (DJIA) CFD
Join the "Thief OG" crew with this bullish plan to navigate the market with precision! Using a layered limit order strategy, this setup targets smart entries and calculated exits while keeping risk management first. Let’s dive into the plan! 💥
📊 Trade Plan Overview
Asset: Dow Jones Industrial Average (DJIA) CFD 💰
Direction: Bullish 🐂
Current Price (Sep 10, 2025): 45,711 🟢 (+0.43% from previous close)
Strategy: Thief Layered Limit Order Strategy 🕵️♂️
Place multiple buy limit orders at key levels to "steal" entries during pullbacks.
Suggested Entry Levels: $45,400, $45,500, $45,600, $45,700 (or customize based on your analysis).
Note: You can add more layers or adjust levels to suit your risk appetite. Flexibility is key! 🔧
Stop Loss (SL): $45,100 (Thief OG’s starting point).
Important: Adjust your SL based on your strategy and risk tolerance. This is a suggestion, not a rule! ⚠️
Target Price (TP): $46,600 (Escape before the "police barricade"!).
Note: Set your own TP based on your goals. Take profits at your discretion—don’t follow blindly! 💸
Risk Disclaimer: Dear Traders (Thief OG’s), this plan is a guide, not a guarantee. Always trade at your own risk and adjust SL/TP to your strategy. Protect your capital! 🛡️
🧠 Why This Plan? Thief Strategy + Market Insights
The "Thief" strategy uses layered limit orders to capitalize on pullbacks in a bullish trend, backed by solid market data. Here’s why this setup shines:
Thief Technical Strategy 🕵️♂️:
Layered Entries: Multiple buy limit orders ($45,400–$45,700) allow you to scale into the trade during dips, maximizing entry precision.
Risk Management: Suggested SL at $45,100 protects against unexpected reversals. Customize to your comfort level.
Profit Potential: Target $46,600 aligns with resistance levels and recent momentum. Exit strategically to lock in gains.
Fundamental & Macro Score: 7/10 (Solid Foundation) 🟢
Earnings Growth: Expected 7-10% for 2025, driven by strong corporate balance sheets.
Sector Strength: 10/11 S&P sectors up YTD, with tech and industrials leading.
Macro Environment:
Cooling inflation (CPI ~3.1% YoY).
Fed rate cuts expected, supporting growth.
Mild headwinds from tariffs and global trade risks.
Resilient labor market (unemployment 4.3%) and consumer spending fuel upside.
Trader Sentiment Outlook 😊:
Retail: 51% Bullish 🟢 | 34% Bearish 🔴 | 15% Neutral ⚪
Optimism driven by dip-buying in tech and industrials.
Institutional: 45% Bullish 🟢 | 40% Bearish 🔴 | 15% Neutral ⚪
Cautious positivity, focusing on corporate fundamentals amid policy uncertainties.
Overall Mood: Mildly positive, but stay alert for volatility from trade talks or inflation data.
Fear & Greed Index: 51 (Neutral) ⚖️
Balanced emotions: Not too scared, not too greedy.
Steady momentum, but watch for volatility spikes with upcoming data (e.g., inflation reports).
Market Outlook: Bullish 🚀
Bullish trend intact with no recession signals.
Expect modest single-digit % gains, led by earnings.
Stay cautious of pullbacks from policy news, but avoid shorting for now.
🔗 Related Pairs to Watch (in USD)
S&P 500 CFD ( SP:SPX ): Tracks broader market trends, often moves in tandem with DJIA.
NASDAQ 100 CFD ( NASDAQ:NDX ): Tech-heavy index, great for confirming bullish momentum.
FX:USDJPY : Currency pair sensitive to U.S. economic data and Fed policy.
OANDA:XAUUSD (Gold): Safe-haven asset; monitor for risk-off moves if sentiment shifts.
📝 Final Notes
This DJIA setup combines the tactical "Thief" layered entry strategy with robust market data to guide your trades. Stay disciplined, manage risk, and adapt the plan to your style. Let’s make smart moves together! 💪
✨ “If you find value in my analysis, a 👍 and 🚀 boost is much appreciated — it helps me share more setups with the community!”
#TradingView #DJIA #SwingTrading #DayTrading #ThiefStrategy #Bullish #TechnicalAnalysis #MarketAnalysis

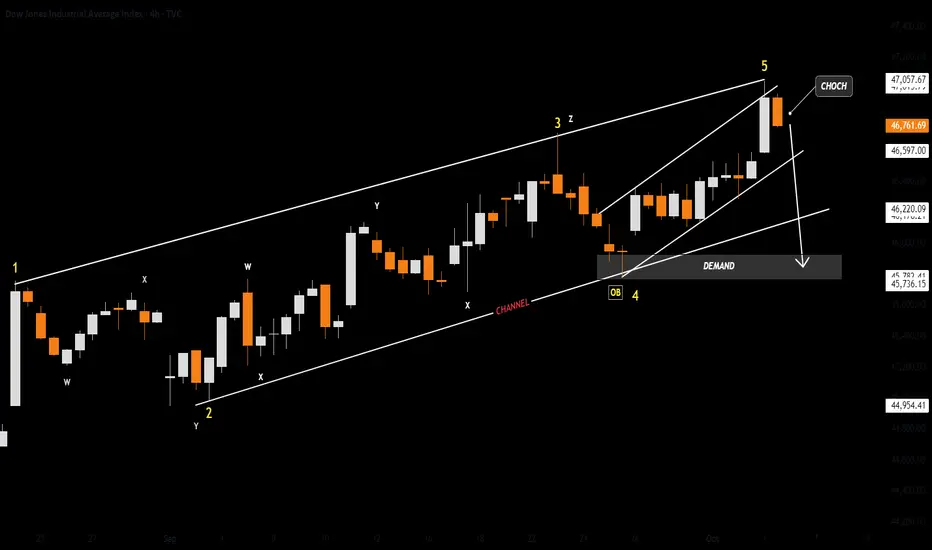
US30DJI - Dow Jones
- Break of Structure
- Bullish Channel as an corrective pattern in Short Time Frame
- Completed " 12345 " Impulsive Waves
- Change of Characteristics
- Order Block
Us30 Trade Set Up Oct 6 2025Price made made ATH last week and is bullish making HH/HL on the 1h. There is a bullish 4h FVG under SSL and a bearish 1h FVG above BSL so i want to see either one tapped into first followed by a 1m IFVG/CISD to take to the level that wasnt tapped yet
www.tradingview.com

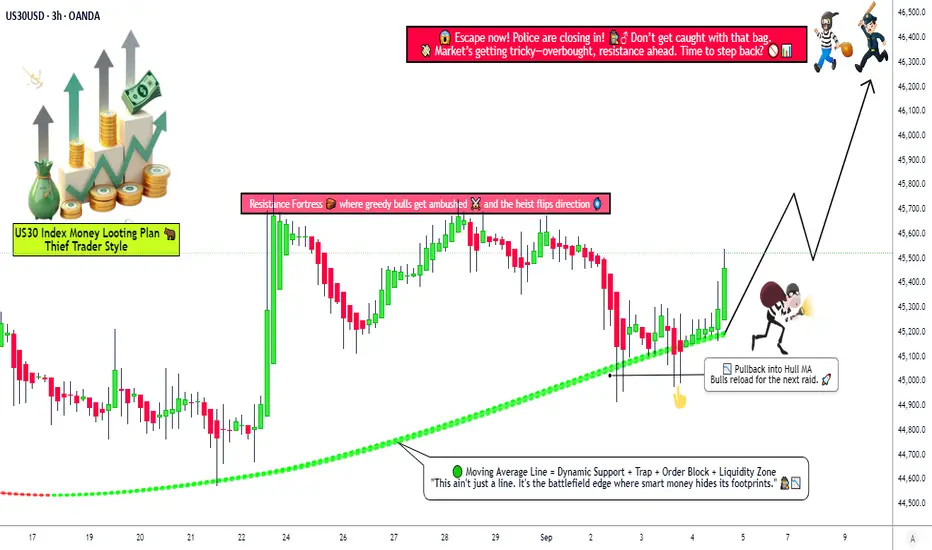
Dow Jones Bullish Strategy! Can the Market Break Higher?🚀 US30 Index Money-Making Plan (Swing / Day Trade) 📊
🧠 Trading Plan & Strategy (Thief Layer Style)
🚀 Approach: Bullish Hull Moving Average pullback plan — “bulls reloaded” for the next wave.
🎯 Entry (Layering Strategy): Multiple buy-limit layers → 45,200 • 45,300 • 45,400 • 45,500 (flexible to add more based on your own plan).
🛡️ Stop Loss: Reference point at 45,000. Adjust SL responsibly to match your personal risk tolerance & style.
💰 Target: Potential resistance zone (the “police barricade”) sits near 46,300. That’s where traders may consider taking profits.
📢 Note: This is an illustrative plan based on technicals — every trader should adapt TP/SL to their own strategy and risk appetite.
📊 US30 Market Report – September 4, 2025
📈 Current Price Snapshot
Trading near 45,000 points, up 0.05% today.
Strong monthly performance (+2.4%) and robust yearly gains (+17%).
Market showing resilience despite trade tensions.
😊 Retail Traders’ Sentiment
60% long vs 40% short → Tilted bullish.
Optimism driven by hopes for earnings growth & Fed rate cuts.
Caution remains due to tariff risks.
🏦 Institutional Traders’ Outlook
Cautiously bullish positioning.
Demand for equities continues, but with moderated exposure.
Buybacks + foreign inflows supporting price action.
🌡️ Overall Investor Mood
Neutral to positive tone.
Economic resilience balanced against policy uncertainty.
Healthy breadth across sectors, not just tech.
😨 Fear & Greed Index
Currently at 52 (Neutral).
Suggests balance — no extremes dominating.
Neutral setups often precede steady gains.
💹 Fundamental Score → 8/10
Strong corporate earnings (+12–13% growth projected next year).
Balance sheets remain solid.
AI & tech themes boosting key components.
Tariffs still a drag, but diversified exposure helps.
🌍 Macro Score → 7/10
US GDP growth cooling to 1.5%, but global rebound supports outlook.
Inflation ~2.9%; Fed rate cuts expected later.
Labor market stable, policy clarity could add upside.
🐂 Overall Market Outlook: Bullish Bias 📈
If support at 45,000 holds, potential move higher toward 46,000+.
Drivers: Strong earnings, Fed easing, broad rally.
Watch: Trade news headlines remain a key risk factor.
🔎 Why This Plan?
Hull MA pullback indicates momentum continuation.
Layered entries provide flexibility & better risk distribution.
Market sentiment + fundamentals align with bullish bias.
Resistance at 46,300 offers a clear take-profit zone.
📌 Related Pairs to Watch
CAPITALCOM:US30
FOREXCOM:SPX500
EIGHTCAP:NDQ100
TVC:VIX
TVC:DXY
✨ “If you find value in my analysis, a 👍 and 🚀 boost is much appreciated — it helps me share more setups with the community!”
#US30 #DowJones #Indices #SwingTrading #DayTrading #TechnicalAnalysis #StockMarket #TradingPlan #HullMA #LayeringStrategy
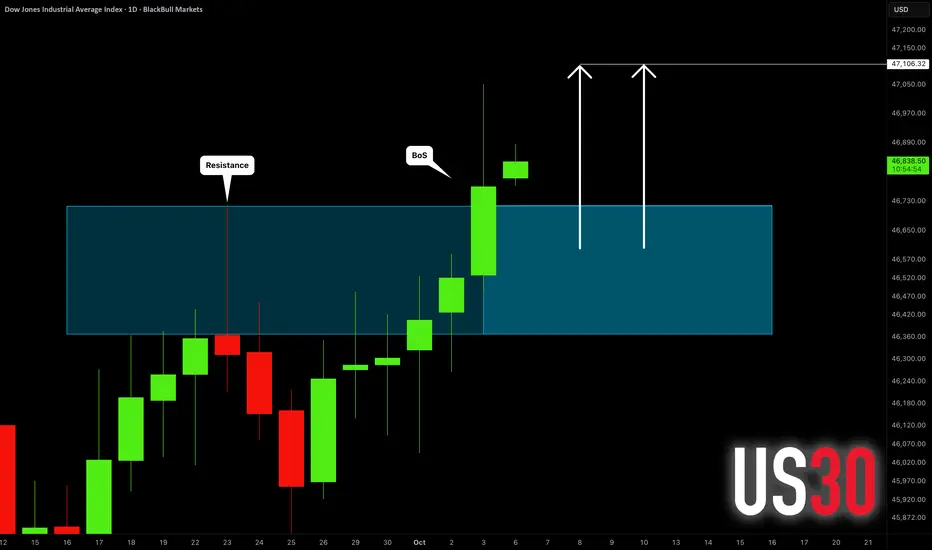
DOW JONES INDEX (US30): Another BoS Confirmed
US30 updated the all-time high on Friday, breaking and closing
above a major daily horizontal resistance cluster.
It opens a potential for more growth now.
Next resistance is 47100.
❤️Please, support my work with like, thank you!❤️
I am part of Trade Nation's Influencer program and receive a monthly fee for using their TradingView charts in my analysis.