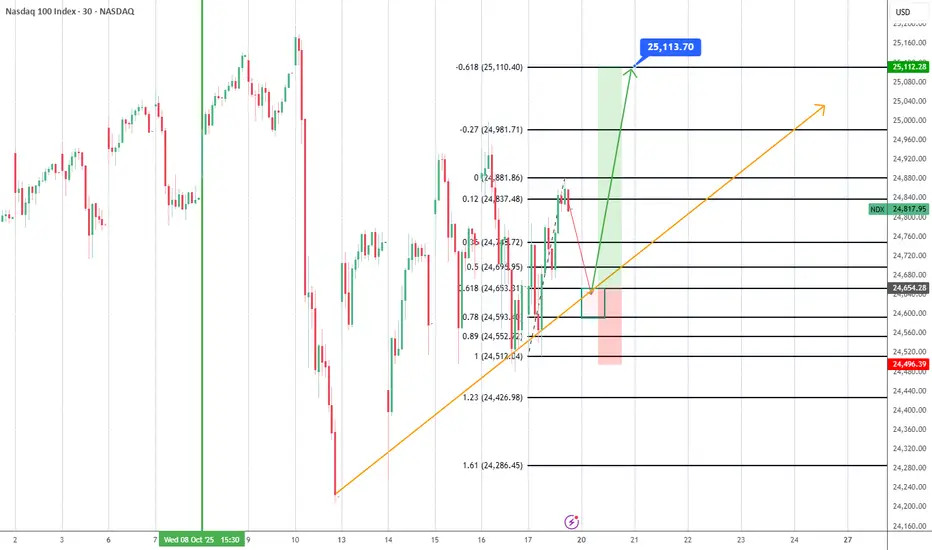
Weekly NASDAQ Outlook (NQ!)Last Friday, NQ! closed at 23,998.6, after a strong decline into the weekly close. When the market reopened on Monday, it gapped up — likely due to weekend events and news.
That gap has since been completely filled, and price has shown a solid push to the upside during the week.
For the coming week, I’m expecting NQ! to take out the all-time high and possibly form a new high.
However, before that happens, I’d like to see a retracement toward the 24,692.8 level, which could provide high-probability long setups.
There’s also a possibility that price won’t revisit this level and instead continues pushing higher directly, but a clean pullback into 24,692.8 would offer a great entry opportunity for longs.
📊 Outlook Summary:
- Expecting bullish continuation.
- Ideal retracement zone: 24,692.8.
- Main target: New all-time high above previous peak.
Trade ideas

selling offHigh risk low reward entry as price is showing of signs of slowing down it is still bullish. looking at the previous HTF HL areas are target places.

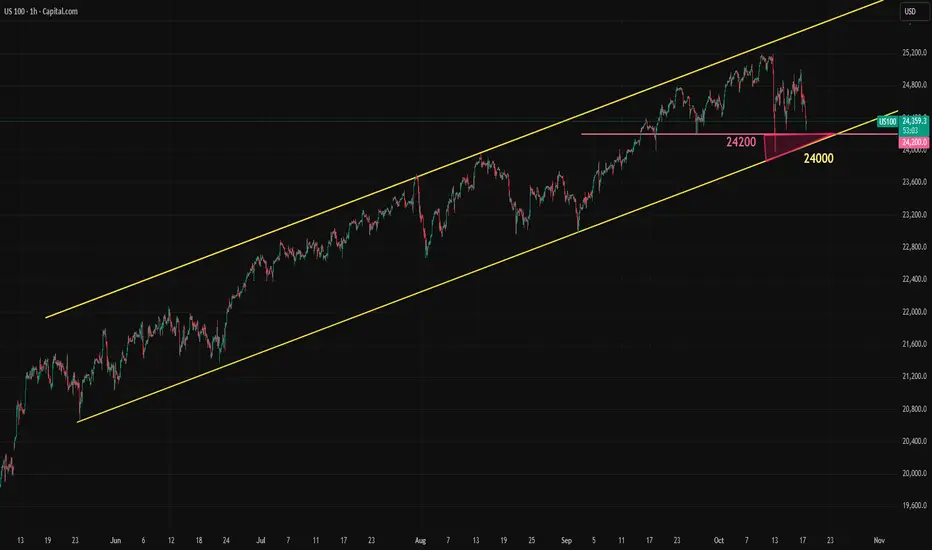
Nasdaq Nears Decision PointNasdaq remains within its bullish trend channel but is approaching a decision point. The 24,200 and 24,000 levels are two key supports holding back further downside. If these supports fail, it could trigger a multi-day selloff.
So far, the downward pressure has mostly come from regional banks, keeping the decline in Nasdaq limited. However, if concerns over the rare earth supply chain grow due to trade disputes between China and the US, this could trigger a broader selloff in Nasdaq.
NASDAQ100. HIGH PROBABILITY SETUP SOON!!!🚨 NAS100 HIGH PROBABILITY SELL SETUP 🚨
* Here We Can See Clearly The Next Potential Moves For US100 Coming Hours/Days.
* Keep Your Eyes Close On Your Trading Positions.
* Happy PIP Hunting Traders.
FXKILLA.

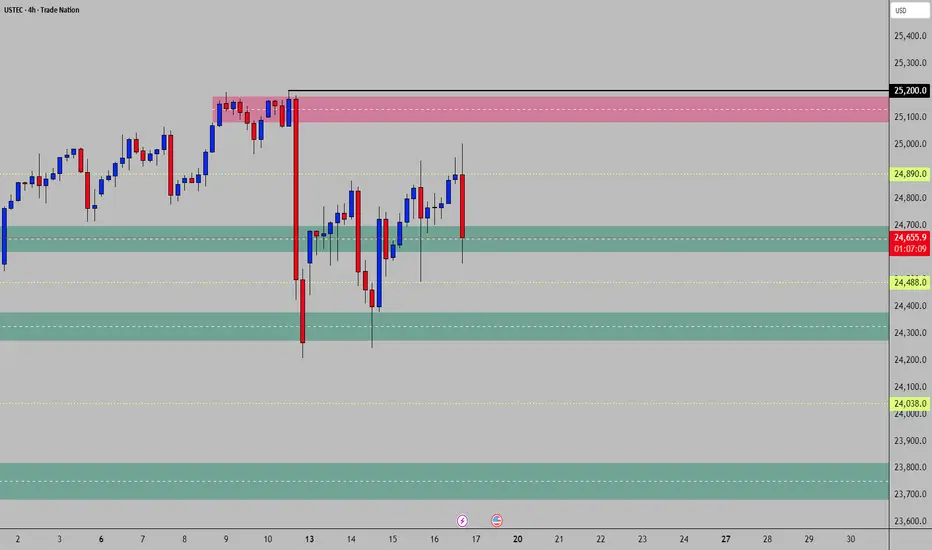
NAS100 - High Volume Control🔶 USTEC Trading Card
🔑 Pivot Zone: 24,600 - 24,700 (Primary Demand)
📊 Context: Bullish trend in correction | Current 24,776.9
⚠️ Key Levels:
Immediate Resistance = 25,080 - 25,180 (Major Supply)
Lower Support = 24,280 - 24,380
Deep Support = 23,670 - 23,820
────────────────────────────────────────────────
🟢 Bullish Scenario
Bias Flip: Already active (pullback within uptrend)
Trigger: Long from 24,600-24,700 when price shows upward demand - wick below
🎯 T1 = 24,900
🎯 T2 = 25,080
🎯 T3 = 25,180
❌ Invalidation: Back below 24,500
────────────────────────────────────────────────
🔴 Bearish Scenario
Bias Flip: Clear breach below 24,600
Trigger: Short on break below 24,600 with downward supply confirmation
🎯 T1 = 24,330
🎯 T2 = 24,038
🎯 T3 = 23,820
❌ Invalidation: Back above 24,800
US100 - BEARISH POSSIBILITYPrice is already bearish in higher timeframe (H4). And is currently creating bearish tendency in the lower timeframes. We can observe a slow support breakout which can be a crucial confirmation of a bearish continuation. This is purely ideas purpose only and should not be used alone to take on a trade. Good profits traders.

NAS100 4h Bearish move confirmed across multiple timeframes
Based on the breakout observed on the 4-hour timeframe and its confirmation on the 30-minute chart — which itself was validated by the M5 structure break within the highlighted golden zone — we expect the price to continue its decline toward the first daily support level.
This setup provides a strong risk-to-reward ratio, as illustrated on the chart.
As always — stay patient, follow your plan, and trust your analysis.
QQQ - NASDAQ Has Never Been This ExpensiveQQQ relative to the money supply reveals that markets have never been this expensive in history. Despite the significant amount of money pumped in during the COVID-19 pandemic, the economy has not kept pace with all the zeros added to Gov debt.
If we can't lower deficits now at max employment, when will we?
Tulips!
Caution is in order despite what "experts" may tell you.
Click like Follow Subscribe, let's get to 5,000 followers.

NASDAQ INDEX (US100): Bullish Move After the Trap
I see a confirmed liquidity grab below a key horizontal support
on an hourly time frame.
A formation of a cup & handle pattern and a breakout of its neckline
afterward suggest a strong buygin interest.
The market will rise more and reach at least 25023 level.
❤️Please, support my work with like, thank you!❤️
I am part of Trade Nation's Influencer program and receive a monthly fee for using their TradingView charts in my analysis.
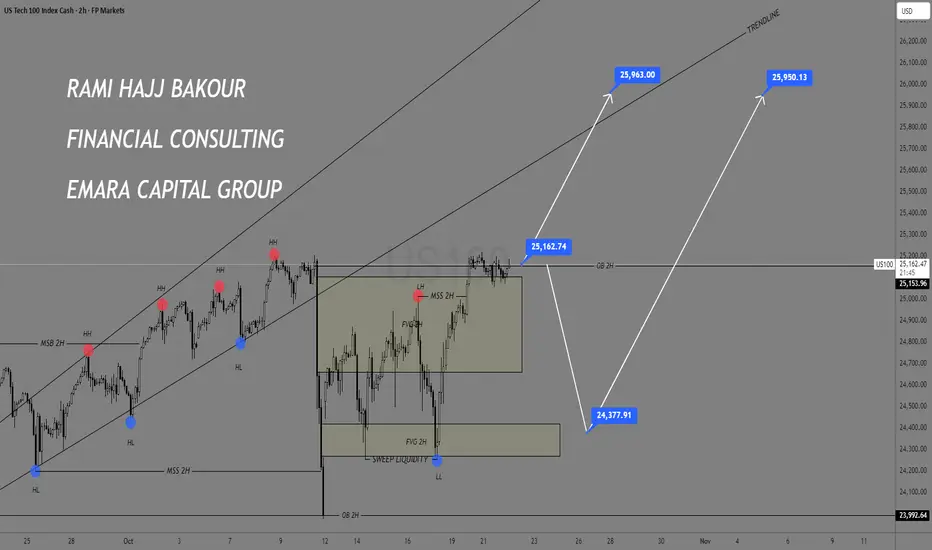
NASDAQ 100 (US100) Technical Analysis
The Nasdaq is moving within a rising channel on the 2H timeframe, after sweeping liquidity from previous lows and rebounding from the FVG 2H demand zone.
The likely scenario is a continuation of the bullish move toward 25,960 – 26,000, aligning with the upper trendline and potential resistance area.
However, a failure to hold above 25,160 may trigger a corrective pullback toward 24,380 before any renewed bullish momentum.
📊 Fundamental Outlook:
The Nasdaq remains supported by stable U.S. bond yields and easing Fed tightening expectations, along with positive earnings from major tech firms.
However, slower growth in parts of the tech sector and upcoming inflation data could temporarily limit further upside momentum.
📅 Short-term Bias: Bullish
🎯 Upside Targets: 25,960 – 26,000
📉 Pullback Target: 24,380
⛔ Invalidation Level: Below 23,990
#US100 #NASDAQ #TechnicalAnalysis #EmaraCapital #Rami_Hajj_Bakour #Trading #Markets
US100 - LONG POSSIBILITYPrice is curently at at crucial point since it's sitting on a broke previous resistence zone which have a very high chance of being use as a support zone. This is purely ideas purpose only and should not be used alone to take on a trade. Good profits traders.
Nas100 Trade Set Up Oct 22 2025Price has swept PDH and a daily BSL with a closure under leaving lots of SSL levels and daily FVG that i will target for sells after BSL being swept on the 15m

Nas100 Trade Set Up Oct 21 2025Price took PDH and is currently failing to break out of a strong daily resistance area so i will be looking for sells towards 4h FVG and SSL

Big Bearish Day- A Weakness or Buying OpportunityNasdaq is in a strong uptrend. It broke above 23,966 and shot up to 25,191
As it has been taking support at 50EMA multiple times on daily chart, the recent fall of more than 1200 points was contained exactly near the same level.
From the price action point of view-
The fall ceased near the previous breakout zone near 23966, previous resistance acted as support.
A single candle on the daily chart with no continuation has to be an attempt to sweep liquidity below important swing lows near 24200 and 24000 (see 4H chart).
The action near 24250 is also reflecting absorption.
The psychological round number of 25000 could stay as resistance for some time and again push it back in the 24,400 to 24,500 zone offering a short-term low risk buying opportunity.
In this backdrop, 24000 to 24250 zone, accompanied by the strong trend in the background, may again cushion the price back to new highs.
What is your point of view?
Is the recent fall a sign of weakness or an opportunity to buy?
#Educational post not a recommendation to buy or sell.

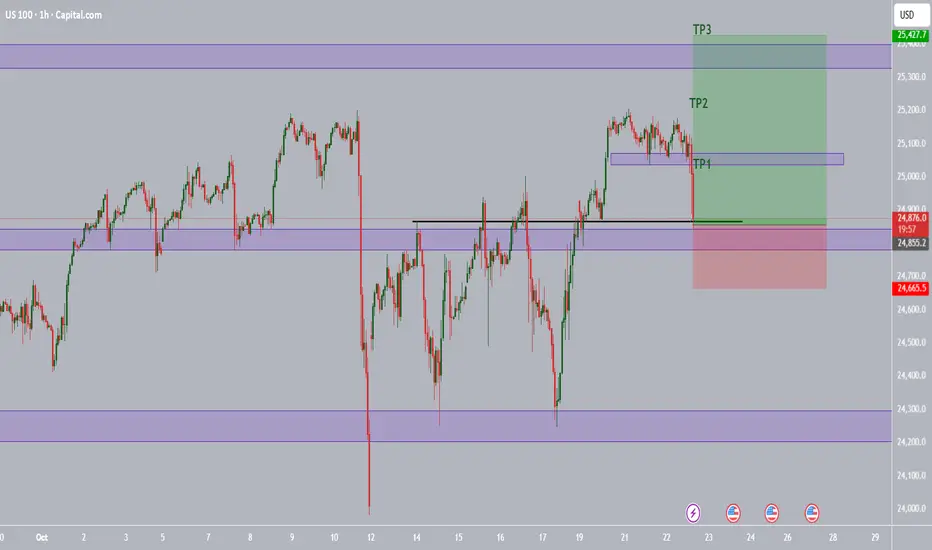
US100: Breakout signals a strong second bullish leg🧩 Market Context
On the 30-minute chart, SKILLING:US100 index shows renewed bullish momentum after a phase of sideways consolidation. Following a deep correction, price action has started forming higher highs and higher lows, suggesting that buyers are gradually regaining control.
🔍 Price Structure and Breakout
Price has recently broken out above a short-term consolidation zone and a rising trendline.
This breakout reinforces the short-term bullish bias and could mark the start of a second upward leg in the current recovery.
Statistically, when a breakout happens after tight accumulation, the next bullish leg often becomes equal to or larger than the previous one, as momentum builds and buyers gain confidence.
📈 Key Price Levels
• Resistance 1: 24,914 – prior rejection zone in the last upward move.
• Resistance 2: 25,074 – distribution area before the previous drop.
• Support: 24,700 – 24,750 (former resistance now acting as potential support).
⚙️ Trading Scenarios (for observation only)
• After the breakout, price may retest the previous resistance zone (around 24,700–24,750) before continuing higher.
• If buyers defend this level, the second bullish leg could extend toward 24,914 and possibly 25,074.
• Conversely, a close back below 24,700 may trigger a deeper pullback before any continuation attempt.
🧠 Summary
The technical structure on US100 favors a short-term bullish outlook. A successful retest of the breakout zone could pave the way for a second upward leg, potentially matching or exceeding the size of the previous rally.
______________________________________
📌 This analysis is for educational and technical purposes only. It does not constitute financial advice or a recommendation to buy or sell any asset.
Please like and comment below to support our traders. Your reactions will motivate us to do more analysis in the future 🙏✨
Harry Andrew @ ZuperView

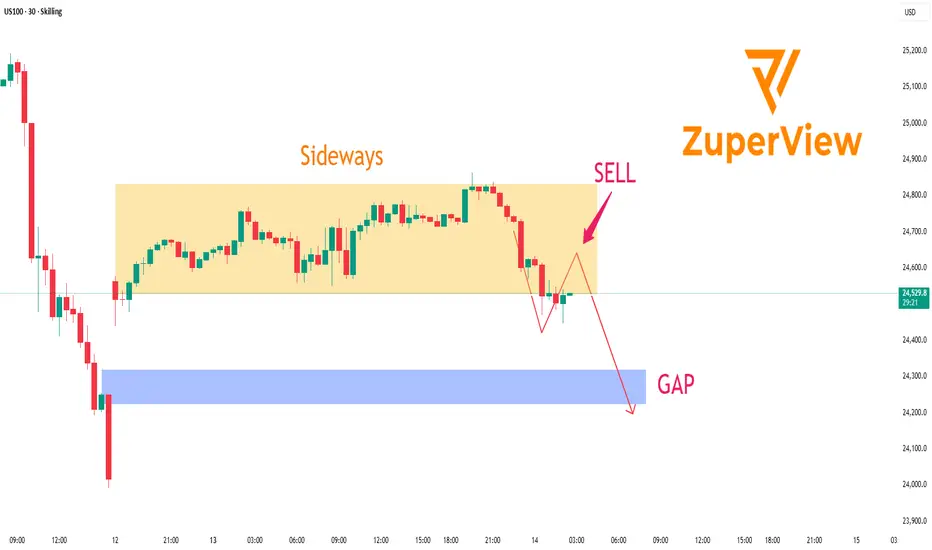
US100: Pullback to fill the GAP below
🧩 SKILLING:US100 – Pullback scenario targeting the GAP support zone
📊 30-Minute Chart Analysis
On the 30-minute timeframe, US100 is showing signs of a short-term corrective move after failing to hold its previous support zone.
Price is currently trading below the Trend indicator’s resistance area, suggesting that sellers have regained temporary control.
After a strong drop, the market is forming a technical pullback to retest the resistance zone. This is often where traders look for opportunities to continue following the prevailing bearish momentum.
________________________________________
🧭 Trading Scenario (For Analysis Purposes Only)
• Potential SELL Zone: 24,650 – 24,740 (resistance and Trend zone)
• Target Area: 24,250 – 24,350 (GAP support area below)
• Invalidation Level: Above 24,750 — if price closes above this level, the short-term bearish structure could be invalidated.
________________________________________
🔎 Technical Outlook
• Short-term trend: Bearish
• Market structure: Forming a pullback–continuation pattern
• Trend indicator: Has flipped bearish, confirming renewed selling pressure
• GAP support: Likely to act as a key area for potential stabilization or reaction from buyers
________________________________________
⚠️ Important Note
This analysis is for educational and informational purposes only and should not be considered financial advice.
Traders should combine this view with their own risk assessment, price action, and macroeconomic context before making any trading decisions.
________________________________________
💡 Summary:
US100 is in a short-term correction phase. If price continues to reject the 24,700 resistance area, the downside scenario toward the 24,250–24,350 GAP support zone remains valid.
________________________________________
Please like and comment below to support our traders. Your reactions motivate us to do more analysis in the future 🙏✨
Harry Andrew @ ZuperView
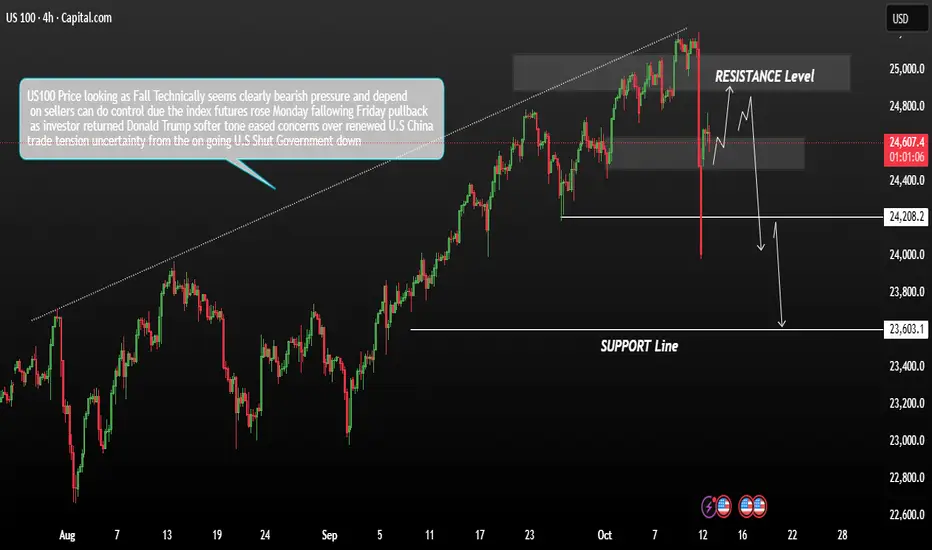
US100 currently showing signs of persistent bearish pressureThe US100 index is currently showing signs of persistent bearish pressure. Following Friday’s pullback, futures rose slightly on Monday as investors reacted to a softer tone from Donald Trump, which eased some concerns over renewed U.S.–China trade tensions. However, broader market uncertainty remains elevated due to the ongoing U.S. government shutdown and cautious sentiment in equities.
From a technical perspective, the US100 is maintaining a bearish trend structure. If price action fails to sustain above current levels and instead tests the resistance zone before reversing, it could confirm continued weakness. If sellers regain control near resistance, we may expect potential downside targets around 24,200 and also 23,600m Momentum remains on the downside as long as price stays below the resistance threshold, suggesting sellers are still dominating the short-term outlook.
You may find more details in the chart.
Trade wisely best of Luck.
Ps; Support with like and comments for better analysis Thanks for Suipporitng.
NASDAQ ready to continue up.We are positioning for long entries in the Nasdaq, anticipating that the VIX will continue its decline toward calmer levels at Monday’s open. This aligns with the observed rotation out of defensive sectors and the increasing risk appetite in cyclical and growth-oriented sectors.
The setup suggests a risk-on environment, with potential for sectoral leadership shifts favoring tech and high-beta equities, as implied volatility contracts and market sentiment improves.
US100: Needs a healthy pullback before breaking highs🧭 SKILLING:US100 (30-Min Chart) – The Market Needs a Pause Before the Breakout
After a strong recovery from the 24,200 area , the US100 has shown an impressive upward acceleration, forming a steep speed line that pushed price back toward the previous highs around 25,150 – 25,250 — a major resistance zone where sellers previously dominated.
However, as price reaches this area, the bullish momentum is starting to fade. Smaller candles and indecisive movements reveal hesitation — buyers are still in control, but the strength that carried the market this far is beginning to weaken.
If we look closely at the market structure, it’s clear that the index has been trying to reclaim the entire prior range, but that effort hasn’t come easy. After such a fast rally, the market looks overextended, and bulls may need a healthy pullback to gather enough energy for a real breakout.
________________________________________
🔍 Technical Outlook
• The 25,150 – 25,250 zone remains the key resistance area. If price keeps getting rejected here, short-term sellers might step in.
• A corrective move toward 24,850 – 24,950 (the pink zone) would not be surprising.
• That area should be watched closely — if buyers defend it strongly, it could become the launchpad for another push toward new highs.
________________________________________
🎯 Personal View
The overall structure still favors the bullish side, but momentum needs a reset.
A short-term pullback shouldn’t be seen as weakness — it’s an opportunity for the market to rebalance before the next leg up.
If the 24,850 zone holds, the probability of a true breakout above 25,250 increases significantly, potentially opening room toward 25,400 – 25,500 in the next sessions.
________________________________________
💬 In summary:
The US100 has worked hard to reclaim lost ground, but breaking above the previous top will require fresh momentum. A short-term correction could be exactly what the market needs to build a stronger foundation for a sustainable rally.
Please like and comment below to support our traders. Your reactions will motivate us to do more analysis in the future 🙏✨
Harry Andrew @ ZuperView

NSDQ100 Key trading levelsKey Support and Resistance Levels
Resistance Level 1: 24908
Resistance Level 2: 25050
Resistance Level 3: 25200
Support Level 1: 24376
Support Level 2: 24205
Support Level 3: 23920
This communication is for informational purposes only and should not be viewed as any form of recommendation as to a particular course of action or as investment advice. It is not intended as an offer or solicitation for the purchase or sale of any financial instrument or as an official confirmation of any transaction. Opinions, estimates and assumptions expressed herein are made as of the date of this communication and are subject to change without notice. This communication has been prepared based upon information, including market prices, data and other information, believed to be reliable; however, Trade Nation does not warrant its completeness or accuracy. All market prices and market data contained in or attached to this communication are indicative and subject to change without notice.

Trendline BreakThe price broke out of a bearish trendline which was a small consolidation as we are still in a bullish trend, the price made a pullback and now looks to continue its bullish run
WE ONLY TRADE PULLBACKS
Comment your thoughts

NASDAQ Short There is a lot of resistance, as it is at an all-time high and is unable to break this level
There are 2 patterns on M15 and M30 showing a potential reversal zone
This is against the H4 trend; however, it is overbought on H1
RSI is showing strong divergence with a triple top on H1
Stoploss above 21300
First target 24870 or when M15 is oversold

take asia? nihaumaybe we can take out asia high today and revers?? double top out of the playbook like so many gurus wil say
full margin full risk best of luck to everybody we'll see in a moment
