IDUSDT — Consolidation at Key Support, Breakout or Breakdown?🔎 Technical Overview
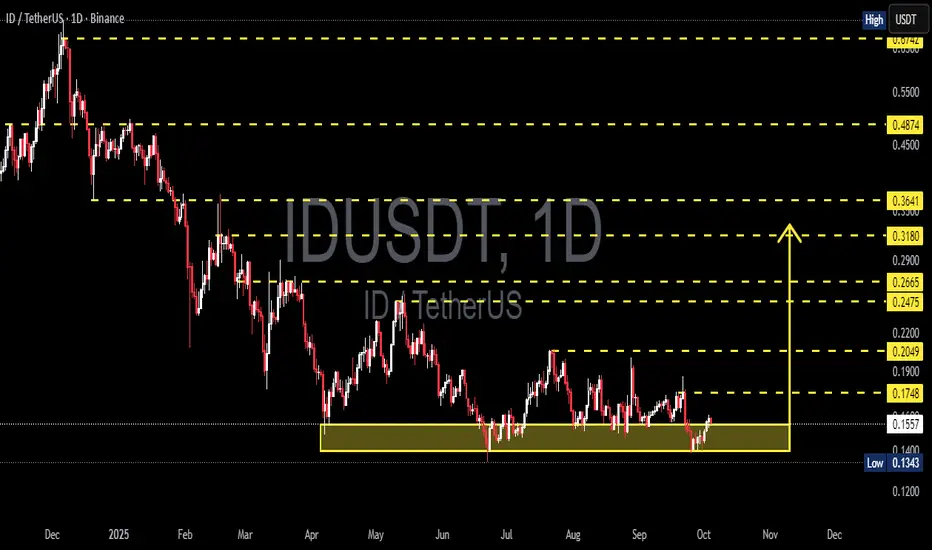
IDUSDT is currently consolidating within a major support zone at 0.1343 – 0.1554 (highlighted yellow box on the chart). This level has been tested multiple times since May 2025, proving that buyers are still defending it.
The price action forms a rectangle accumulation zone, b
Related pairs
IDUSDT UPDATE#ID
UPDATE
ID Technical Setup
Pattern: Bullish Falling Wedge Pattern
Current Price: $0.1779
Target Price: $0.298
Target % Gain: 65.80%
BME:ID is breaking out of a falling wedge pattern on the 1D timeframe. Current price is $0.1779 with a target near $0.298, showing about 66% potential upside.

IDUSDT 1D#ID is moving inside a symmetrical triangle on the daily timeframe. In case of a breakout above the triangle resistance and the daily SMA200, the potential targets are:
🎯 $0.2203
🎯 $0.2468
🎯 $0.2734
🎯 $0.3112
🎯 $0.3593
⚠️ Always remember to use a tight stop-loss and follow proper risk management.

ID/USDT — Long Consolidation for Reversal or Breakdown Ahead?📌 Overview
The ID/USDT pair has been moving in a prolonged consolidation phase since May 2025, trapped within a tight accumulation box between 0.1343–0.1674.
This zone has acted as a critical demand area, tested multiple times but still holding strong, showing significant buyer defense.
However, t

IDBINANCE:IDUSDT
#ID/ USDT
Entry range (0.1500- 0.1650)
SL 4H close below 0.1460
T1 0.18
T2 0.26
T3 0.30
Extra Target is optional 0.45
_______________________________________________________
Golden Advices.
********************
* collect the coin slowly in the entry range.
* Please calculate

IDUSDT 1D#ID is on the verge of breaking above the symmetrical triangle and the daily SMA100. Keep an eye on it — a confirmed breakout could trigger the following targets:
🎯 $0.2125
🎯 $0.2608
🎯 $0.2999
🎯 $0.3390
🎯 $0.3946
⚠️ As always, use a tight stop-loss and apply proper risk management.

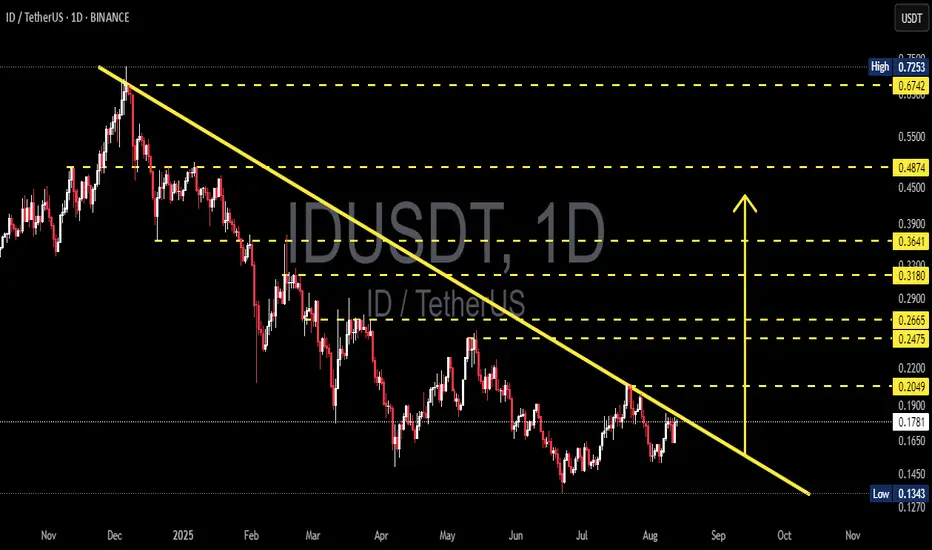
ID/USDT — Final Battle at the Multi-Month Downtrend Line!📌 Market Structure Overview
Since peaking in late 2024, ID/USDT has been trapped under a relentless multi-month downtrend line lasting almost 10 months. Every rally attempt has been shut down at this descending wall.
Now, the market is at a critical inflection point — price is pressing right agains
ID/USDT – Parabolic Reversal LoadingPrice action is coiling for a parabolic move, signaling the early stages of a major reversal trend. Accumulation structure is forming as buyers step in to absorb supply, creating the foundation for a powerful breakout. A confirmed push above key resistance could ignite the next impulsive leg, shifti

$IDUSDT 1D chart The BINANCE:IDUSDT 1D chart shows a potential breakout from its long downtrend.
Price recently bounced off a strong demand zone at $0.1785 and is now testing above the descending trendline.
If momentum holds, a move toward the $0.4004 target +131% is possible.
Watch for strong volume confirma

IDUSDT Analysis ID ~ 4D Analysis
#ID Buy on retesting this buy zone or buy on successful breakout of the resistance line of this pattern. With a short term target of at least 10%+.

See all ideas
Summarizing what the indicators are suggesting.
Oscillators
Neutral
SellBuy
Strong sellStrong buy
Strong sellSellNeutralBuyStrong buy
Oscillators
Neutral
SellBuy
Strong sellStrong buy
Strong sellSellNeutralBuyStrong buy
Summary
Neutral
SellBuy
Strong sellStrong buy
Strong sellSellNeutralBuyStrong buy
Summary
Neutral
SellBuy
Strong sellStrong buy
Strong sellSellNeutralBuyStrong buy
Summary
Neutral
SellBuy
Strong sellStrong buy
Strong sellSellNeutralBuyStrong buy
Moving Averages
Neutral
SellBuy
Strong sellStrong buy
Strong sellSellNeutralBuyStrong buy
Moving Averages
Neutral
SellBuy
Strong sellStrong buy
Strong sellSellNeutralBuyStrong buy
Displays a symbol's price movements over previous years to identify recurring trends.
Frequently Asked Questions
The current price of SPACE ID / Tether SPOT (ID) is 0.1490 USDT — it has fallen −2.09% in the past 24 hours. Try placing this info into the context by checking out what coins are also gaining and losing at the moment and seeing ID price chart.
SPACE ID / Tether SPOT price has fallen by −0.93% over the last week, its month performance shows a −8.50% decrease, and as for the last year, SPACE ID / Tether SPOT has decreased by −57.64%. See more dynamics on ID price chart.
Keep track of coins' changes with our Crypto Coins Heatmap.
Keep track of coins' changes with our Crypto Coins Heatmap.
SPACE ID / Tether SPOT (ID) reached its highest price on Mar 17, 2024 — it amounted to 1.8400 USDT. Find more insights on the ID price chart.
See the list of crypto gainers and choose what best fits your strategy.
See the list of crypto gainers and choose what best fits your strategy.
SPACE ID / Tether SPOT (ID) reached the lowest price of 0.1343 USDT on Jun 22, 2025. View more SPACE ID / Tether SPOT dynamics on the price chart.
See the list of crypto losers to find unexpected opportunities.
See the list of crypto losers to find unexpected opportunities.
The safest choice when buying ID is to go to a well-known crypto exchange. Some of the popular names are Binance, Coinbase, Kraken. But you'll have to find a reliable broker and create an account first. You can trade ID right from TradingView charts — just choose a broker and connect to your account.
Crypto markets are famous for their volatility, so one should study all the available stats before adding crypto assets to their portfolio. Very often it's technical analysis that comes in handy. We prepared technical ratings for SPACE ID / Tether SPOT (ID): today its technical analysis shows the sell signal, and according to the 1 week rating ID shows the sell signal. And you'd better dig deeper and study 1 month rating too — it's sell. Find inspiration in SPACE ID / Tether SPOT trading ideas and keep track of what's moving crypto markets with our crypto news feed.
SPACE ID / Tether SPOT (ID) is just as reliable as any other crypto asset — this corner of the world market is highly volatile. Today, for instance, SPACE ID / Tether SPOT is estimated as 2.33% volatile. The only thing it means is that you must prepare and examine all available information before making a decision. And if you're not sure about SPACE ID / Tether SPOT, you can find more inspiration in our curated watchlists.
You can discuss SPACE ID / Tether SPOT (ID) with other users in our public chats, Minds or in the comments to Ideas.